

The background to my portfolio
Back in March 2015 I decided to invest £50,000 of my own money using 80-20 Investor. The purpose was twofold, firstly to show how you can use 80-20 Investor to invest and outperform the market with only a few minutes effort every now and then. Secondly, no other investment commentator, journalist or research provider invests their own money for fear of failing. This is a sorry state of affairs and is precisely why I committed to openly running my own portfolio for 80-20 Investor members to see.
Since then I have periodically changed my portfolio using the fund suggestions provided by the 80-20 Investor algorithm and associated research. I always disclose the changes at the time they are made.
Why March 2018 is a significant milestone - five-star rating?
1st March 2018 marked the 3rd anniversary of me running my £50,000 portfolio. In the world of fund management, a three-year track record is when a fund is usually awarded a fund rating by the numerous rating agencies. If that rating, which is usually based upon the performance over the last three years, is good then it's a cause for celebration as it means the fund house can plaster the good rating (perhaps 5 stars) all over their marketing material. In addition, financial advisers will only ever consider a fund once it has a three-year track record. Why this is the case is largely due to convention because financial advisers either do not have the ability or inclination to carry out their own fund analysis so they rely on fund ratings. The problem is that while some rating agencies use quantitative evidence to award a rating many also use qualitative factors and raise suspicions of collusion, especially as the fund houses have to pay to put the rating on their marketing material. Morningstar base their fund rating over the last 3 years and apparently adjusts this for risk. If you have funds within the Mixed Investment 40-85% Shares sector that have a four-star rating from Morningstar they have an average annualised return over the last three years of 6.88%. This compares to 7.77% annualised return for my £50,000 portfolio and over 6.8% for Morningstar 5 star rated funds.
So if I was a fund manager and my £50,000 portfolio had been a fund within the Mixed Investment 40-85% Shares sector would I now have a five-star rating? It's a hypothetical question but what I am trying to highlight is that 3 years ago when I started managing my portfolio I had no idea whether the market was about to crash (many people were predicting it would) or which funds would perform well and which wouldn't. I didn't know which asset mix would work and throughout the three years the weighting to equities has varied between 40% and over 70%. It is now just over 50%. With a process and very little effort, I was able to outperform 88% of funds within the Mixed Investment 40-85% Shares sector. What is even more comforting is the fact that I know many of you have performed even better.
Performance update
As is usual in my portfolio reviews, the chart below shows how my portfolio has outperformed since I started the challenge in March 2015, three years ago. The green line is the performance of my portfolio while the red line is the benchmark showing the average return achieved by professional fund managers given the same asset mix. To accurately calculate this I have used the average return for each sector in which my portfolio invested. The blue line shows what the average multi-asset fund with comparable equity content achieved. In other words, the red line would show the extra performance added by just the asset mix of my portfolio (where I was invested i.e European equities etc) over picking a typical multi-asset fund (the blue line). While the green line (which is my actual performance) shows the impact of being in the right funds at the right time, as identified by the 80-20 Investor algorithm.

So despite February's sell-off my portfolio has extended its lead over its benchmarks which is pleasing. The table below shows the total return since March 2015 for my portfolio, its benchmarks, a Vanguard passive tracker index which matched my portfolio's asset mix throughout and for the average managed fund from the Mixed Investment 40-85% Shares sector.
| Portfolio | Total return since March 2015 |
| My £50k portfolio | 26.11% |
| 50k challenge benchmark | 19.11% |
| Passive Vanguard benchmark | 18.89% |
| average Mixed Investment 40-85% Shares sector fund | 19.23% |
You may recall that last time I moved around 20% of my portfolio into cash while equity markets remained volatile, pending the publication of March's BOTB. At the time I explained that the change would provide some downside protection by reducing risk while remaining largely invested in equity markets. Only time would tell whether if it was a wise move, but just like any kind of insurance, I didn't really want it to be called upon. Since then markets have continued to be volatile, initially rebounding before stuttering. At one point they looked to be heading lower when Trump started imposing import tariffs as part of his protectionist (America first) agenda. Markets have since regained some poise. However, the switch only cost me 0.08% on the upside but would have potentially saved me much more had markets tumbled.
Of course, markets could turn lower tomorrow, next week or next month but we have no crystal ball to know for sure. Therefore as per my original plan, I am reinvesting the money I currently hold in cash, while reviewing my existing funds.
The table below shows my current portfolio, with those funds in green still in the BOTB while those in yellow are not in the BOTB but remain in the BFBS list. Meanwhile, any funds in red have dropped out of both shortlists.
| Name | Allocation % (rounded) | Risk | Sector | ISIN Code | SEDOL Code |
| 7IM US Equity Value | 13.5 | Medium | North America | GB00BWBSHX88 | BWBSHX8 |
| Baring Eastern Trust | 4.7 | High | Asia Pacific Excluding Japan Ret | GB0000799923 | 79992 |
| Fidelity China Consumer | 6.7 | High | China/Greater China | GB00B82ZSC67 | B82ZSC6 |
| Man GLG UK Income | 3.3 | Medium | UK Equity Income | GB00B0117B11 | B0117B1 |
| Neptune Japan Opportunities | 5 | Medium | Japan | GB00B3Z0Y815 | B3Z0Y81 |
| Premier Diversified | 19.1 | Low | Mixed Investment 40-85% Shares | GB00B8BJV423 | B8BJV42 |
| TM Cavendish AIM | 10.7 | High | UK Smaller Companies | GB00B0JX3Z52 | B0JX3Z5 |
| TwentyFour Dynamic Bond | 17 | Low | Sterling Strategic Bond | GB00B5KPRZ34 | B5KPRZ3 |
| Cash | 20 | Low |
|
The only fund within my portfolio that is not in either the BOTB or BFBS shortlists is the Neptune Japan Opportunities fund. With the Japanese stock market struggling as a result of the depreciating dollar those who had unhedged exposure had fared better as result of the falling pound. Neptune Japan Opportunities is mostly hedged and so the fund hasn't benefited from a kicker provided by a falling pound. As such it has dropped out of the 80-20 Investor lists. So I plan to make a like-for-like swap and replace it with the Jupiter Japan Income. Of the two Japan funds listed, it has the lowest max fall figure. You will see a general trend of all my new fund choices this month being chosen for their relatively lower max-fall figures versus their peers.
Of the remaining funds within my portfolio, all the others are either in the BOTB or their respective BFBS lists. That even includes Cavendish AIM once again which had slipped out last month. It was a fortuitous decision last time to stick with it. Given that most of my funds remain in the 80-20 Investor shortlists I plan on keeping changes to a minimum and will leave the rest of my portfolio as it is for now.
That does mean maintaining my global fixed interest exposure at a level higher than the BOTB but the correlations between bonds and equities have shown signs of falling once again. That leaves the portion of my portfolio invested in cash, which replaced a number of low and medium risk funds last month that were becoming increasingly correlated to equity markets.
As a result, I plan to invest the (almost) 20% I hold in cash and split it equally between the following funds:
- Neptune - Global Equity
- FP - Pictet Multi Asset Portfolio
- AXA - Framlington American Growth
- Standard Life Investments - UK Real Estate
By investing in the AXA Framlington American Growth fund and the Neptune Global Equity fund I not only bring my exposure to US equities higher, in line with the BOTB but it also increases my exposure to the technology sector. Those of you who have been reading my recent newsletters will have noted the importance of the technology sector not only to the current uptrend in equities but also the recovery we've seen since February's market correction. You will notice that I already hold the 7IM US Equity Value fund, which once again is in this month's BOTB. However, it does not have a significant exposure to tech stocks and barely any exposure to the renowned FAANG stocks (i.e Facebook and the like). So the AXA fund helps to provide some exposure to this sector of the US market that is driving any form of recovery at present. The reason why I chose the AXA fund over the other North American funds in this month's Best of the Best is purely down to the max fall figure with the hope that it will provide a reduced level of volatility if/when we get another sell-off in equity markets. The Neptune fund also as a slight tech bias but with a more global footprint. The reason why I preferred it over the Baillie Gifford fund is that it has retained its place in the BOTB despite the market sell-off. While it does have a slightly higher max-weekly fall figure it actually fared better than the Baillie Gifford fund during the market correction in February as shown in the chart below:
The other two funds are low-risk funds to diversify my portfolio and hopefully, reduce volatility. The Standard Life Investments UK Real Estate fund is a good bond fund alternative and actually made money (albeit not much) during the equity and bond market wobble. The other property in this month's BOTB has a bid/offer spread which is why I dismissed it. Following the Brexit vote in 2016 commercial property funds (like the Standard Life fund) which invest in actual properties faced a rush of redemptions as investors wrongly predicted that the market would collapse. This made me initially wary of investing given that Brexit negotiations remain ongoing. However, my exposure will be very limited (just 5%) and I don't plan on holding it forever. For now it's a temporary diversifier which has the potential to offer a little more upside than cash.
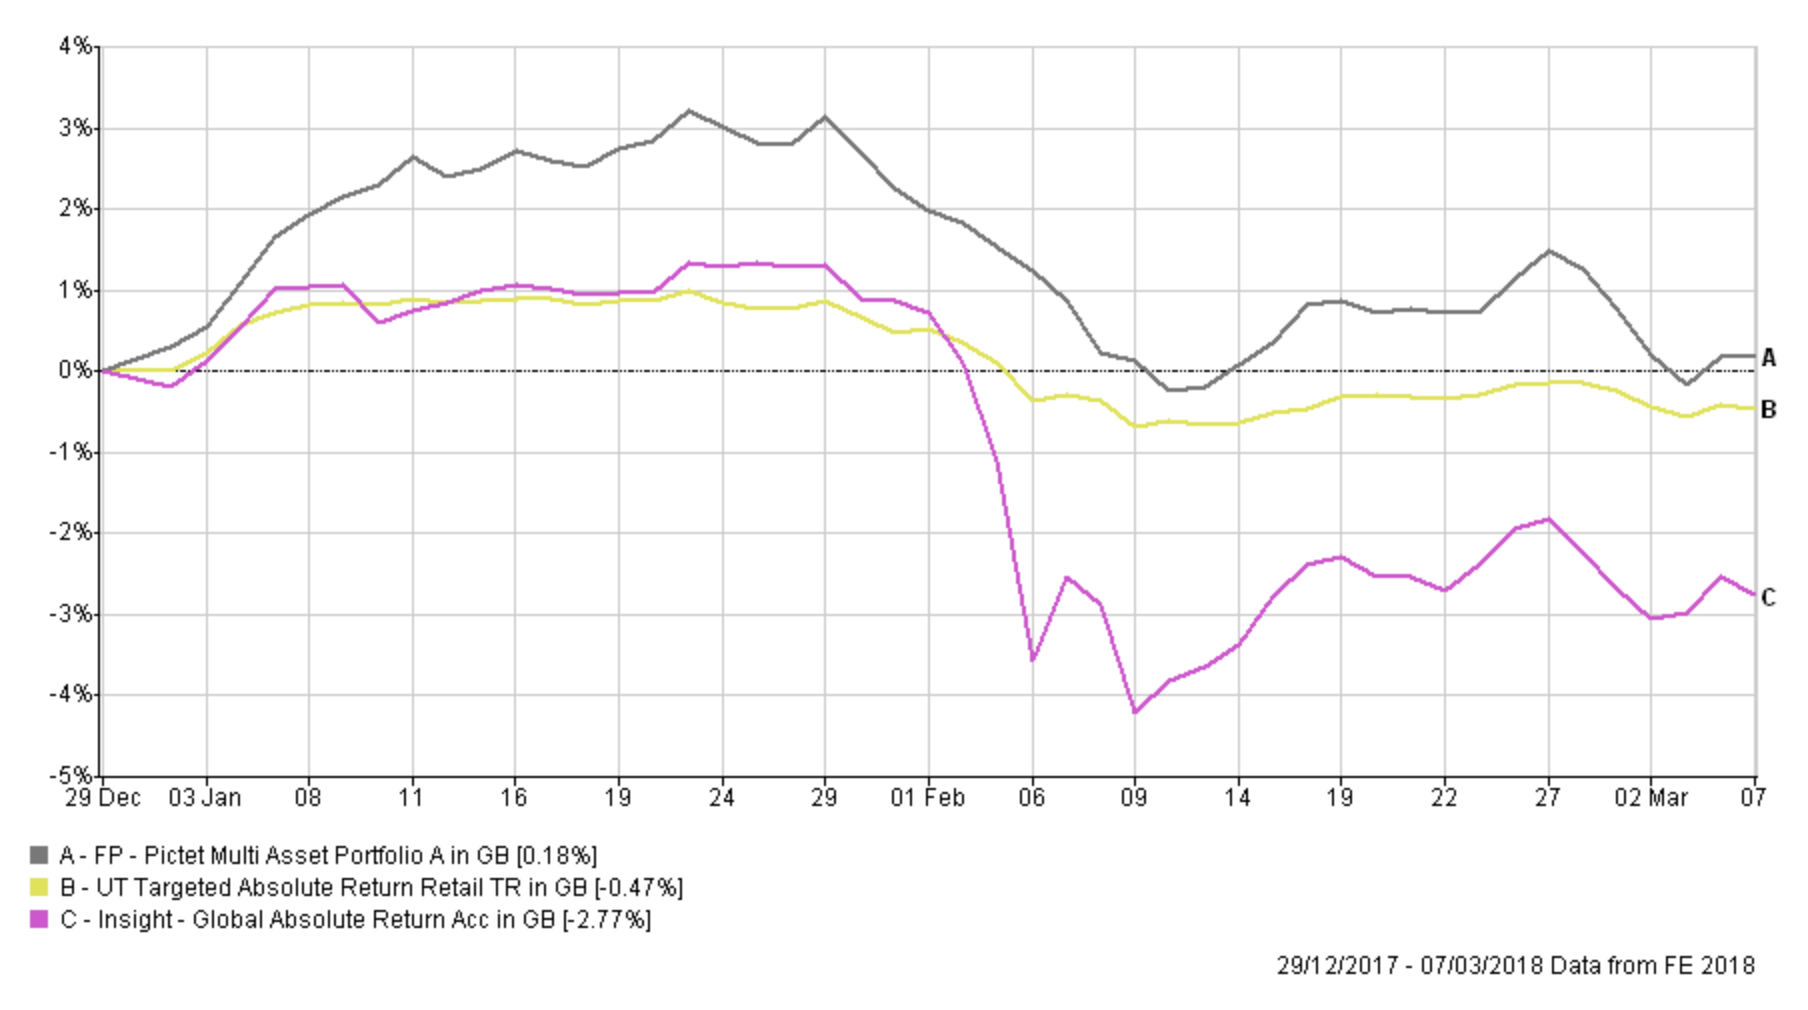
The final fund I have chosen is the FP Pictet Multi Asset Portfolio as it maintained its position within the BOTB across February and March. Previously my attempts to diversify my low-risk funds using a Targeted Absolute Return fund, namely the Insight Global Absolute Return fund didn't end well. The chart below shows how the Insight fund (which I got rid of last month) and the Pictet fund have fared so far in 2018.
While history never repeats exactly it often rhymes so it is an interesting exercise to see how the new portfolio would have fared during the sell from peak to trough compared to my previous portfolio with a near 20% cash weighting. While I have not produced the chart here to avoid confusion the difference is just 0.75% at its worst point before markets rebounded.
Fund switches
- 100% out of Cash and split equally (25% each) into each of Neptune Global Equity, FP Pictet Multi Asset Portfolio, AXA Framlington American Growth and Standard Life Investments UK Real Estate
- 100% out of Neptune Japan Opportunities and into Jupiter Japan Income
Overall I am only switching about 25% of my portfolio, nothing too drastic, and my new portfolio will look as follows with an equity exposure of around 60% (up from nearer 50% last month) and 12 funds.
| Name | Allocation % (rounded) | Risk | Sector | ISIN Code | SEDOL Code |
| 7IM US Equity Value | 14 | Medium | North America | GB00BWBSHX88 | BWBSHX8 |
| AXA Framlington American Growth | 5 | Medium | North America | GB00B5LXGG05 | B5LXGG0 |
| Baring Eastern Trust | 5 | High | Asia Pacific Excluding Japan Ret | GB0000799923 | 79992 |
| Fidelity China Consumer | 7 | High | China/Greater China | GB00B82ZSC67 | B82ZSC6 |
| FP Pictet Multi Asset Portfolio | 5 | Low | Targeted Absolute Return | GB00BVYTTC41 | BVYTTC4 |
| Jupiter Japan Income | 5 | High | Japan | GB00B0HZTZ55 | B0HZTZ5 |
| Man GLG UK Income | 3 | Medium | UK Equity Income | GB00B0117B11 | B0117B1 |
| Neptune Global Equity | 5 | Medium | Global | GB00B8DLY478 | B8DLY47 |
| Premier Diversified | 19 | Low | Mixed Investment 40-85% Shares | GB00B8BJV423 | B8BJV42 |
| Standard Life Investments UK Real Estate | 5 | Low | Property | GB00BYPHP536 | BYPHP53 |
| TM Cavendish AIM | 11 | High | UK Smaller Companies | GB00B0JX3Z52 | B0JX3Z5 |
| TwentyFour Dynamic Bond | 16 | Low | Sterling Strategic Bond | GB00B5KPRZ34 | B5KPRZ3 |
My new asset mix
This means my new asset mix is (previous asset mix is in brackets):
- UK Equities 19% (18%)
- North American Equities 24% (17%)
- Global Fixed Interest 11% (13%)
- Japanese Equities 7% (6%)
- Other International Equities 0% (3%)
- Asian equities 4% (4%)
- European Equities 0% (0%)
- UK Fixed Interest 5% (5%)
- Cash 4% (21%)
- Alternative Investment Strategies 14% (7%)
- Emerging Asia equities 6% (6%)
- Emerging Market Fixed Interest 0% (0%)
- Property 6% (0%)

£200 Pension Cashback Offer
Make a qualifying deposit or transfer a pension to our partner Interactive Investor.
- Deposit or transfer a pension of at least £20k and you could earn £200 cashback
- Terms and Fees apply, Capital at risk
- New & Existing customers opening a SIPP
- Offer ends 31st July 2026
Before starting your transfer, check you won't lose any valuable benefits (such as guaranteed annuity rates or a lower protected pension age) and find out what exit fees you might have to pay
