

The background to my portfolio
Back in March 2015 I decided to invest £50,000 of my own money using 80-20 Investor. The purpose was twofold, firstly to show how you can use 80-20 Investor to invest and outperform the market with only a few minutes effort every now and then. Secondly, no other investment commentator, journalist or research provider invests their own money for fear of failing. This is a sorry state of affairs and is precisely why I committed to openly running my own portfolio for 80-20 Investor members to see.
Since then I have periodically changed my portfolio using the fund suggestions provided by the 80-20 Investor algorithm and associated research. I always disclose the changes at the time they are made.
Performance update
As is usual in my portfolio reviews, the chart below shows how my portfolio has outperformed since I started the challenge in March 2015, four years ago. The green line is the performance of my portfolio while the red line is the benchmark showing the average return achieved by professional fund managers given the same asset mix. To accurately calculate this I have used the average return for each sector in which my portfolio invested. The blue line shows what the average multi-asset fund with comparable equity content achieved. In other words, the red line would show the extra performance added by just the asset mix of my portfolio (where I was invested i.e European equities etc) over picking a typical multi-asset fund (the blue line). While the green line (which is my actual performance) shows the impact of being in the right funds at the right time, as identified by the 80-20 Investor algorithm.
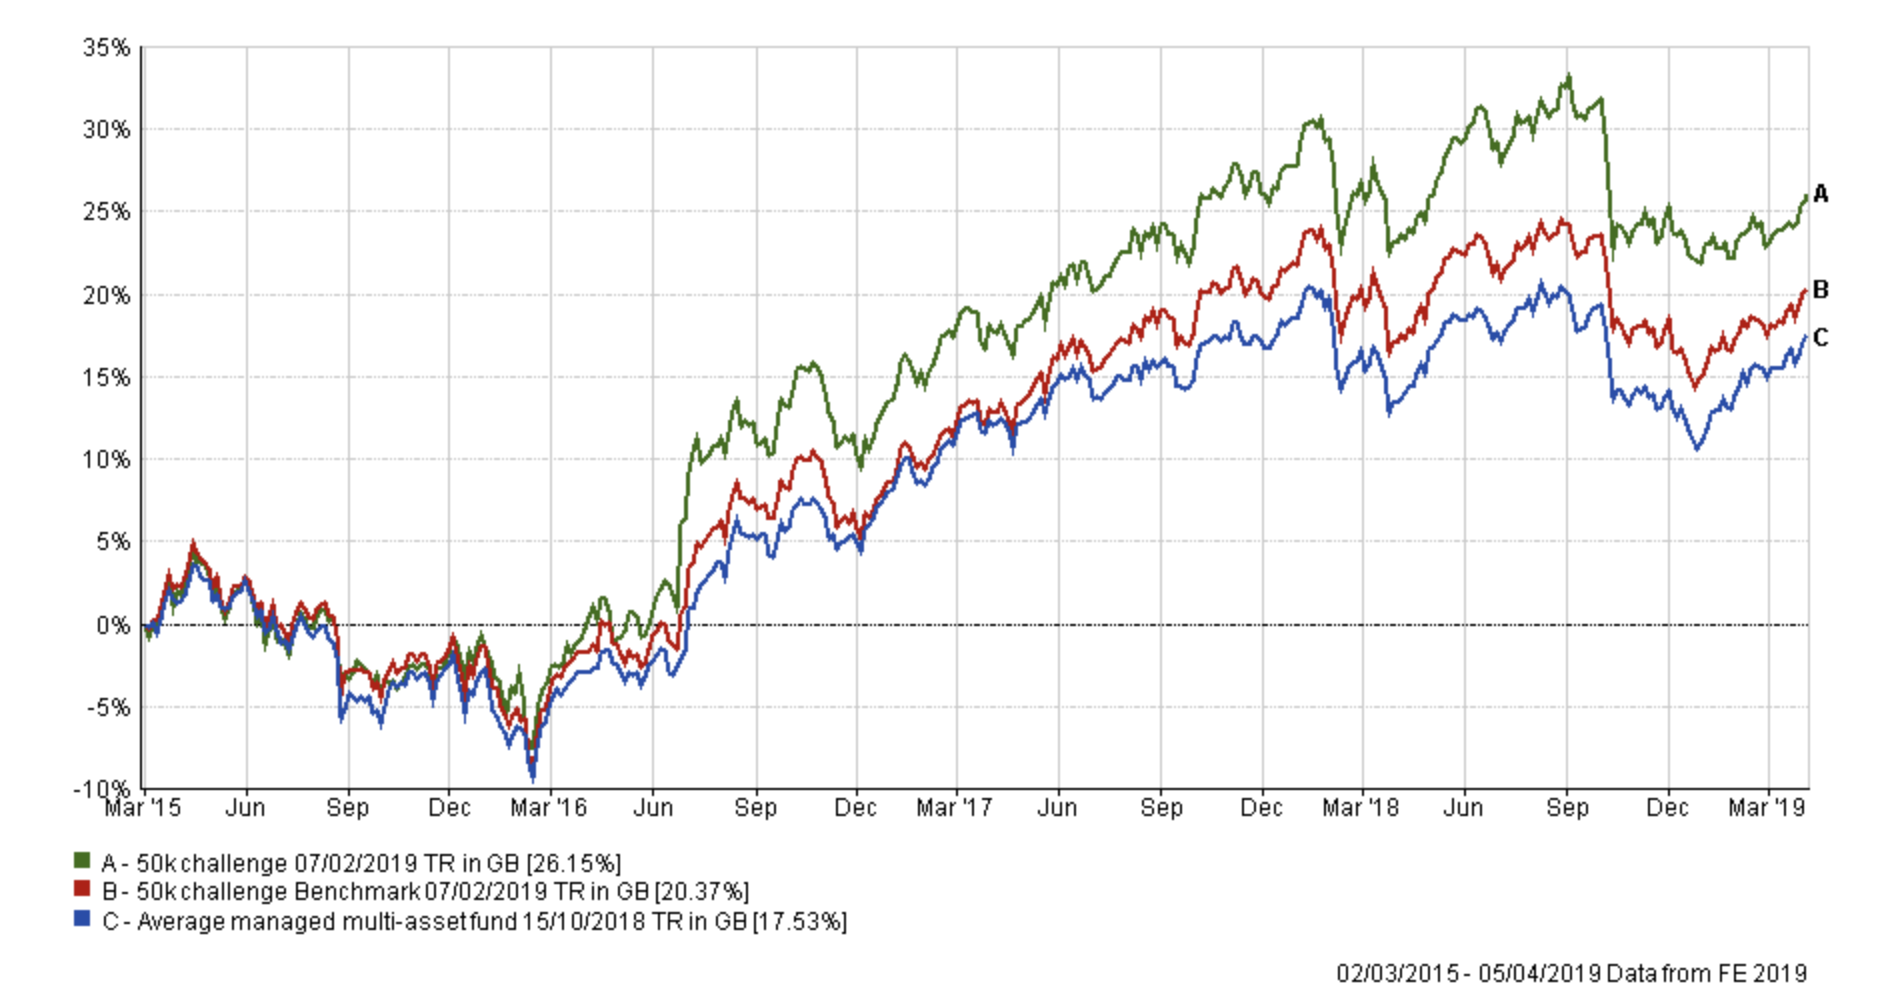
As it's only around three weeks since I last reviewed my portfolio you can see that the size of my portfolio's lead over its benchmarks remains largely the same, which is pleasing.
I still only have around 40% equity exposure as I continue to stick with the process that has served me well over the past four years. For now that means managing risk, hence why my portfolio remains more cautiously positioned than it has been historically.
The performance of each fund within my portfolio, since I reviewed my portfolio in March, is shown in the chart below. The chart is a little messy but below it there is a list of each fund's performance for the period, from best performer to worst performer.
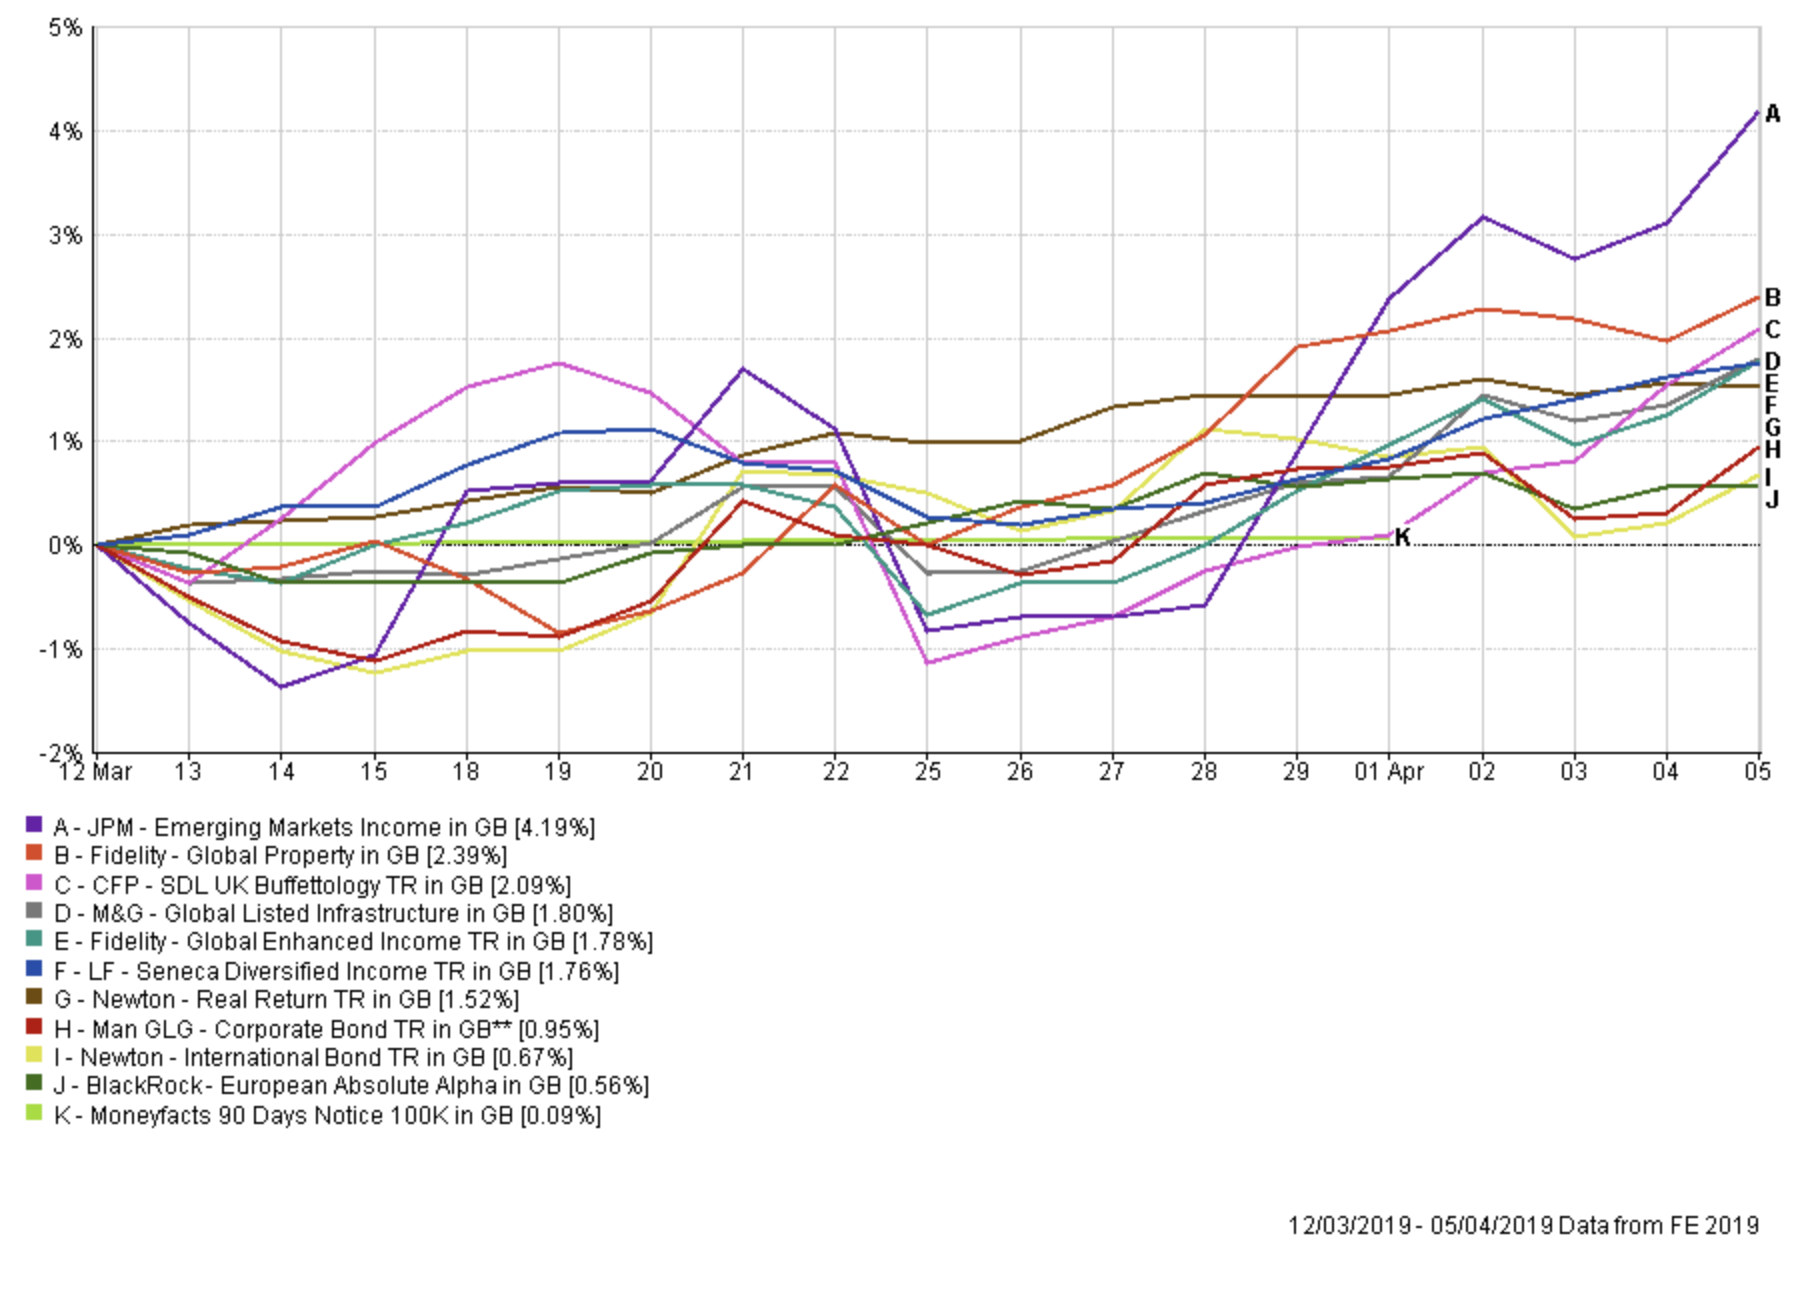
After a lacklustre start to March, JPM Emerging Markets Income performed strongly. Once again both Fidelity Global Enhanced Income and Fidelity Global Property had strong months. Meanwhile, although Newton international Bond and Man GLG Corporate Bond had positive months their returns were hampered by the extreme Brexit related currency moves.
The chart below shows the volatility in the value of the pound since February. The two aforementioned bond funds are impacted the most by the GBP/dollar exchange rate, perhaps more than any other funds in my portfolio. 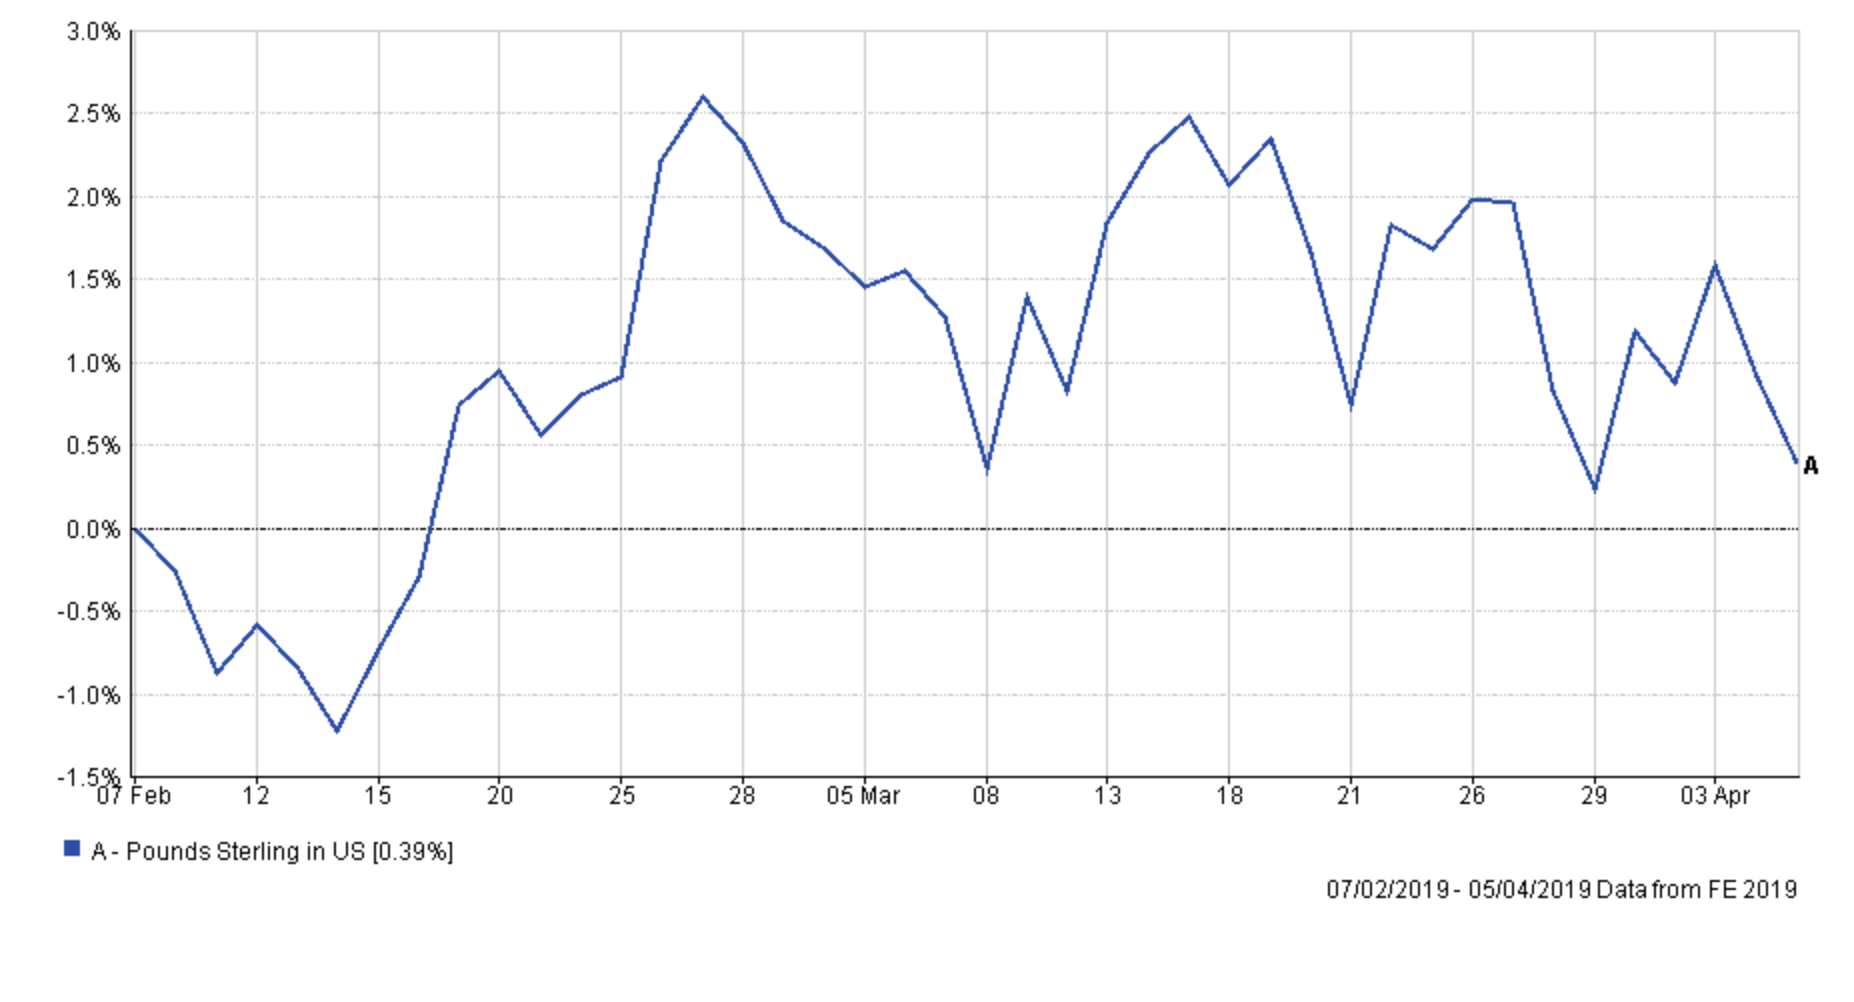
This volatility is troubling when trying to plan changes for any portfolio as the market could quickly move for or against you while a fund switch transaction is being completed. Last month I wrote the following:
As a UK investor right now this is having a huge impact on your portfolio. It means that on a given day no matter what investment or bond markets have done, the performance of your portfolio will look very different once currency moves are factored in. It also means that markets (in particular) currency markets can move against you rapidly. In the past few days we've seen the pound move up or down by as much as 2% in a given day. The trouble is that with so much uncertainty over market direction (and also currency market direction) making portfolio changes is fraught with risk.
That is why I delayed April's portfolio review until we had a bit more clarity over the April 14th Brexit deadline, in the hope that it would reduce the level of volatility we are experiencing in the value of the pound. The wait was prudent because after Wednesday's decision by the EU to offer a six month Brexit extension, the volatility in the value of the pound has settled giving a window of opportunity to make any fund changes. Furthermore, Wednesday also saw the release of the US Federal Reserve's minutes from their March meeting. This event also had the potential to move investment markets if the minutes had contained news that the market didn't want to hear. As it turned out the minutes were palatable and there was no notable reaction in equity markets. So now is an opportune time for me to make a few tweaks to my portfolio.
The table below shows my portfolio's current allocation, with those funds in green still in the BOTB while those in yellow are not in the BOTB but remain in the BFBS list. Meanwhile, any funds in red have dropped out of both shortlists.
| Fund | Allocation % | Risk | Sector | ISIN Code |
| BlackRock European Absolute Alpha | 8 | Low | Targeted Absolute Return | GB00B4Y62W78 |
| CFP SDL UK Buffettology General | 6 | Medium | UK All Companies | GB00B3QQFJ66 |
| Fidelity Global Enhanced Income | 5 | Medium | Global Equity Income | GB00BD1NLJ41 |
| Fidelity Global Property | 12 | High | Property Other | GB00B7K2NZ09 |
| JPM Emerging Markets Income | 11 | High | Global Emerging Markets | GB00B56DF680 |
| LF Seneca Diversified Income | 10 | Low | Mixed Investment 20-60% Shares R | GB00B7JTF560 |
| M&G Global Listed Infrastructure | 6 | Medium | Global | GB00BF00R928 |
| Man GLG Corporate Bond | 10 | Low | Global Bonds | GB00B0118B85 |
| Newton International Bond | 15 | Low | Global Bonds | GB0006779655 |
| Newton Real Return | 7 | Low | Targeted Absolute Return | GB0001642635 |
| Cash | 10 | Low | N/A | N/A |
Of the 10 funds I hold only four are coloured red. These include the two bond funds, which have been buffeted by the moves in sterling, but also CFP SDL UK Buffettology General and JPM Emerging Markets Income.
JPM Emerging Markets Income was in the BOTB and has performed strongly despite dropping out of the BOTB and BFBS tables, making an incredible 5.88% in the last month. So right now I see no reason to remove it from my portfolio yet.
The CFP SDL UK Buffettology General's recent performance has disappointed. The chart below shows the performance of the fund versus its sector average since I first invested in it back in August 2018.
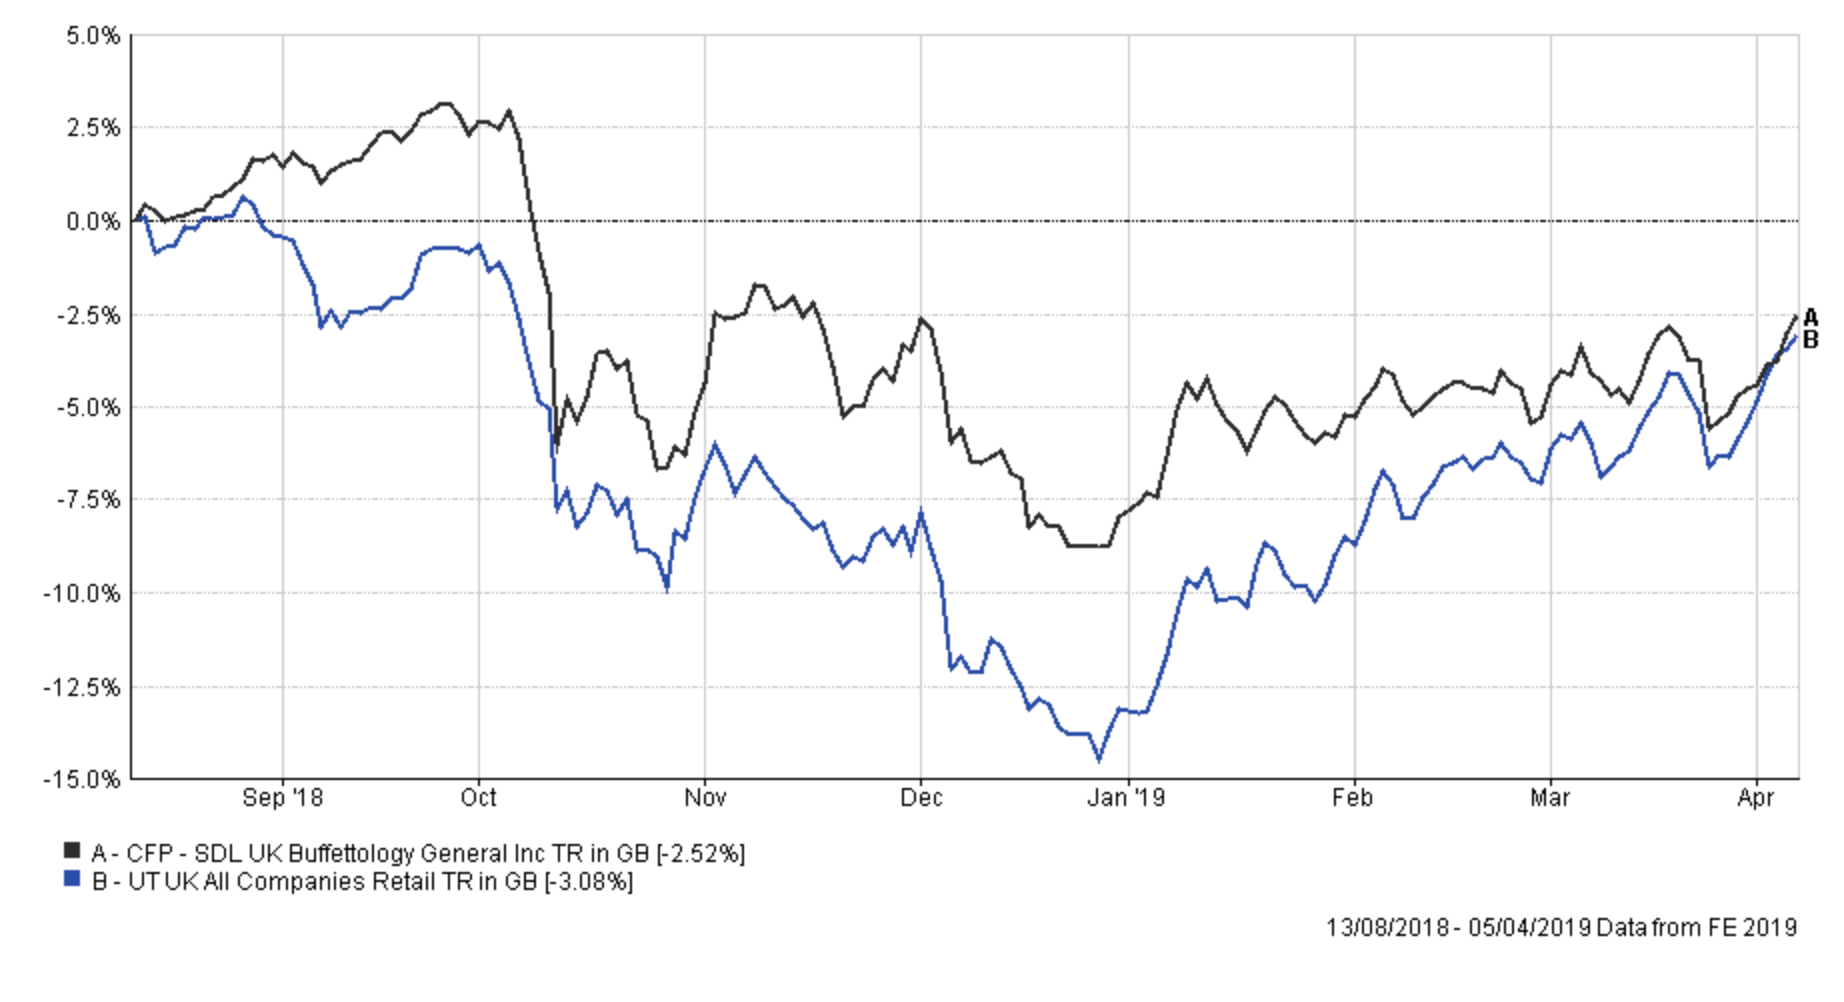
Obviously, I am pleased with how it performed (on a relative basis) since I've held it, and in particular during the last quarter of 2018, managing to preserve capital much better than its peer group during the stock market sell-off. However, in recent months its performance has been lacklustre as investors have favoured growth stocks over value stocks, the latter of which the Buffettology fund favours. The fund is also underweight in oil stocks which means that it hasn't benefited from the strong rally in the price of oil this year. Given that the fund has been out of the BOTB and BFBS lists for some time I have decided to replace it within my portfolio while being mindful to replace it with a fund that also preserved capital better than its peers during the recent stock market sell-off. After all, as unlikely as it might seem right now, a pullback in stock markets is possible.
I also plan to tweak my bond exposure this month, which is currently via the Newton International Bond and Man GLG Corporate Bond. Currency market volatility is hampering returns from these funds which has resulted in them slipping out of the 80-20 Investor fund shortlists.
I am also looking to reduce my cash position given that the BOTB finally has 30 funds once again, a sign that there is an increasing number of investment opportunities beyond cash.
Fund switches
If you compare the asset mix of my current portfolio to that of the current BOTB the biggest differences are within the low-risk portion of my portfolio. I have a higher cash position (13% versus 5% in the BOTB), a higher global bond exposure (25& versus 12%), a lower emerging market bond exposure (0% versus 16%) a lower UK gilt/bond exposure (16% versus 0%).
So I plan to make fund switches to bring my portfolio more in line with that of the BOTB.
- Switch 100% out of Newton International Bond and 50% into HSBC UK Gilt index and 50% into the Aberdeen Emerging Markets Bond.
- Switch 100% out of the CFP SDL UK Buffettology General and 100% into M&G Global Listed Infrastructure
- Switch 100% out of Man GLG Corporate Bond and 100% into Janus Henderson Fixed Interest Monthly Income
- Switch 33.3% out of my cash position into BMO Pacific Equity Fund
I have opted for the HSBC UK Gilt index fund as it increases my UK gilt exposure while the Aberdeen Emerging Market Bond fund introduces an EM bond element. Both funds have performed well of late with the latter being a regular in the BOTB. I chose the HSBC fund over the other gilt and index-linked gilt funds in the BOTB because it had one of the lowest max weekly fall figures (so hopefully will prove less volatile during a bond market sell-off) as well as being among the cheapest.
Previously my bond exposure benefited from the pound weakening against the dollar. This was deliberate, in order to balance my portfolio's exposure to the fortunes of the pound when I first introduced the Newton fund back in November. Since then the non-bond part of my portfolio has changed somewhat (especially the equity portion) and so my portfolio had a slight bias towards favouring an environment with a weakening pound versus the dollar.
Conversely, gilts tend to do better in an environment when the pound strengthens against the dollar. Similarly, emerging market bonds tend to do better in the same environment as emerging market assets generally perform better when the dollar weakens. The US Federal Reserve's dovish u-turn this year has therefore been a boost for EM assets.
The upshot is that by altering my bond exposure it maintains the risk profile of my portfolio while having the added benefit of rebalancing my exposure to the pound's fortunes (i.e having a more neutral stance).
By switching 100% out of the CFP SDL UK Buffettology General and into M&G Global Listed Infrastructure I am not only reducing my UK equity exposure, to be more in line with the BOTB, but also backing a winner. The M&G fund is up 4.72% since I first invested in it on 7th February 2019. If you recall, in April's monthly newsletter I highlighted the sectors that tend to outperform in the current economic backdrop. They included Utilities and Energy which coincidentally are the two main sectors that the M&G fund invests in, which helps explain its outperformance.
In choosing the Janus Henderson Fixed Interest Monthly Income fund to replace the Man GLG Corporate Bond I was looking for a fund that had shown some consistency. Janus Henderson Fixed Interest Monthly Income was the only low-risk bond fund to retain its place in the BOTB, a feat it has achieved each month since February.
Finally I've reduced my cash position, to reflect the increase in investment opportunities, with a view to reducing it even further after the next BOTB update. The BOTB now has exposure to Asian equities which have had a great start to 2019. Of the three Asian funds within the BOTB I chose the BMO Pacific Equity Fund because of its lower max weekly fall figure but also because Blackrock Asia has a bid/offer spread (which I always try to avoid) and the Newton Asian Income fund has already dropped out of the BFBS tables. The BMO fund is a high risk fund which is why I've kept my position size small for now, so as not to alter the overall risk profile of my portfolio too much. Finally, the BMO fund has its largest exposure in Indian equities which helps diversify my portfolio, given that JPM Emerging Markets Income's largest geographical positioning is in Chinese equities.
My portfolio
My portfolio now looks like this:
| Fund | Allocation % | Risk | Sector | ISIN Code |
| BlackRock European Absolute Alpha | 8 | Low | Targeted Absolute Return | GB00B4Y62W78 |
| BMO Pacific Equity | 3 | High | Asia Pacific Excluding Japan | GB0033143115 |
| Fidelity Global Enhanced Income | 5 | Medium | Global Equity Income | GB00BD1NLJ41 |
| Fidelity Global Property | 11 | High | Property Other | GB00B7K2NZ09 |
| JPM Emerging Markets Income | 12 | High | Global Emerging Markets | GB00B56DF680 |
| LF Seneca Diversified Income | 10 | Low | Mixed Investment 20-60% Shares R | GB00B7JTF560 |
| M&G Global Listed Infrastructure | 13 | Medium | Global | GB00BF00R928 |
| HSBC UK Gilt Index | 7 | Low | UK Gilts | GB00B4581C50 |
| Janus Henderson Fixed Interest Monthly Income | 10 | Low | Sterling Strategic Bond | GB0001920486 |
| Newton Real Return | 7 | Low | Targeted Absolute Return | GB0001642635 |
| Aberdeen Emerging Markets Bond | 7 | Medium | Global Emerging Markets Bond | GB00B5L9HN22 |
| Cash | 7 | Low | N/A | N/A |
My asset mix
This means my asset mix is as follows (previous asset mix is in brackets):
-
- UK Equities 5% (9%)
- North American Equities 9% (6%)
- Global Fixed Interest 11% (25%)
- Japanese Equities 0% (0%)
- Other International Equities 0% (2%)
- Emerging market equities 11% (11%)
- European Equities 4% (3%)
- UK Fixed Interest 0% (0%)
- Cash 10% (13%)
- Alternative Investment Strategies 22% (20%) (including absolute return)
- Emerging Market Fixed Interest 7% (0%)
- Gilts 7% (0%)
- Asian equities 3% (0%)
- Property 11% (11%) - most of which is equities in the US.
If you are looking for the notional high and low-risk versions of my £50k portfolio which are often published with these updates then see the question and answer (regarding their omission) in October's Chatterbox. Having said that, I will look to publish them again shortly.

£200 Pension Cashback Offer
Make a qualifying deposit or transfer a pension to our partner Interactive Investor.
- Deposit or transfer a pension of at least £20k and you could earn £200 cashback
- Terms and Fees apply, Capital at risk
- New & Existing customers opening a SIPP
- Offer ends 31st July 2026
Before starting your transfer, check you won't lose any valuable benefits (such as guaranteed annuity rates or a lower protected pension age) and find out what exit fees you might have to pay
