

The background to my portfolio
Back in March 2015 I decided to invest £50,000 of my own money using 80-20 Investor. The purpose was twofold, firstly to show how you can use 80-20 Investor to invest and outperform the market with only a few minutes effort every now and then. Secondly, no other investment commentator, journalist or research provider invests their own money for fear of failing. This is a sorry state of affairs and is precisely why I committed to openly running my own portfolio for 80-20 Investor members to see.
Since then I have periodically changed my portfolio using the fund suggestions provided by the 80-20 Investor algorithm and associated research. I always disclose the changes at the time they are made.
Performance update
As is usual in my portfolio reviews, the chart below shows how my portfolio has outperformed since I started the challenge in March 2015, three years ago. The green line is the performance of my portfolio while the red line is the benchmark showing the average return achieved by professional fund managers given the same asset mix. To accurately calculate this I have used the average return for each sector in which my portfolio invested. The blue line shows what the average multi-asset fund with comparable equity content achieved. In other words, the red line would show the extra performance added by just the asset mix of my portfolio (where I was invested i.e European equities etc) over picking a typical multi-asset fund (the blue line). While the green line (which is my actual performance) shows the impact of being in the right funds at the right time, as identified by the 80-20 Investor algorithm.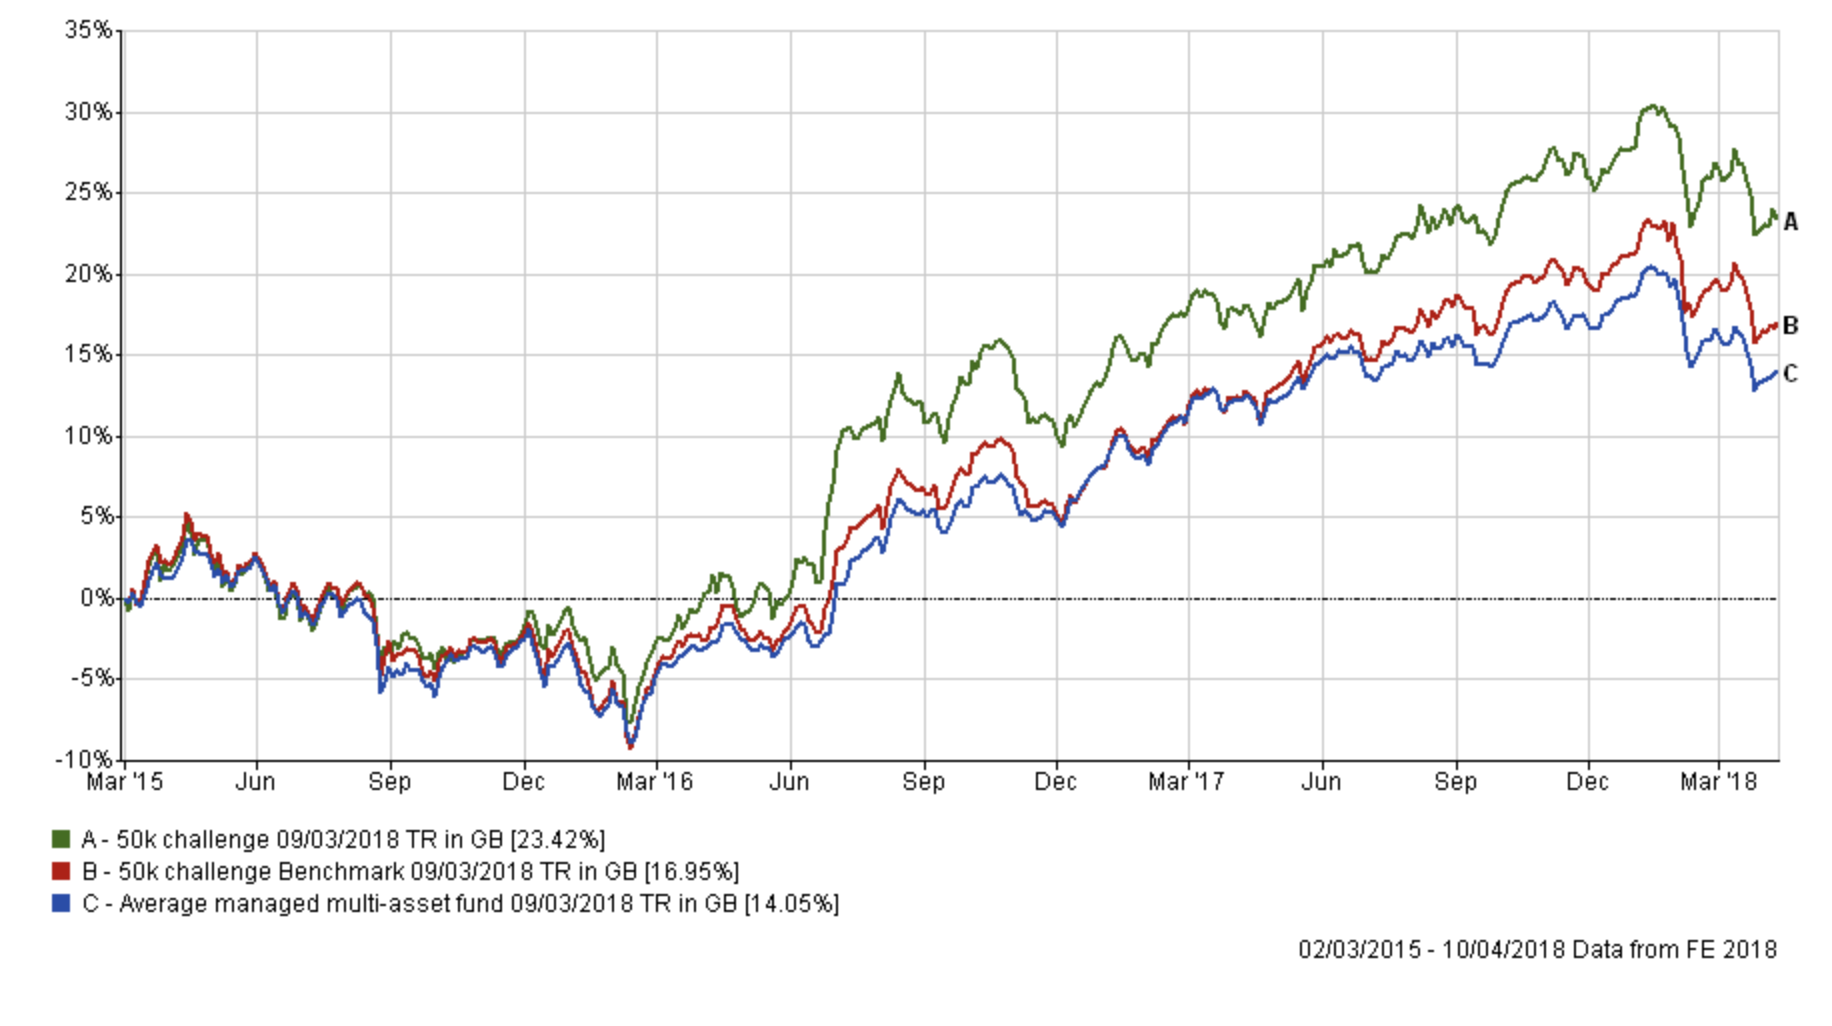
While my portfolio extended its lead over its benchmarks during February's sell-off it gave some of that back in March's equity market wobble. However, my portfolio is still comfortably beating its benchmarks.
The table below shows my current portfolio, with those funds in green still in the BOTB while those in yellow are not in the BOTB but remain in the BFBS list. Meanwhile, any funds in red have dropped out of both shortlists.
| Name | Allocation % (rounded) | Risk | Sector | ISIN Code | SEDOL Code |
| 7IM US Equity Value | 14 | High | North America | GB00BWBSHX88 | BWBSHX8 |
| AXA Framlington American Growth | 5 | High | North America | GB00B5LXGG05 | B5LXGG0 |
| Baring Eastern Trust | 5 | High | Asia Pacific Excluding Japan Ret | GB0000799923 | 79992 |
| Fidelity China Consumer | 7 | High | China/Greater China | GB00B82ZSC67 | B82ZSC6 |
| FP Pictet Multi Asset Portfolio | 5 | Low | Targeted Absolute Return | GB00BVYTTC41 | BVYTTC4 |
| Jupiter Japan Income | 5 | High | Japan | GB00B0HZTZ55 | B0HZTZ5 |
| Man GLG UK Income | 3 | Medium | UK Equity Income | GB00B0117B11 | B0117B1 |
| Neptune Global Equity | 5 | Medium | Global | GB00B8DLY478 | B8DLY47 |
| Premier Diversified | 19 | Medium | Mixed Investment 40-85% Shares | GB00B8BJV423 | B8BJV42 |
| Standard Life Investments UK Real Estate | 5 | Low | Property | GB00BYPHP536 | BYPHP53 |
| TM Cavendish AIM | 11 | High | UK Smaller Companies | GB00B0JX3Z52 | B0JX3Z5 |
| TwentyFour Dynamic Bond | 16 | Low | Sterling Strategic Bond | GB00B5KPRZ34 | B5KPRZ3 |
Looking back at my commentary last month I wrote about my decision to put my cash holding back to work:
'Of course, markets could turn lower tomorrow, next week or next month but we have no crystal ball to know for sure. Therefore as per my original plan, I am reinvesting the money I currently hold in cash, while reviewing my existing funds.'
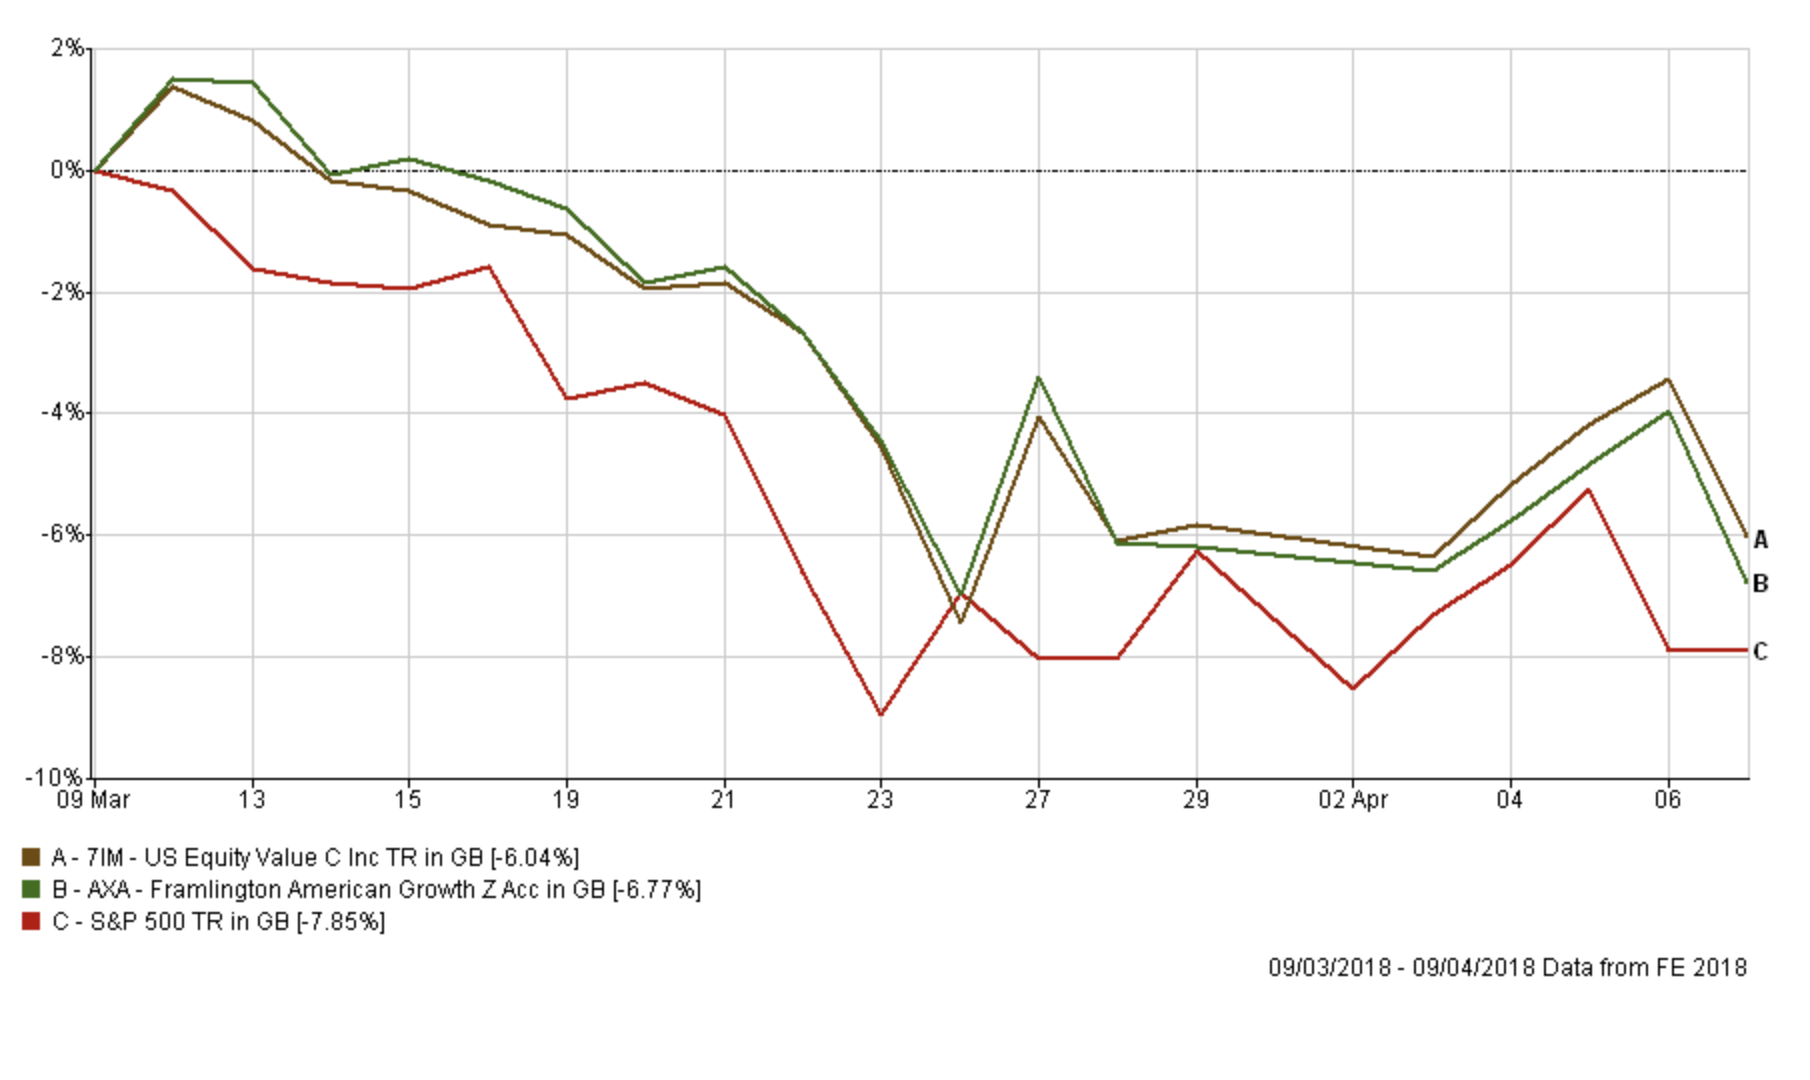
It was the commentator's curse as days later equity markets took a tumble back into correction territory as a result of renewed trade war fears and the technology stock sell-off sparked by the Facebook data sharing saga. It was also unfortunate timing that the epicentre of the unforeseeable sell-off was US equities and technology stocks in particular. It didn't matter which US equity exposure fund I'd have bought, or which sectors they'd focused on, as the chart below shows that my choice would have followed the US market indices downwards. It was a market specific event rather than a fund specific one. Interesting to see that my two funds did still manage to outperform the wider US equity index but that's a minor consolation really.
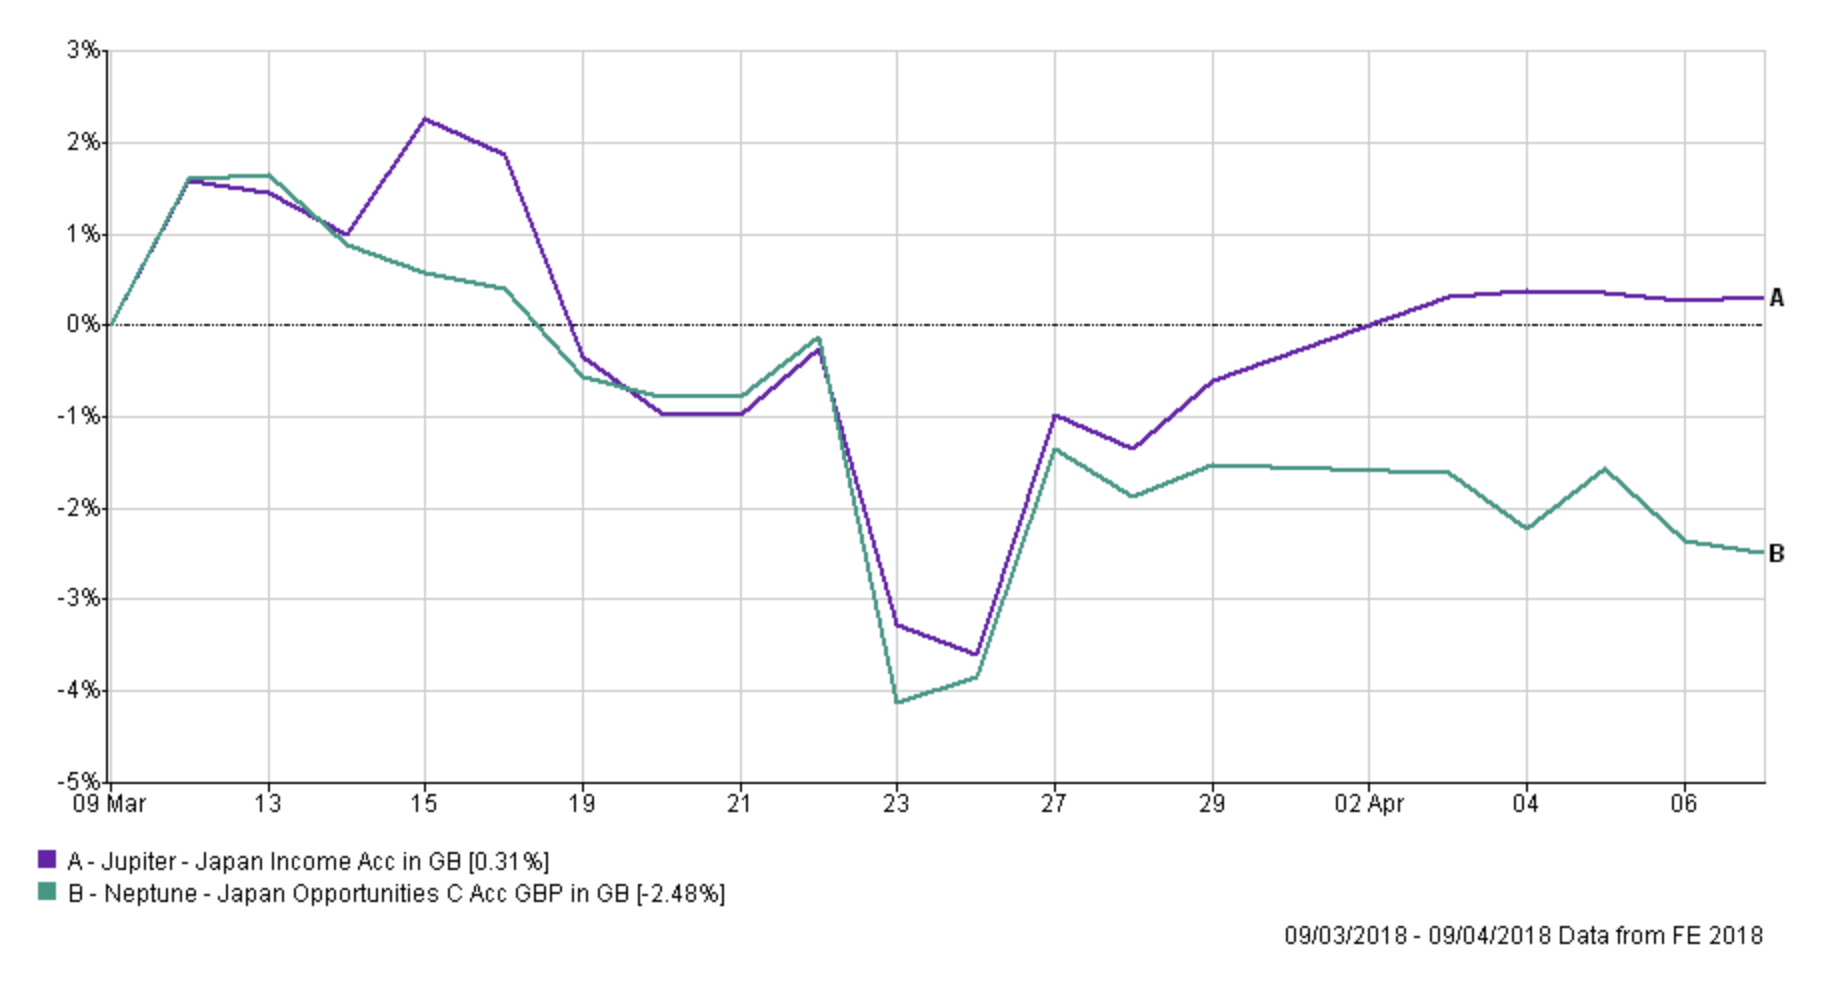
Of course while not every fund switch can go your way sometimes they do. The chart below shows how the Jupiter Japan Income fund performed after I bought it last month versus its predecessor in my portfolio
Similarly the Standard Life UK Real Estate Fund did its job by diversifying my portfolio, outperforming bonds and cash, in a month when equity markets tumbled 5% before rebounding.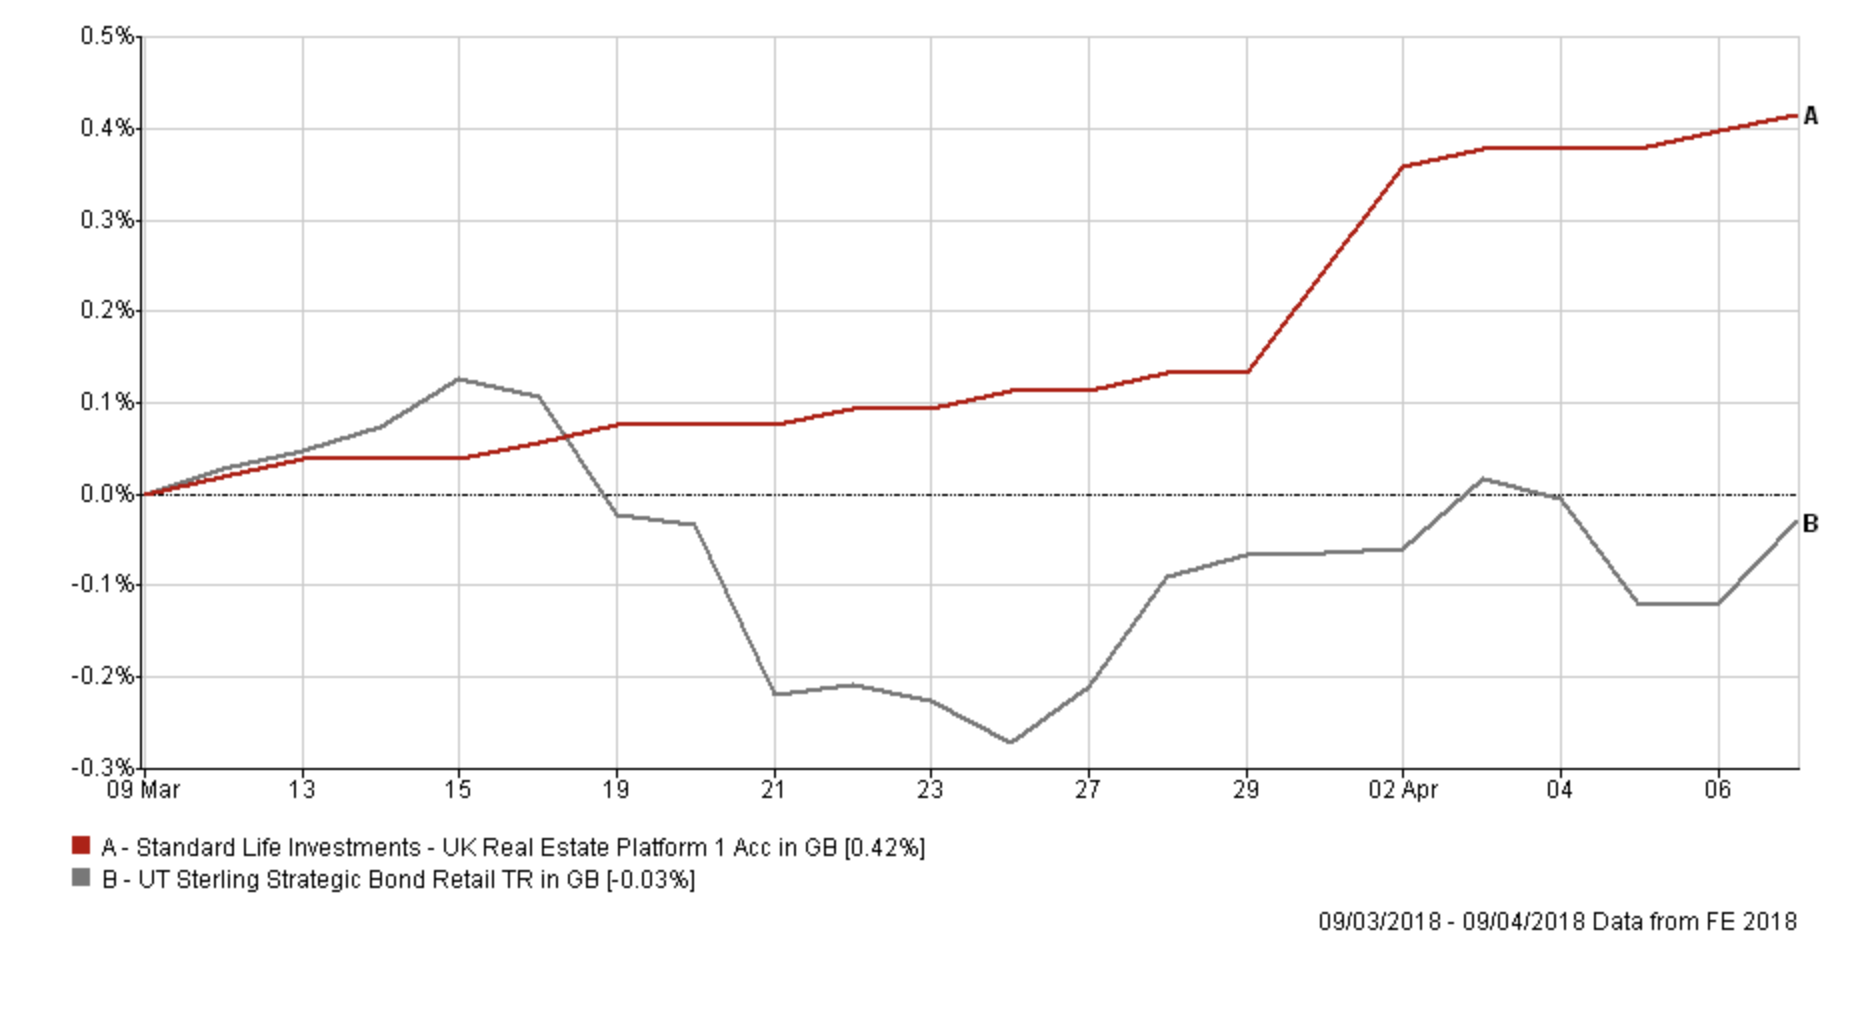
In last week's newsletter I discussed the heightened level of volatility in markets which even led to Vanguard's Jack Bogle to claim he'd not seen anything like it in his 66-year career. The real takeaway from an investor's viewpoint is that right now equity markets could move for you or against you while you make changes to your portfolio. Given that most unit trust fund switches take at least 1 trading day to complete you run the risk of the market bouncing while you are sitting on the sidelines. As such, I made the decision to minimise any changes to my portfolio right now, preferring to wait until volatility subsides a bit before any major alterations. Ultimately that means I could review my portfolio again in the next few weeks should things settle down.
With that in mind, taking a look at the colour coded table above which contains my portfolio there are a number of funds that are coloured red which means that they have been dropped out of both the BOTB and the BFBS tables. However, when a fund falls out of the 80-20 Investor fund lists it doesn't suddenly become a bad fund, don't forget the research behind 80-20 Investor allows for funds to be held for 6 months. A recent testament to that has been Premier Diversified which although it dropped out of the BOTB & BFBS lists in February regained its place in March, partly as a result of its performance during the recent market dip.
Equity markets have stabilised in the last week and there are tentative signs for optimism, for example the long-term uptrend in stocks remains intact. However, downside risks remain. Indeed this month's BOTB slightly reduced its equity exposure to 50% in favour of bonds. Nothing drastic, but it gives up some of the potential upside if markets rally. Indeed, most of the equity reduction was confined to the US which has experienced the greatest level of volatility. So I have looked to reflect that slight easing off from the accelerator in my portfolio changes (which I discuss later) while remaining committed to equities.
As an interesting exercise, and one that is useful to do in the current climate, I focused on how certain funds (highlighted in red) have performed during the recent downturn. The chart below shows how Fidelity China Consumer has fared against two of its peers (which are currently in the BOTB) and the sector benchmark. While the 80-20 Investor algorithm doesn't judge momentum over such a short time frame on the downside it's pleasing to see that the Fidelity fund has performed slightly better than its peers.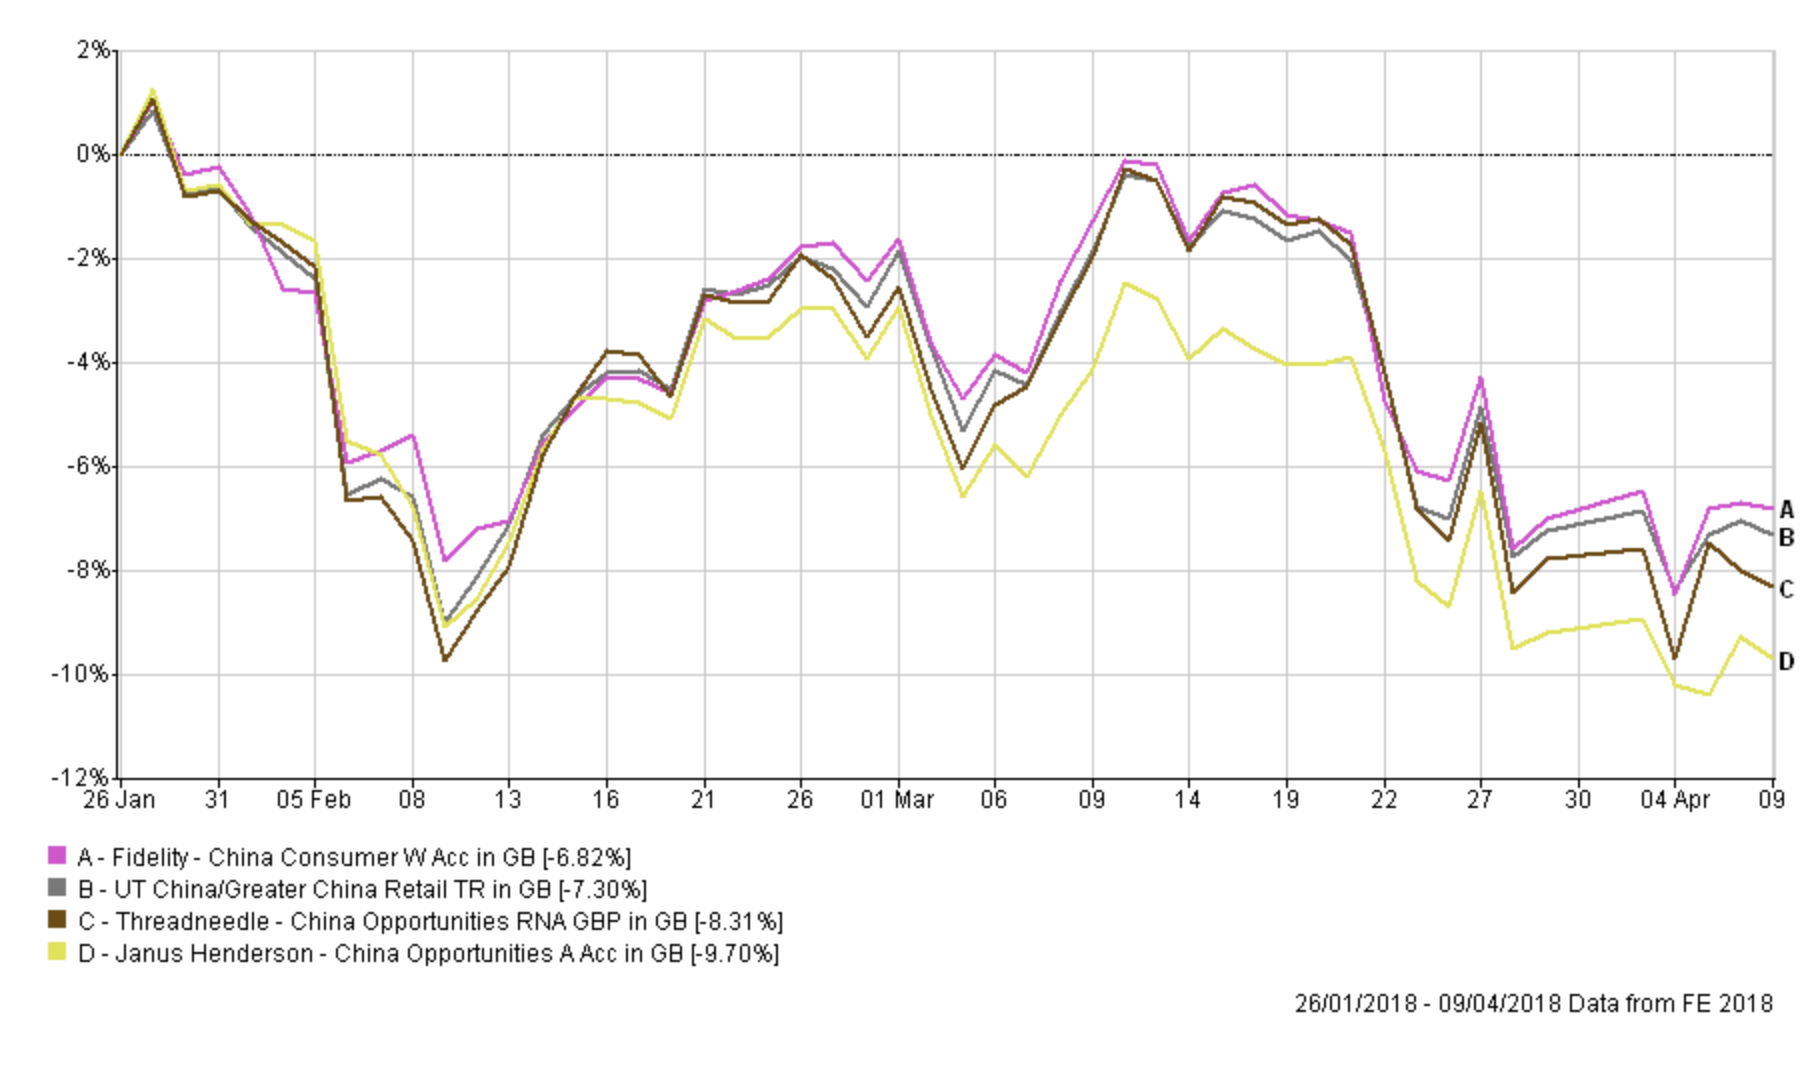
Similarly, if we look at how the Cavendish AIM fund has performed since the recent downturn in markets it has rebounded strongly. So from a very short-term viewpoint the fund has momentum but the 80-20 Investor algorithm rightly doesn't prioritise the immediate past. Other funds such as Jupiter Smaller Companies have shown a far better level of consistency, momentum and risk management over more than just the last 8 weeks shown below.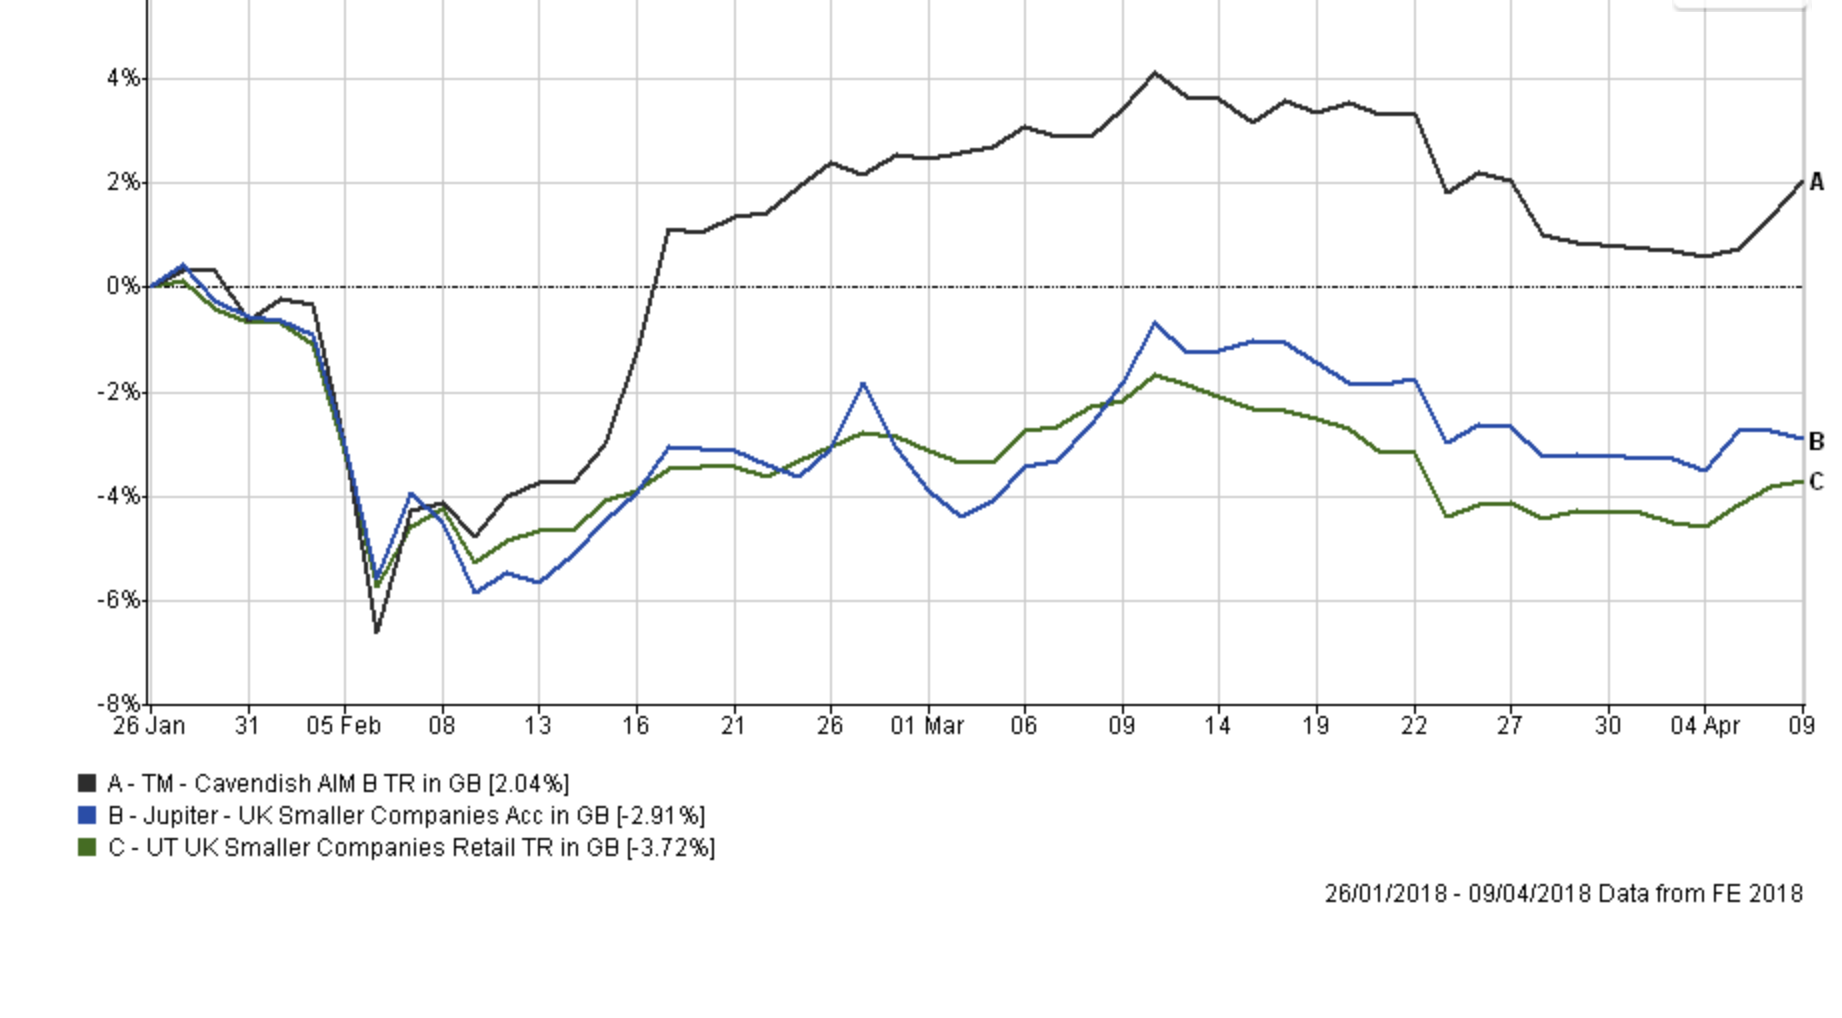
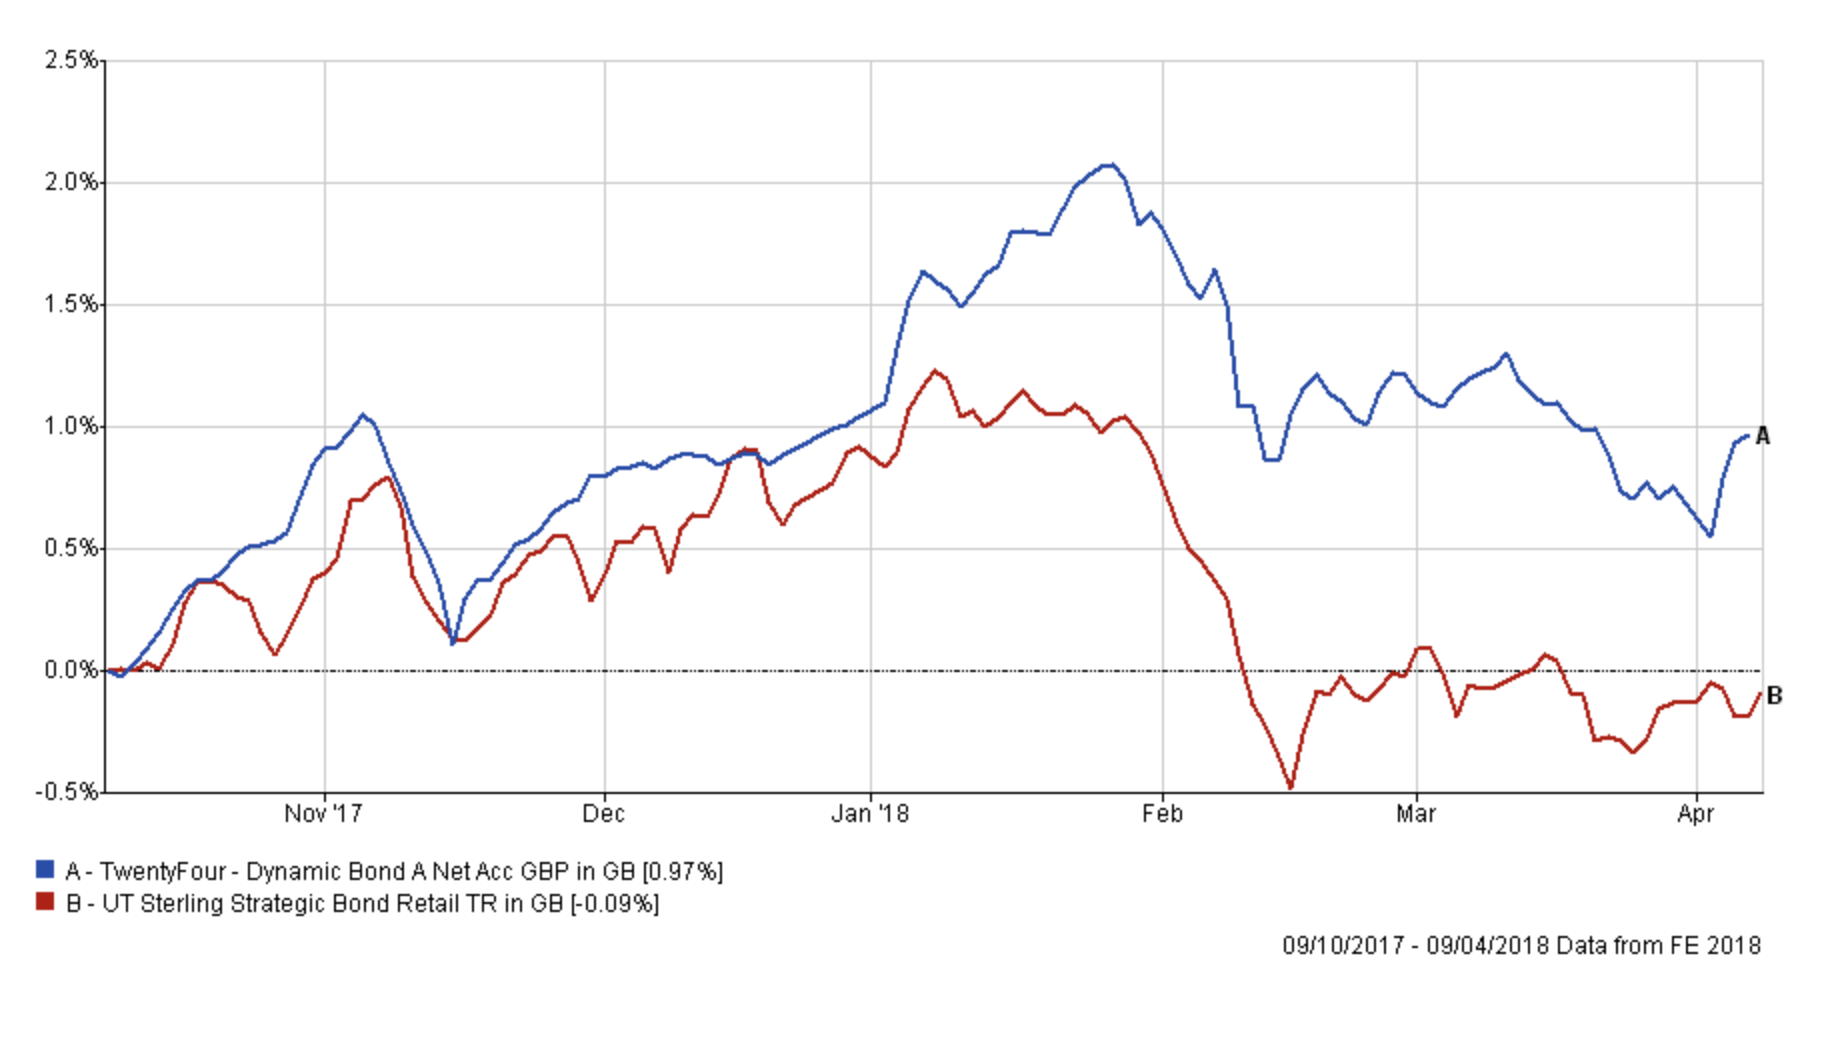
Similarly, the Standard Life UK Real Estate fund has performed well since I've held it in my portfolio (as shown in the earlier chart) and only marginally lagged the L&G Property fund which is in this month's BOTB. Lastly, the TwentyFour Dynamic Bond has been in my portfolio for quite a long time now. It may seem boring and unexciting but the chart below shows how it has held up pretty well during recent market sell-offs, especially in February when bond funds performed badly on the whole.
Of course, I always stress how you shouldn't focus on such short-term movements when looking at funds. However, it has its uses when you are trying to gauge how a fund may perhaps perform should a market correction escalate into something far worse. For that reason, I am comfortable with holding on to the funds highlighted above for now which were all marked red in the earlier table.
If we look at my portfolio overall the risk profile has changed as a result of the current market backdrop. The US equity funds I hold are now high risk and the Premier Diversified fund has moved from Low to Medium risk. While this trend may reverse if the current level of market volatility falls there is no sign of that just yet. Reducing my US exposure in favour of lower risk assets enables me to readdress the balance and bring the overall level of risk within my portfolio down.
For that reason I am carrying out the switches listed below:
Fund switches
- 100% out of the Neptune Global Equity fund and 40% into TwentyFour Dynamic Bond, 40% into FP Pictet Multi Asset Portfolio and 20% into Standard Life Investments UK Real Estate. Quite simply I am splitting the proceeds between my remaining low risk holdings while keeping my property exposure close enough to that of the BOTB
- 50% out of the 7IM US Equity Value and 100% into cash
In carrying out the above switches I:
- bring my portfolio's cash position in line with that of the BOTB
- reduce my US equity exposure (via the reduction of my 7IM holding and the sale of the Neptune fund)
- increase my bond exposure
- bring the number of funds within my portfolio back down to 11
Overall I am only switching about 12% of my portfolio, nothing too drastic, and my new portfolio will look as follows with an equity exposure of around 51%. As such the potential drag to the upside if markets rally will be minimal yet the changes help me keep some powder dry until hopefully a clearer market trend unfolds (up or down).
| Name | Allocation % (rounded) | Risk | Sector | ISIN Code | SEDOL Code |
| 7IM US Equity Value | 6.5 | High | North America | GB00BWBSHX88 | BWBSHX8 |
| AXA Framlington American Growth | 4.5 | High | North America | GB00B5LXGG05 | B5LXGG0 |
| Baring Eastern Trust | 5 | High | Asia Pacific Excluding Japan Ret | GB0000799923 | 79992 |
| Fidelity China Consumer | 7 | High | China/Greater China | GB00B82ZSC67 | B82ZSC6 |
| FP Pictet Multi Asset Portfolio | 7 | Low | Targeted Absolute Return | GB00BVYTTC41 | BVYTTC4 |
| Jupiter Japan Income | 5 | High | Japan | GB00B0HZTZ55 | B0HZTZ5 |
| Man GLG UK Income | 3.5 | Medium | UK Equity Income | GB00B0117B11 | B0117B1 |
| Cash | 6.5 | Low | |||
| Premier Diversified | 19 | Medium | Mixed Investment 40-85% Shares | GB00B8BJV423 | B8BJV42 |
| Standard Life Investments UK Real Estate | 6 | Low | Property | GB00BYPHP536 | BYPHP53 |
| TM Cavendish AIM | 11 | High | UK Smaller Companies | GB00B0JX3Z52 | B0JX3Z5 |
| TwentyFour Dynamic Bond | 19 | Low | Sterling Strategic Bond | GB00B5KPRZ34 | B5KPRZ3 |
My new asset mix
This means my new asset mix is (previous asset mix is in brackets):
-
- UK Equities 18% (19%)
- North American Equities 14% (24%)
- Global Fixed Interest 13% (11%)
- Japanese Equities 7% (7%)
- Other International Equities 0% (0%)
- Asian equities 5% (4%)
- European Equities 0% (0%)
- UK Fixed Interest 6% (5%)
- Cash 7% (4%)
- Alternative Investment Strategies 18% (14%)
- Emerging Asia equities 5% (6%)
- Emerging Market Fixed Interest 0% (0%)
- Property 7% (6%)

£200 Pension Cashback Offer
Make a qualifying deposit or transfer a pension to our partner Interactive Investor.
- Deposit or transfer a pension of at least £20k and you could earn £200 cashback
- Terms and Fees apply, Capital at risk
- New & Existing customers opening a SIPP
- Offer ends 31st July 2026
Before starting your transfer, check you won't lose any valuable benefits (such as guaranteed annuity rates or a lower protected pension age) and find out what exit fees you might have to pay
