

The background to my portfolio
Back in March 2015 I decided to invest £50,000 of my own money using 80-20 Investor. The purpose was twofold, firstly to show how you can use 80-20 Investor to invest and outperform the market with only a few minutes effort every now and then. Secondly, no other investment commentator, journalist or research provider invests their own money for fear of failing. This is a sorry state of affairs and is precisely why I committed to openly running my own portfolio for 80-20 Investor members to see.
Since then I have periodically changed my portfolio using the fund suggestions provided by the 80-20 Investor algorithm and associated research. I always disclose the changes at the time they are made.
Performance update
February 2018 will live long in the memory of investors despite the month only being 12 days old. With equity markets tumbling, in some cases by more than 10%, I analysed what caused the equity market correction in last week's newsletter. It was always my intention to review my own portfolio earlier this month but the spike in volatility put paid to that. When volatility rises (and it did last week to unprecedented levels) then it is important to keep your emotions in check as often the knee-jerk decisions can end up being the worst ones.
As is usual in my portfolio reviews, the chart below shows how my portfolio has outperformed since I started the challenge in March 2015. The green line is the performance of my portfolio while the red line is the benchmark showing the average return achieved by professional fund managers given the same asset mix. To accurately calculate this I have used the average return for each sector in which my portfolio invested. The blue line shows what the average multi-asset fund with comparable equity content achieved. In other words, the red line would show the extra performance added by just the asset mix of my portfolio (where I was invested i.e European equities etc) over picking a typical multi-asset fund (the blue line). While the green line (which is my actual performance) shows the impact of being in the right funds at the right time, as identified by the 80-20 Investor algorithm.
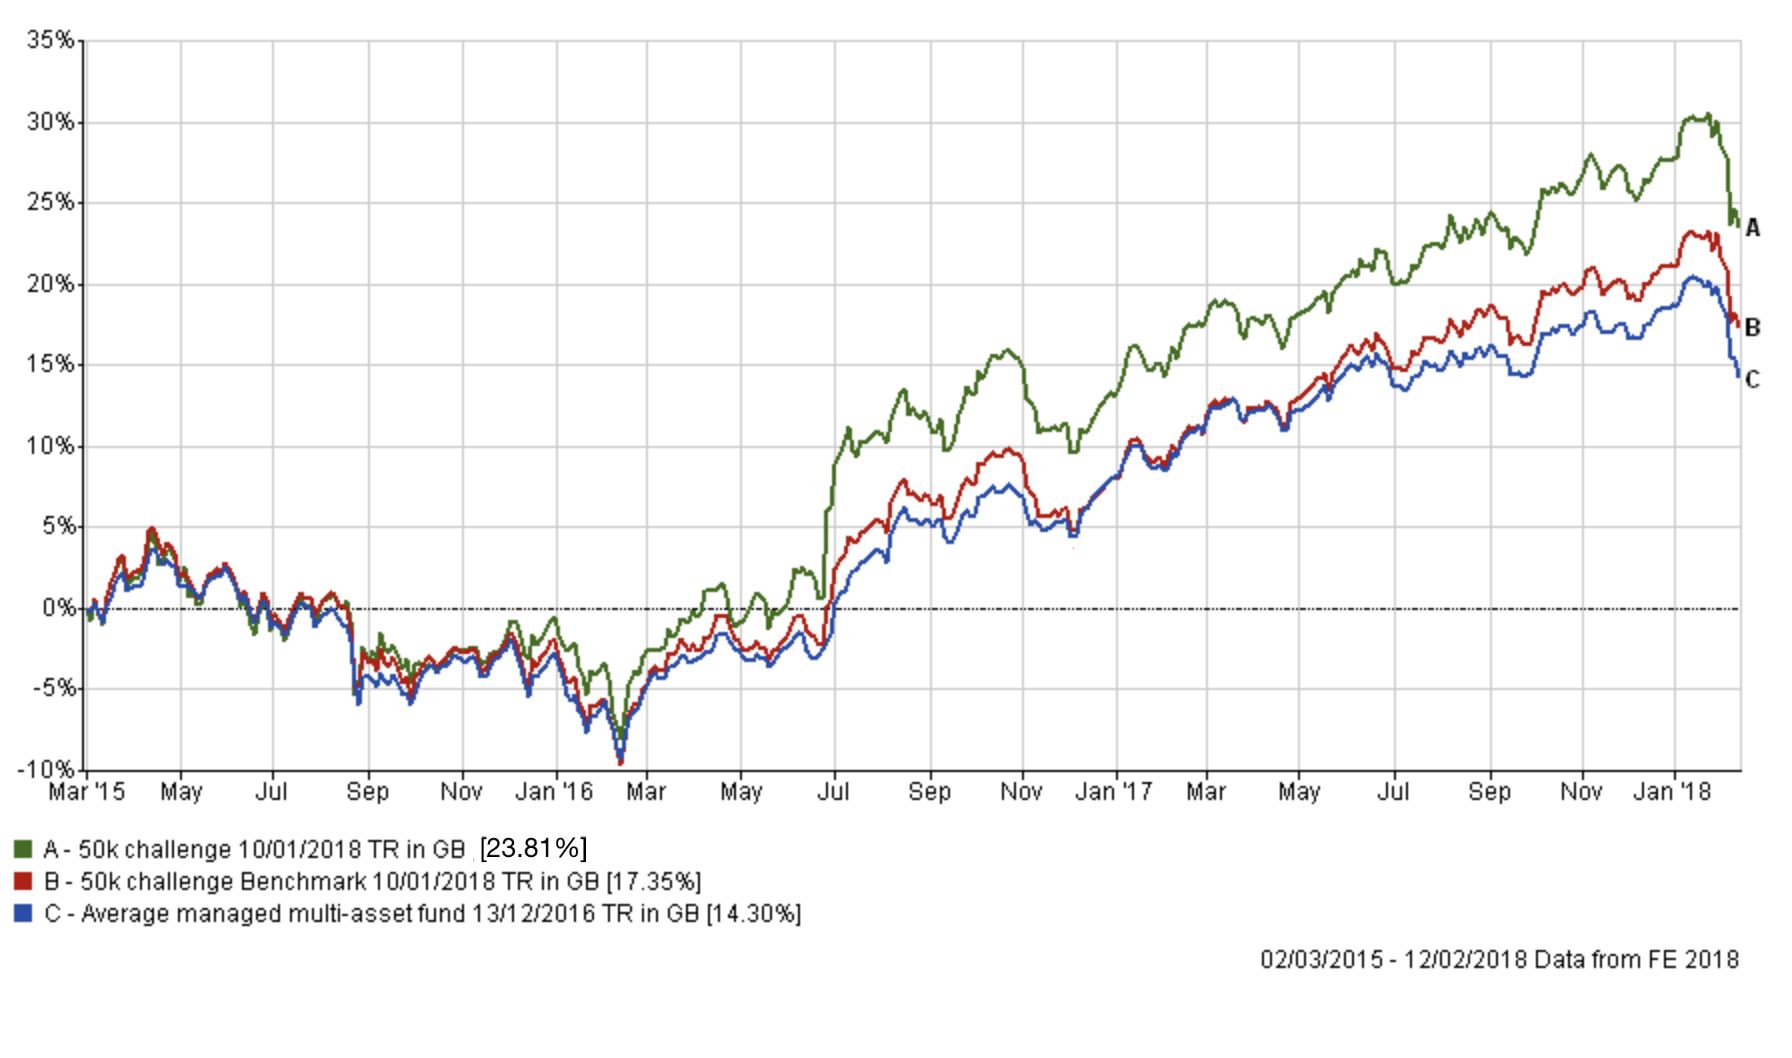
So despite last week's equity sell-off my portfolio continues to outperform its benchmarks. But how did it do during the sell-off? The market sell-off from peak to trough ran from 26th January to 8th February (which so far has been the market bottom). The table below shows the maximum paper-loss at any point incurred by each of the benchmarks during the recent sell-off as well as for a Vanguard passive tracker index, which matched my portfolio's asset mix, and for the average managed fund from the Mixed Investment 40-85% Shares sector. The reason I have made this comparison is that a common criticism of a momentum strategy is that you get more upside but much more of the downside. The table below shows that this is clearly not the case. For example, if you look at the table below, at one point my portfolio was 4.8% lower than where it was before the sell-off started on 26th January. By comparison, the passive benchmark was down over 5% at one point. You can see that my portfolio did give up some of its outperformance over its benchmark but, while no one likes to lose money during such a severe sell-off, I am more than happy with that result given that cash was the only haven asset class. The market correction has proved a good test of the resilience of my portfolio and the algorithm which does have a volatility screen built into it. Of course with the benefit of hindsight, I wished I'd made a couple of changes prior to the carnage but such thinking is ultimately pointless. You simply can't win them all.
| Portfolio | Max loss during sell-off |
| Passive Vanguard benchmark | 5.04% |
| My £50k portfolio | 4.80% |
| Averaged Multi-asset managed fund | 4.17% |
| 50k challenge benchmark | 4.30% |
The table below shows my current portfolio, with those funds in green still in the BOTB while those in yellow are not in the BOTB but remain in the BFBS list. Meanwhile, any funds in red have dropped out of both shortlists. I have included the table because I traditionally do so when compiling these reviews of my portfolio but I'm placing a little less emphasis on the colouring this time around because of the level of volatility in markets. For example, the BOTB was compiled before the sell-off while the latest BFBS tables take it into account.
| Name | Allocation % (rounded) | Risk | Sector | ISIN Code | SEDOL Code |
| 7IM US Equity Value | 13.8 | High | North America | GB00BWBSHX88 | BWBSHX8 |
| Baring Eastern Trust | 4.8 | High | Asia Pacific Excluding Japan Ret | GB0000799923 | 79992 |
| F&C Property Growth and Income | 3.6 | Low | Property | GB00BQWJ8687 | BQWJ868 |
| Fidelity China Consumer | 6.8 | High | China/Greater China | GB00B82ZSC67 | B82ZSC6 |
| Insight Global Absolute Return | 8.2 | Low | Targeted Absolute Return | GB00B86R4N19 | B86R4N1 |
| Man GLG UK Income | 3.4 | Medium | UK Equity Income | GB00B0117B11 | B0117B1 |
| Neptune Japan Opportunities | 10.6 | Medium | Japan | GB00B3Z0Y815 | B3Z0Y81 |
| Premier Diversified | 18.8 | Low | Mixed Investment 40-85% Shares R | GB00B8BJV423 | B8BJV42 |
| TM Cavendish AIM | 10.6 | High | UK Smaller Companies | GB00B0JX3Z52 | B0JX3Z5 |
| TwentyFour Dynamic Bond | 16.2 | Low | Sterling Strategic Bond | GB00B5KPRZ34 | B5KPRZ3 |
| Wise Funds Limited TB Wise Multi-Asset Growth | 3.2 | Medium | Flexible Investment | GB0034272533 | 3427253 |
It is also worth considering the line chart below (click to enlarge) showing how each of my fund picks performed during the recent market sell-off.
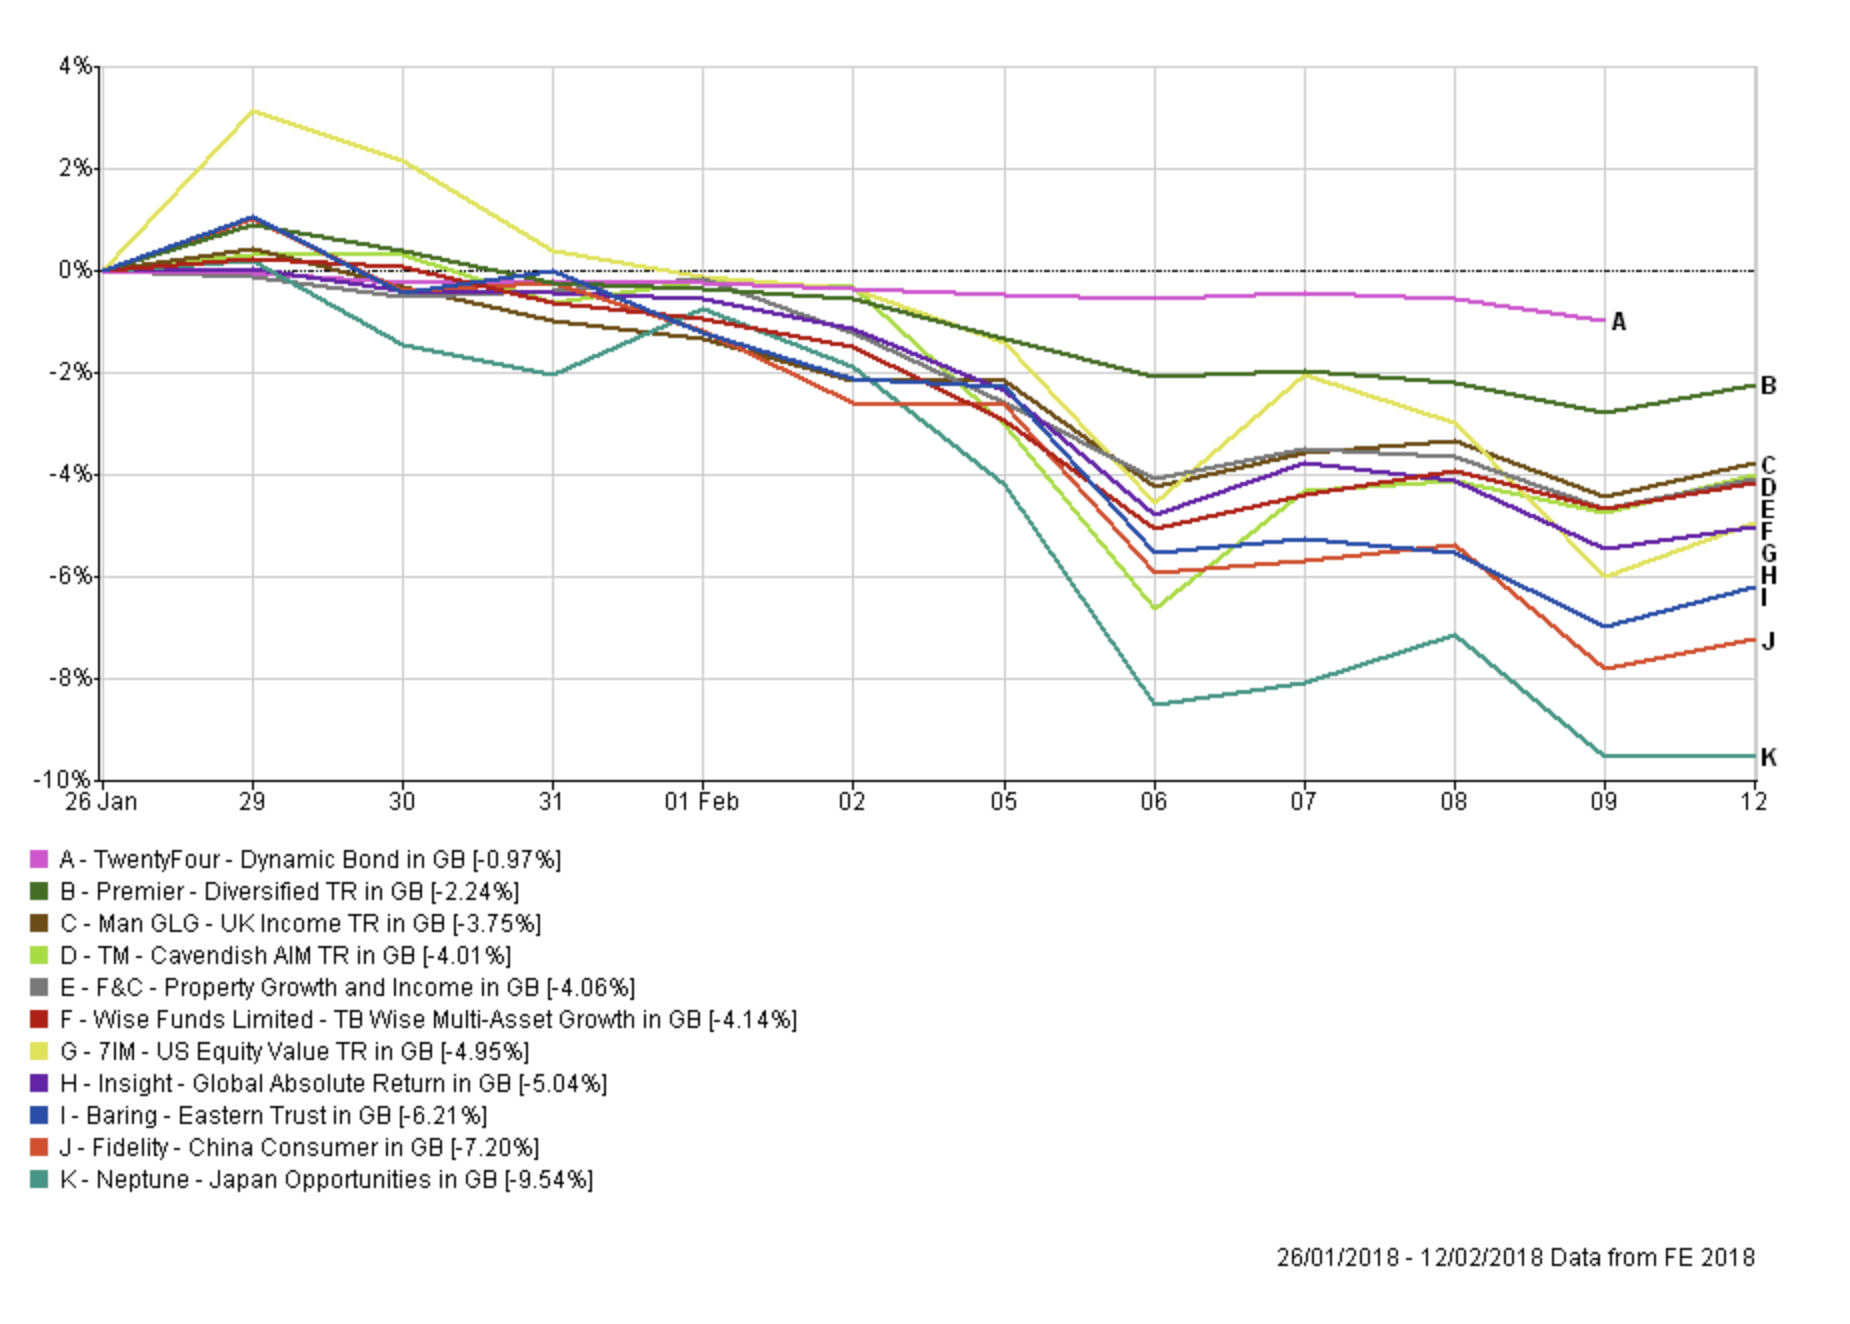
At the time of writing, equity markets have staged something of a comeback with many analysts citing that the worst is behind us. There has been a strong bounce in US equity markets in the last few days, with them posting the strongest two-day gains for more than two years. It again goes to confirm what my previous research highlighted, which is that the strongest days often follow some of the darkest days on the stock market. Yet despite the relief, we are not out of the woods yet. One of the more intriguing and unsettling aspects of the recent sell-off is the sudden positive correlations across asset classes. Usually when equity markets fall haven assets, such as bonds, rally. This time that has not been the case. It is part of the reason why active fund managers and passive funds have struggled to add value in the recent sell-off. Typically bonds are the diversifier of choice in an equity-based portfolio, whether active or passive. However, they have been offering little protection of late. Also as you can see from the line chart above that my attempts to diversify my low-risk holdings into property (admittedly there is an equity element to this fund), as well as a targeted absolute return fund and one from the flexible investment sector, offered little protection. Unfortunately, both the Insight and the Wise multi-asset funds were earmarked by me for review before the equity market carnage began as they had tumbled out of all the 80-20 Investor tables. We can't have it all our own way unfortunately!
With equity markets so volatile I am loathed to make many wide-scale fund switches (i.e sell and a buy instructions) as the market could move against me pretty easily. For that reason, I will leave the Cavendish Aim fund (which is red) in place for the time being. Perhaps more importantly with markets in a state of flux I would prefer to wait until next month BOTB tables to see the lie of the land when hopefully volatility will have subsided and the impact of the sell-off feeds through the data and new opportunities emerge. As I mentioned in my recent newsletter I am investing for the long term and so want to remain in the market as much as possible.
Having said that with the correlation between the funds in my portfolio increasing I am keen to reduce this, in case we experience the Armageddon scenario of a 20-30% fall in equity markets from here. It is for that reason that I plan to make the move out of the following funds and into cash until the next publication of the new BOTB in a few weeks. Cash is the only low-risk asset that hasn't tracked equity markets lower. The three funds listed below were meant to diversify my equity-based portfolio but without an over-reliance on bonds.
- Wise Funds Limited TB Wise Multi-Asset Growth
- Insight Global Absolute Return
- F&C Property Growth and Income
The earlier performance chart showed how well the TwentyFour Dynamic Bond held up in the market turmoil, even when bond markets fell, the opposite can be said for Wise Funds Limited TB Wise Multi-Asset Growth and Insight Global Absolute Return. While the Premier Diversified fund is no longer in the BOTB or BFBS the chart above shows how well it held up in the sell-off. That is exactly what you want from a diversified low-risk fund.
The only other tweak I plan to make is to reduce my Neptune Japan Opportunities holding by 50%, again putting the proceeds into cash until the start of the new month. While the market may well rally from here I had planned to reduce its exposure more in line with the 80-20 Investor BOTB before the sell-off. The fund had performed well prior to the sell-off but it has proved a significant drag on my portfolio's performance triggering a number of stop losses along the way. So rather than exit the fund I will just reduce my holding by 50% for now. While I might have tweaked other areas of my portfolio in a calmer environment I am using cash to diversify temporarily (don't forget that cash is a useful asset class in its own right). That will mean that my portfolio's equity exposure does drop slightly from just over 64% to around 54% but the impact on the upside of my portfolio will be marginal. I will end up with around 20% cash in my portfolio for the next few weeks while I wait for the new BOTB.
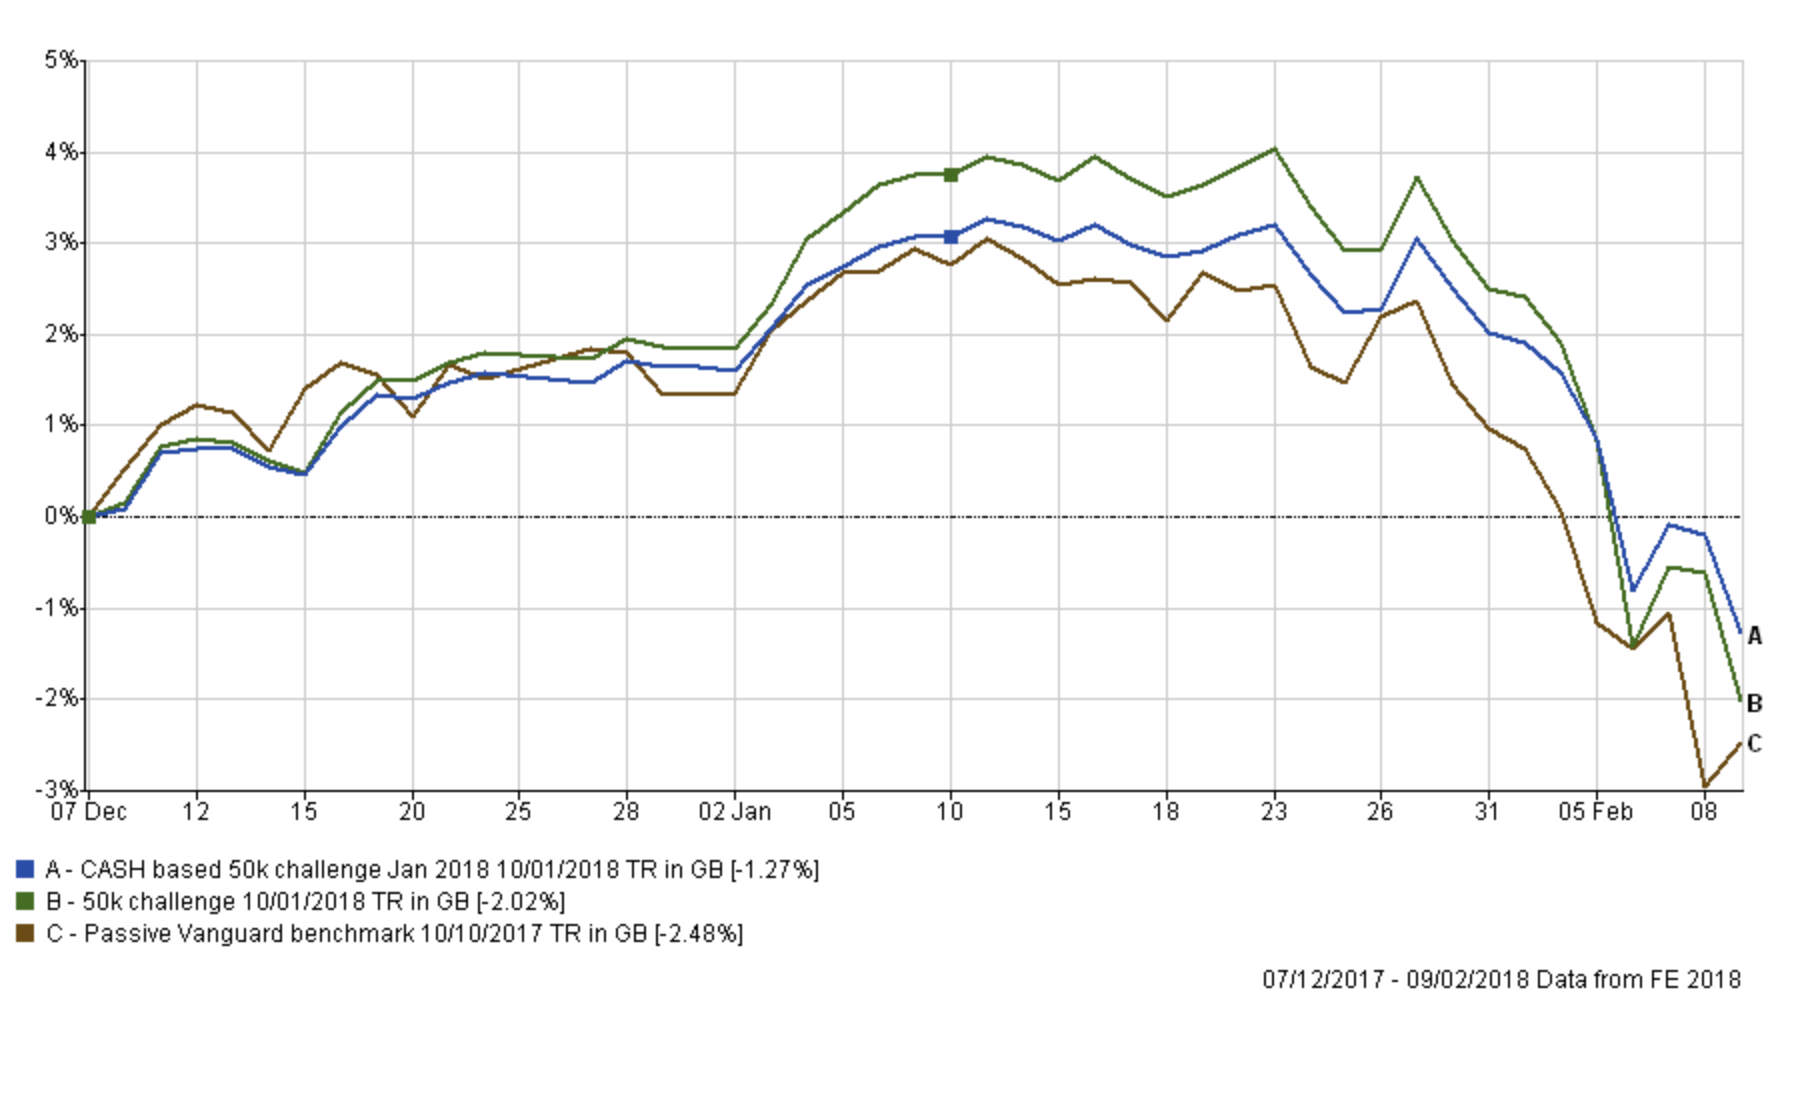
It is an interesting exercise to see how holding cash rather than the aforementioned funds would have impacted my portfolio recently. The chart below shows how my actual portfolio performed since early December (when the market was at a similar level to now) versus if it had held 20% cash instead of the aforementioned funds. It's a useful comparison because a complete rebound towards the market highs we experienced in January from where we are today is the same as the rise from December to mid-January on the chart below. It highlights that I'd have given up around 0.6% to 0.7% upside in performance but would have gained 1.3% protection (i.e have lost 1.3% less) in the sell-off. The chart also shows how I would have performed against one of the best passive strategies.
By making the tweaks I can provide some downside protection by reducing risk while remaining largely invested in equity markets. Only time will tell whether it proves a wise move, but just like any kind of insurance you don't really want it to be called upon.
When reviewing my portfolio the choice was to remain fully invested or to diversify by removing a few bad eggs. The only haven asset at present is cash which is why I've favoured it this time around when making changes. Think of it as an extended fund switch given the absence of compelling low-risk alternatives until the dust settles. It's not about market timing, as I'm not trying to predict exit and entry points, it's about pruning and trying to manage risk in order to still capture a lot of the upside but while acknowledging the possibility of a more severe sell-off. That is what lies at the heart of 80-20 Investor, the flexibility to manage risk and make investment choices that you are comfortable with.
Fund switches
- 100% out of Wise Funds Limited TB Wise Multi-Asset Growth and into cash
- 100% out of Insight Global Absolute Return and into cash
- 100% out of F&C Property Growth and Income into cash
- 50% out of Neptune Japan Opportunities and into cash
As my portfolio is held within an ISA, when moving into cash I have made sure it remains within the ISA cash account in order to preserve its tax advantageous status.
Overall I am only switching about 20% of my portfolio, nothing too drastic, and my new portfolio will look as follows with an equity exposure of around 50%:
| Name | Allocation % (rounded) | Risk | Sector | ISIN Code | SEDOL Code |
| 7IM US Equity Value | 13.5 | Medium | North America | GB00BWBSHX88 | BWBSHX8 |
| Baring Eastern Trust | 4.7 | High | Asia Pacific Excluding Japan Ret | GB0000799923 | 79992 |
| Fidelity China Consumer | 6.7 | High | China/Greater China | GB00B82ZSC67 | B82ZSC6 |
| Man GLG UK Income | 3.3 | Medium | UK Equity Income | GB00B0117B11 | B0117B1 |
| Neptune Japan Opportunities | 5 | Medium | Japan | GB00B3Z0Y815 | B3Z0Y81 |
| Premier Diversified | 19.1 | Low | Mixed Investment 40-85% Shares R | GB00B8BJV423 | B8BJV42 |
| TM Cavendish AIM | 10.7 | High | UK Smaller Companies | GB00B0JX3Z52 | B0JX3Z5 |
| TwentyFour Dynamic Bond | 17 | Low | Sterling Strategic Bond | GB00B5KPRZ34 | B5KPRZ3 |
| Cash | 20 | Low |
My new asset mix
This means my new asset mix is (previous asset mix is in brackets):
- UK Equities 18% (19%)
- North American Equities 17% (17%)
- Global Fixed Interest 13% (13%)
- Japanese Equities 6% (11%)
- Other International Equities 3% (5%)
- Asian equities 4% (4%)
- European Equities 0% (0%)
- UK Fixed Interest 5% (6%)
- Cash 21% (4%)
- Alternative Investment Strategies (including property) 7% (13%)
- Emerging Asia equities 6% (8%)
- Emerging Market Fixed Interest 0% (0%)

£200 Pension Cashback Offer
Make a qualifying deposit or transfer a pension to our partner Interactive Investor.
- Deposit or transfer a pension of at least £20k and you could earn £200 cashback
- Terms and Fees apply, Capital at risk
- New & Existing customers opening a SIPP
- Offer ends 31st July 2026
Before starting your transfer, check you won't lose any valuable benefits (such as guaranteed annuity rates or a lower protected pension age) and find out what exit fees you might have to pay
