

The background to my portfolio
Back in March 2015 I decided to invest £50,000 of my own money using 80-20 Investor. The purpose was twofold, firstly to show how you can use 80-20 Investor to invest and outperform the market with only a few minutes effort every now and then. Secondly, no other investment commentator, journalist or research provider invests their own money for fear of failing. This is a sorry state of affairs and is precisely why I committed to openly running my own portfolio for 80-20 Investor members to see.
Since then I have periodically changed my portfolio using the fund suggestions provided by the 80-20 Investor algorithm and associated research. I always disclose the changes at the time they are made.
Performance update
My portfolio has continued to perform extremely well while not taking excessive risks, typically around 50-60% equities. At present it has approximately 62% of the portfolio invested in equities which is the highest level for quite some time. I have produced over 28% profit despite the various crises we have experienced including a Greek crisis, a Chinese economic slowdown, a commodity crisis, Brexit vote and Donald Trump's surprise election win.
The chart below shows how my portfolio has outperformed since I started the challenge in March 2015. The green line is the performance of my portfolio while the red line is the benchmark showing the average return achieved by professional fund managers given the same asset mix. To accurately calculate this I have used the average return for each sector in which my portfolio invested. The blue line shows what the average multi-asset fund with comparable equity content achieved. In other words the red line would show the extra performance added by just the asset mix of my portfolio (where I was invested i.e European equities etc) over picking a typical multi-asset fund (the blue line). While the green line (which is my actual performance) shows the impact of being in the right funds at the right time, as identified by the 80-20 Investor algorithm. At the time of writing, I have turned my original £50,000 into £64,033 which is a profit of 28.07% (slightly above that shown on the chart below)
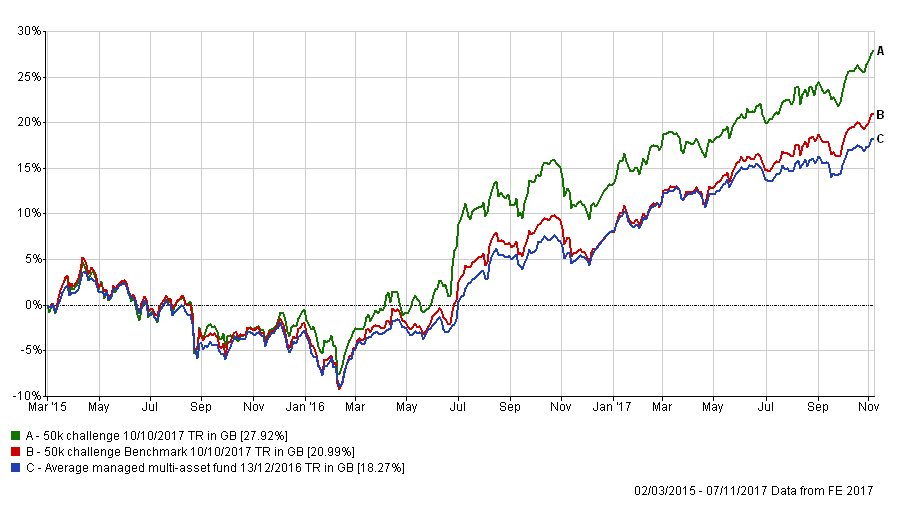
The boost provided by where I am invested (my portfolio's asset mix) has continued to grow and that is down to my exposure to Asian equities as well as emerging markets (such as China). This has then been amplified by being in the right funds within those sectors. Long may this continue.
The table below shows my current portfolio, with those funds in green still in the BOTB while those in yellow are not in the BOTB but remain in the BFBS list. Meanwhile any funds in red have dropped out of both shortlists.
| Name | Allocation % (rounded) | Risk | Sector | ISIN Code | SEDOL Code |
| Aberdeen Emerging Markets Bond | 3.3 | Medium | Global Emerging Markets Bond | GB00B5L9HN22 | B5L9HN2 |
| Baillie Gifford American | 10.7 | Medium | North America | GB0006061963 | 606196 |
| Baillie Gifford Emerging Markets Growth | 3.3 | High | Global Emerging Markets | GB0006020647 | 602064 |
| Baring Eastern Trust | 3 | High | Asia Pacific Excluding Japan | GB0000799923 | 79992 |
| CF Miton European Opportunities | 10.5 | High | Europe Excluding UK | GB00BZ2K2M84 | BZ2K2M8 |
| F&C Property Growth and Income | 3.6 | Medium | Property | GB00BQWJ8687 | BQWJ868 |
| Fidelity China Consumer | 6.7 | High | China/Greater China | GB00B82ZSC67 | B82ZSC6 |
| Man GLG Strategic Bond | 13.6 | Low | Sterling Strategic Bond | GB00B731HR48 | B731HR4 |
| Man GLG UK Income | 3.3 | Medium | UK Equity Income | GB00B0117B11 | B0117B1 |
| Premier Diversified | 18.6 | Low | Mixed Investment 40-85% Shares | GB00B8BJV423 | B8BJV42 |
| TM Cavendish AIM | 15.2 | High | UK Smaller Companies | GB00B0JX3Z52 | B0JX3Z5 |
| TwentyFour Dynamic Bond | 8.2 | Low | Sterling Strategic Bond | GB00B5KPRZ34 | B5KPRZ3 |
Looking at the table above the first thing that jumps out is that all of my funds remain in either the BFBS or BOTB tables, but mostly the BOTB. That is the first time that's happened in a while and emphasises that there is no need for an overhaul. Once again the Twentyfour Dynamic Bond fund hangs in there although it remains on my watchlist. Elsewhere, while the CF Miton European Opportunities and the Aberdeen Emerging Market Bond funds are still outperforming their peers their respective asset classes have lost momentum versus other equity and bond sectors. In other words, while both appear in their respective BFBS tables the asset mix of this month's BOTB suggests there may better opportunities elsewhere.
In the high risk section of this month's BOTB Japanese equities ousted European equities thanks to a stellar run during October. I wrote in this month's BOTB analysis:
"European equities did not perform badly [during October] as they largely shrugged off the political events in Catalonia. For example the Jupiter European fund made over 4% in October. However, the Japanese stock market has been boosted by a weaker yen as well as renewed hopes of more fiscal and monetary easing which would be good news for Japanese stocks. It was a change [with Japanese equities replacing European equities in the BOTB] that perhaps should have come as no surprise especially when I tell you that some of the best performing Japanese equity funds made over 6.5% in October. That’s not to say European equities are terrible, it’s just that in the high risk space Japanese equities have been riding a stronger uptrend."
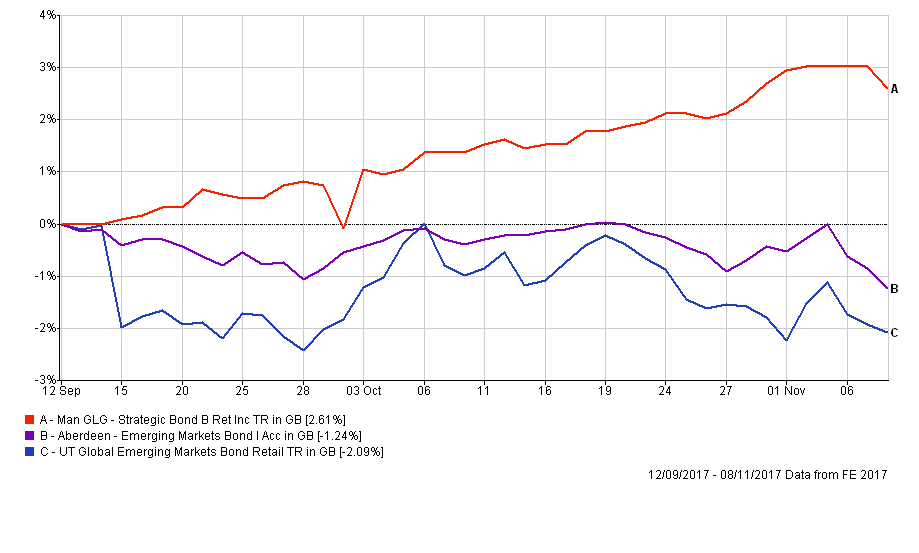
In the last 6 weeks the Nikkei 225 has risen an incredible 14.5%. The question is whether that is sustainable. Either way the momentum is clearly with Japanese equities for now even if they are due a breather. I always try to keep my portfolio's asset mix in line with that of the BOTB where possible which means I am reducing my European equity exposure in favour of Japanese equities. Similarly while emerging market bonds have taken a bit of breather I am keen to maintain the bond exposure of my portfolio while at the same trying to maximise returns. Since I've held the Aberdeen fund it has outperformed its peers but it has lagged my Man GLG Strategic Bond fund which is a well diversified bond fund (click on chart below to enlarge).
Fund switches
- 100% out of Aberdeen Emerging Markets Bond and 100% into Man GLG Strategic Bond. This is simply a case of backing a winner, in the form of the Man GLG fund, for reasons that are clear from the chart above. Not only has the Man GLG fund outperformed the Aberdeen fund it has a weekly max fall value of around half that of the Aberdeen fund. Unsurprisingly it resides in the low risk section of the BOTB so reduces my portfolio's risk level slightly. The switch also reduces the number of fund holdings by one, which is useful as the next switch sees the inclusion of a new fund into my portfolio
- 70% out of CF Miton European Opportunities and 100% into Neptune Japan Opportunities. Leaving 30% of the CF Miton in place means that my European exposure remains in line with that of BOTB. Choosing which Japanese equity fund from the two listed in this month's BOTB was tricky. The Baillie Gifford Japanese fund is cheaper than the Neptune fund and has fared marginally better during a market fall (hence its lower max weekly fall figure). However if you look at the bar charts for the two funds you will notice that in August and September the two funds performed in opposite directions to one another (when one fell the other rose and vice versa). Other than that there's not a lot to choose between their recent performance and in fact I've held both funds within my portfolio previously. The reason for the August/September difference is that Neptune Japan Opportunities hedges out most of its currency exposure. So you simply get the return that the Japanese stock market produces without any interference from currency moves. That's why in September the Neptune fund performed well because a sudden rally in the pound meant that unhedged funds saw their value in sterling terms fall. So what they made on the Japanese stock market they lost when it was converted back into pounds. However, as Neptune Japan Opportunities is hedged it didn't lose out on the currency conversion and so outperformed its peers. In August the opposite was true when the pound tumbled which therefore favoured funds like Baillie Gifford Japanese but hindered the hedged Neptune Japan Opportunities fund. So my choice between which fund to choose for my portfolio is influenced by where I think the pound might go from here. If I think the pound will strengthen I should opt for the Neptune fund but if I think the pound will fall then I should opt for the Baillie Gifford fund. In truth I don't know which way the pound will move as it has range traded for some time. The biggest driver of return in the short term is likely to be whether the Japanese equity rally continues, rather than currency moves unless something unexpected happens. So I opted for the Neptune fund because a sizeable portion of my portfolio has an unhedged exposure to the strength of the pound. In the absence of having a strong view of the future direction of the pound I felt it better to diversify and opt for the hedged Neptune Japan Opportunities fund
- 30% out of TM Cavendish AIM and 66% into Baillie Gifford American and 34% into the Baring Eastern Trust . This trade brings my asset mix more in line with the BOTB and is a case of backing existing winners
Overall I am only switching about 15% of my overall portfolio which emphasises that this is a case of good housekeeping. I will still have 12 funds in my portfolio after removing one and replacing it with a new fund.
My new portfolio will look like this and leaves my equity exposure around 62%:
| Name | Allocation % (rounded) | Risk | Sector | ISIN Code | SEDOL Code |
| Baillie Gifford American | 13.7 | Medium | North America | GB0006061963 | 606196 |
| Baillie Gifford Emerging Markets Growth | 3.3 | High | Global Emerging Markets | GB0006020647 | 602064 |
| Baring Eastern Trust | 4.7 | High | Asia Pacific Excluding Japan | GB0000799923 | 79992 |
| CF Miton European Opportunities | 3.1 | High | Europe Excluding UK | GB00BZ2K2M84 | BZ2K2M8 |
| F&C Property Growth and Income | 3.5 | Low | Property | GB00BQWJ8687 | BQWJ868 |
| Fidelity China Consumer | 6.9 | High | China/Greater China | GB00B82ZSC67 | B82ZSC6 |
| Man GLG Strategic Bond | 16.8 | Low | Sterling Strategic Bond | GB00B731HR48 | B731HR4 |
| Man GLG UK Income | 3.3 | Medium | UK Equity Income | GB00B0117B11 | B0117B1 |
| Neptune Japan Opportunities | 7.2 | High | Japan | GB00B3Z0Y815 | B3Z0Y81 |
| Premier Diversified | 18.7 | Low | Mixed Investment 40-85% Shares | GB00B8BJV423 | B8BJV42 |
| TM Cavendish AIM | 10.7 | Medium | UK Smaller Companies | GB00B0JX3Z52 | B0JX3Z5 |
| TwentyFour Dynamic Bond | 8.1 | Low | Sterling Strategic Bond | GB00B5KPRZ34 | B5KPRZ3 |
My new asset mix
This means my new asset mix is (previous asset mix is in brackets):
- UK Equities 18% (23%)
- North American Equities 17% (14%)
- Global Fixed Interest 18% (17%)
- Japanese Equities 7% (0%)
- Other International Equities 3% (3%)
- Asian equities 5% (3%)
- European Equities 4% (12%)
- UK Fixed Interest 6% (6%)
- Cash 1% (0%)
- Alternative Investment Strategies (including property) 13% (12%)
- Emerging Asia equities 8% (8%)
- Emerging Market Fixed Interest 0% (2%)

£200 Pension Cashback Offer
Make a qualifying deposit or transfer a pension to our partner Interactive Investor.
- Deposit or transfer a pension of at least £20k and you could earn £200 cashback
- Terms and Fees apply, Capital at risk
- New & Existing customers opening a SIPP
- Offer ends 30th June 2026
Before starting your transfer, check you won't lose any valuable benefits (such as guaranteed annuity rates or a lower protected pension age) and find out what exit fees you might have to pay
