

The background to my portfolio
Back in March 2015 I decided to invest £50,000 of my own money using 80-20 Investor. The purpose was two-fold, firstly to show how you can use 80-20 Investor to invest and outperform the market with only a few minutes effort every now and then. Secondly, no other investment commentator, journalist or research provider invests their own money for fear of failing. This is a sorry state of affairs and is precisely why I committed to openly running my own portfolio for 80-20 Investor members to see.
Since then I have periodically changed my portfolio using the fund suggestions provided by the 80-20 Investor algorithm and associated research. I always disclose the changes at the time they are made.
Outperformance
My portfolio has continued to perform extremely well while not taking excessive risks, typically around 50-60% equities. At present it has approximately 70% of the portfolio invested in equities which is the highest level for quite some time. I have produced a double-digit profit despite the various crises we have experienced including a Greek crisis, a Chinese economic slowdown, a commodity crisis, Brexit vote and Donald Trump's surprise election win.
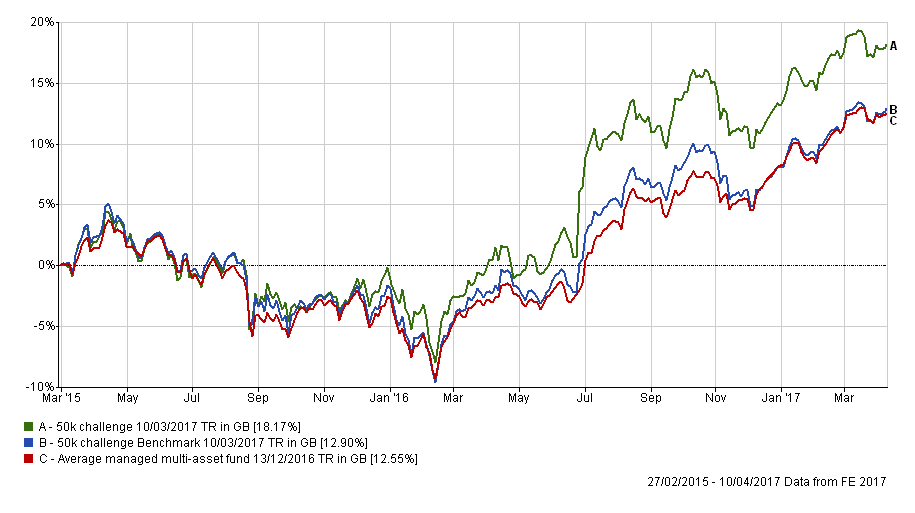
The chart below shows how my portfolio has outperformed since I started the challenge in March 2015. The green line is the performance of my portfolio while the blue line is the benchmark showing the average return achieved by professional fund managers given the same asset mix. To accurately calculate this I have used the average return for each sector in which my portfolio invested. The red line shows what the average multi-asset fund with comparable equity content achieved. In other words the blue line would show the extra performance added by just the asset mix of my portfolio (where I was invested i.e European equities etc) over picking a typical multi-asset fund (the red line). While the green line (which is my actual performance) shows the impact of being in the right funds at the right time, as identified by the 80-20 Investor algorithm.
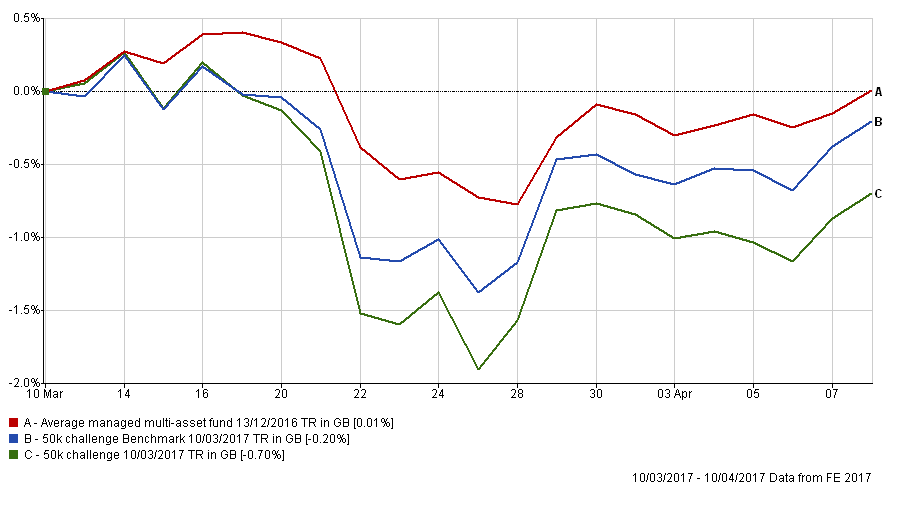
Last month marked the two year anniversary of my portfolio and I scrutinised the performance in my article Damien’s portfolio review – 2 years on and winning. Since that time the market has struggled to make headway and the story has been the same for my portfolio. The chart below shows that my portfolio lagged its benchmark in March and this was principally due to my US and Japanese equity holdings dragging on performance. You may recall that last month I reduced my European equity exposure in favour of US equities. With the benefit of hindsight that was unfortunate timing but the US/Europe switch only accounts for 0.14% of the underperformance. I am still happy with the rationale behind my decision and it is still only early days.
The table below shows my current portfolio, with those funds in green still in the BOTB and while those in yellow are not in the BOTB but remain in the BFBS list. Meanwhile the funds in red have dropped out of both shortlists.
You can see that there is no need to make radical changes at all . Only two funds are no longer in the fund shortlists, namely M&G Global Dividend and 7IM Unconstrained. The only other fund to remain outside of the BOTB, but in the BFBS, is AXA Framlington Managed Income. Last month I reduced my holding in this fund as I looked to reduce my overall UK fixed interest exposure. Interestingly the JOHCM UK Equity fund has returned to the BOTB list as I suggested it might do in my last update.
As I regularly point out in these commentaries, for the last two years you will notice that I prefer to prune and tweak and, where possible, limit the changes made to my portfolio. That's because you need to allow some time to ride the unfolding trends. The underlying research baked into the 80-20 Investor algorithm allows for funds to be held for up to six months. That means there is no need to knee-jerk and change funds every month.
At the time of writing there are a number of factors causing a rise in market nervousness including:
- what the US plans to do about Syria
- an unexpected rise in popularity of the far-left candidate in the French Presidential Election. Both he and the far-right candidate, Le Pen, have confirmed they want to take France out of the EU.
- US earnings season apprehension
- hard economic data undershooting soft data - don't forget hard data is actual economic measurements while soft data is often sentiment indicators
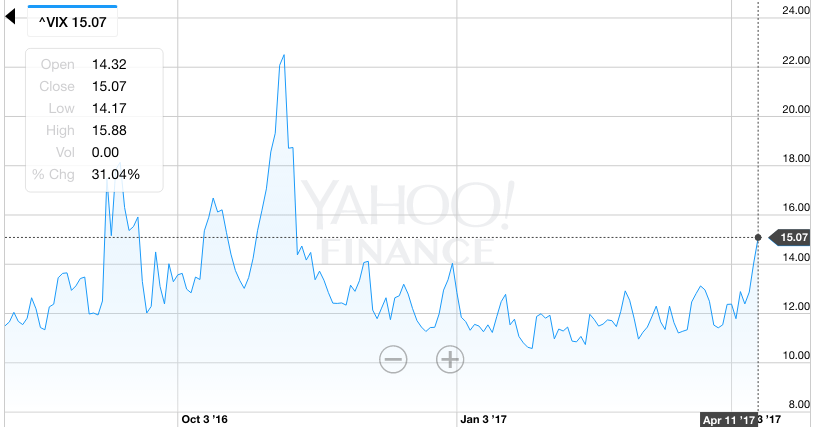
In the last week we've also seen the biggest intra day US equity market reversal since the market sell-off in February 2016. Unsurprisingly the equity market fear gauge has also risen to levels not seen since ahead of the US election when everyone was fearful of a Trump win, as shown in the chart below.
As such I am loathed to make unnecessary switches in such volatile markets. Things are just as likely to get worse before they get better given the geopolitical risks at the moment.
So for now I am only making one minor change to my portfolio. I will maintain my holdings in the two funds that are no longer in the BOTB . The 7IM fund is a low risk play anyway so is of less concern in a volatile market. The M&G Global Dividend fund has had a disappointing month but I will hold it for now and keep a watching brief. The fund only just failed to make either of the 80-20 Investor fund shortlists and has enjoyed a slight rebound in the past week. Both funds are earmarked for potential removal but the heightened market volatility could move against me if I simply swap for an alternative global fund for example. Any benefit could be negated by a sudden rebound in markets. As I’ve said there is no compulsion to change funds every month, especially in a fast moving macro environment.
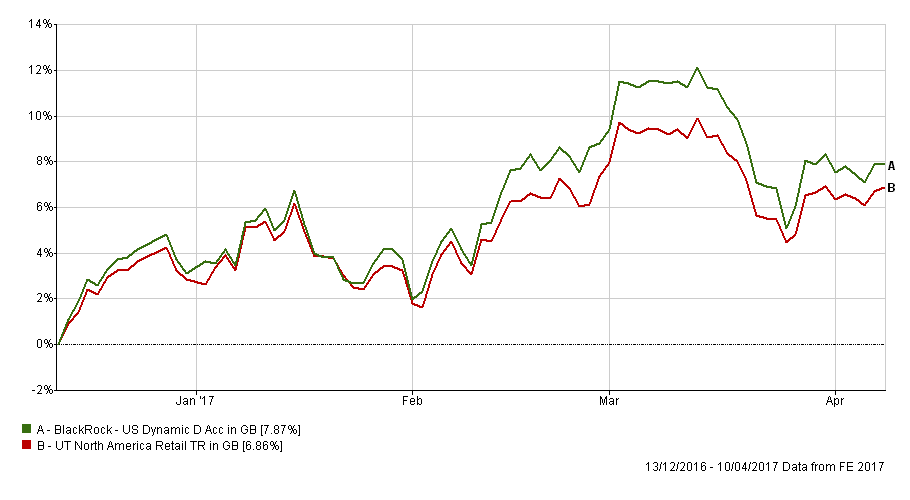
Of course this is just my view and many other investors will decide to make changes which is their prerogative. The Blackrock US Dynamic fund has been a strong performer since entering my portfolio in December but had a difficult month in March as US equities sagged. It even triggered an 80-20 Investor stop loss alert when it fell over 5% from its high point. The chart below shows the total return it has achieved versus its peers in just four months. Since the tumble last month the fund has recovered slightly.
One or two people asked why I didn’t sell the fund out of my portfolio when the stop loss triggered and how it has made it back into the BOTB selection this month. The chart below sheds light on the latter of the two questions. US equities tumbled broadly as a result of the Trump healthcare defeat and concerns over future interest rate moves. The fund may have had a tough month but it is still comfortably outperforming its peers.
With regard to the first question, when I run my portfolio I don’t follow the stop loss alerts religiously. Below is an extract from my answer to a previous Chatterbox question regarding my use of stop loss alerts.
“As you already know the stop loss alerts should not be seen as advice or an instruction to sell your investments, they are for information purposes only. However, they give you an early warning signal that markets may be turning and to review your fund holdings. That part I did, if only mentally which meant that you were unaware.
However the reason that I didn’t take any action was that I am investing for the long term and I’m regularly reviewing things in any event. Plus in most cases I was still sitting on a decent profit from the point at which I originally invested in the fund.
Don’t forget that the 80-20 Investor stop losses are trailing stop losses so trigger when a fund falls by more than 5% from its high. So I was prepared to hold the fund for a bit longer. The fund has rebounded slightly since. So as a result of the stop loss I kept an eye on things more closely than I otherwise would have.
As I said earlier, I am investing for the long term so I am happy to ride the ups and downs of markets. Don’t forget that since I’ve been running the portfolio I’ve invested through various volatile periods including Brexit, the US election, last years’ January sell-off and the previous summer’s China inspired crash. I will always tend to stay invested throughout any period good or bad. In the past I have used the stop loss alerts to good effect when riding the Chinese equity bubble in 2015. They can be very useful when you initially enter a market that already looks stretched'.
Overall the asset allocation of my portfolio is not too dissimilar to that of the BOTB, certainly not enough to warrant any large-scale changes. One area I am conscious that I’ve not entered into is Asian equities, which has been present in the last two BOTB updates. For that reason I am brining some Asian exposure into my portfolio by reducing my Japanese equity exposure by a third.
This has the added benefit of brining down my Japanese equity exposure , an area that has struggled of late, more in line with the BOTB. In addition my Asian equity exposure will be in line with the BOTB at 3%. This is a minor change which won’t have a significant impact on the portfolio but it does diversify my high risk holdings. I had contemplated brining in some emerging market exposure however that would require more fund switches. In addition the level of exposure would still be relatively small so won't have a significant impact.
Fund switch
I will switch 33% of my fund holding in the Man GLG Japan Core Alpha fund into Marlborough Far East Growth.
My new portfolio
My new portfolio will look like this:
| Fund | Allocation | Risk | Sector | ISIN Code | SEDOL Code | Citicode / TIDM |
| 7IM - Unconstrained | 14 | Low | Targeted Absolute Return | GB00B75MS619 | B75MS61 | 0HF3 |
| AXA - Framlington Managed Income | 4 | Low | Sterling Strategic Bond | GB00B6RPX228 | B6RPX22 | 11VN |
| BlackRock - US Dynamic | 17 | Medium | North America | GB00B87XJQ69 | B87XJQ6 | GTZX |
| Cavendish - AIM | 10 | High | UK Smaller Companies | GB00B0JX3X39 | B0JX3X3 | TM91 |
| Cavendish - Technology | 7 | High | Technology & Telecoms | GB00B60SMN24 | B60SMN2 | ETX0 |
| Fidelity - Global High Yield | 14 | Low | Sterling High Yield | GB00B7K7SQ18 | B7K7SQ1 | 0Z51 |
| JOHCM - UK Equity Income | 11 | Medium | UK Equity Income | GB00B03KR831 | B03KR83 | JO98 |
| M&G - Global Dividend | 7 | Medium | Global | GB00B46J9127 | B46J912 | 0ZDY |
| Man GLG - Japan Core Alpha | 6 | High | Japan | GB00B3F46Y30 | B3F46Y3 | DWE6 |
| Marlborough - European Multi-Cap | 7 | High | Europe Excluding UK | GB0001719730 | 171973 | CA33 |
| Marlborough - Far East Growth | 3 | High | Asia Pacific Excluding Japan | GB00B0NVCN62 | B0NVCN6 | RU03 |
My new asset mix
This means my asset mix is now (numbers in brackets represent the old asset mix):
- UK Equities 23% (23%)
- North American Equities 21% (22%)
- Global Fixed Interest 13% (14%)
- Japanese Equities 6% (9%)
- Other International Equities 11% (9%) -which includes 3% Asian equities
- European Equities 7% (7%)
- UK Fixed Interest 5% (5%)
- Cash 5% (4%)
- Alternative Investment Strategies 9% (7%)

£200 Pension Cashback Offer
Make a qualifying deposit or transfer a pension to our partner Interactive Investor.
- Deposit or transfer a pension of at least £20k and you could earn £200 cashback
- Terms and Fees apply, Capital at risk
- New & Existing customers opening a SIPP
- Offer ends 31st July 2026
Before starting your transfer, check you won't lose any valuable benefits (such as guaranteed annuity rates or a lower protected pension age) and find out what exit fees you might have to pay
