

The background to my portfolio
Back in March 2015 I decided to invest £50,000 of my own money using 80-20 Investor. The purpose was two-fold, firstly to show how you can use 80-20 Investor to invest and outperform the market with only a few minutes effort every now and then. Secondly, no other investment commentator, journalist or research provider invests their own money for fear of failing. This is a sorry state of affairs and is precisely why I committed to openly running my own portfolio for 80-20 Investor members to see.
Since then I have periodically changed my portfolio using the fund suggestions provided by the 80-20 Investor algorithm and associated research. I always disclose the changes at the time they are made.
Outperformance
My portfolio has continued to perform extremely well while not taking excessive risks, as currently around 60% of the portfolio is invested in equities. I have produced a double-digit profit despite the various crises we have experienced including a Greek crisis, a Chinese economic slowdown, a commodity crisis, Brexit vote and Donald Trump's surprise election win.
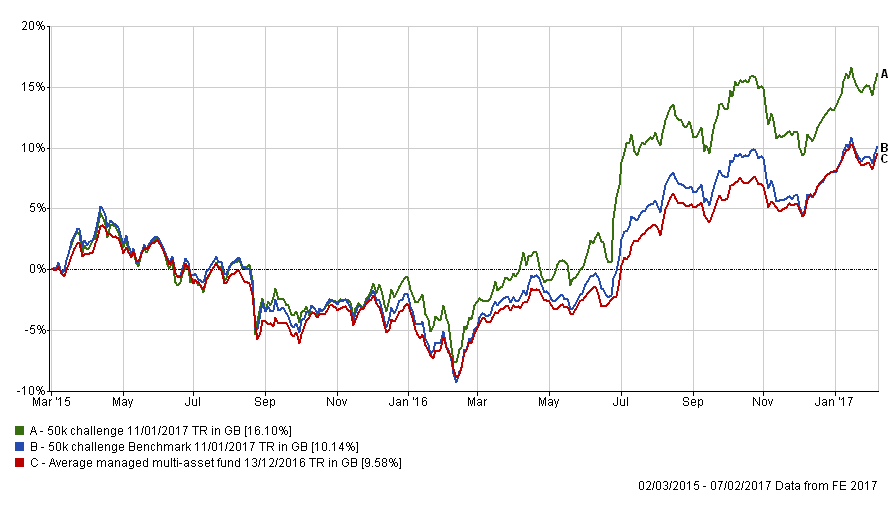
What is pleasing is how my portfolio has responded in recent months following the changes made in the aftermath of the US election. Below you will find two charts. The first one shows how my portfolio has outperformed since I started the challenge in March 2015. The green line is the performance of my portfolio while the blue line is the benchmark showing the average return achieved by professional fund managers given the same asset mix. To accurately calculate this I have used the average return for each sector in which my portfolio invested. The red line shows what the average multi-asset fund with comparable equity content achieved. In other words the blue line would show the extra performance added by just the asset mix of my portfolio (where I was invested i.e European equities etc) over picking a typical multi-asset fund (the red line). While the green line (which is my actual performance) shows the impact of being in the right funds at the right time, as identified by the 80-20 Investor algorithm.
The second chart shows the performance since my post-US election trades. I'm pleased with how I've been able to ride the market uptrend during a difficult period, especially given that not all areas of the portfolio outperformed as mentioned last time. Remember you can't get every trade right, it's about getting more right than you get wrong in the long term.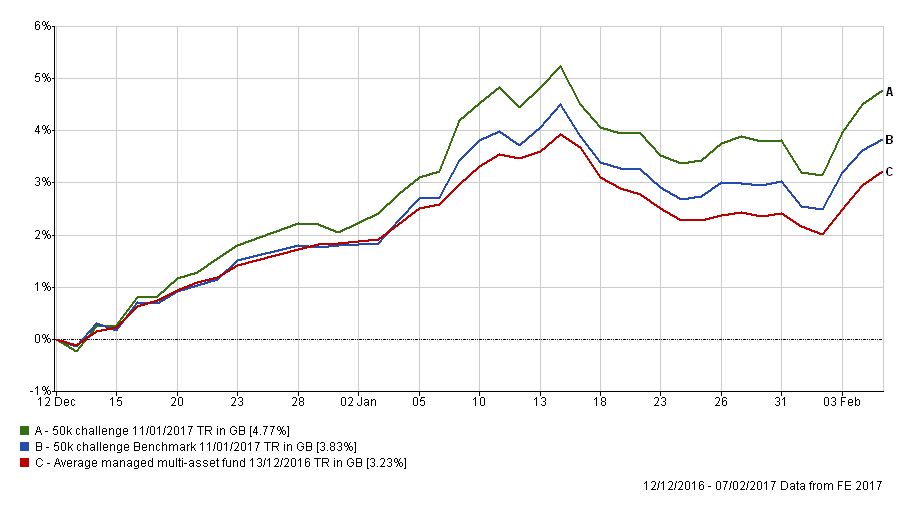
In January I removed all my exposure to emerging markets and Asian equities. In the end January turned out to be a pretty good month for Far Eastern equities as you can see from the latest Growth Heatmap. Fortunately the replacement funds and asset mix tweak meant that the performance of my portfolio wasn't hindered overall. The only real difference is that the portfolio has been slightly sheltered from the worst of Trump's anti-China rhetoric, which is a positive.
Below is my current portfolio with those in green still in the BOTB and while those in yellow are not in the BOTB but remain in the BFBS list. Meanwhile the funds in red have dropped out of both shortlists.
| Name | % Allocation | Risk | Sector | ISIN Code | 1 month return | 6 month return | Max weekly fall in last 6 months | Ongoing charge |
|---|---|---|---|---|---|---|---|---|
| AXA Framlington Managed Income | 9.10% | Low | Sterling Strategic Bond | GB00B6RPX228 | 0.68 | 5.55 | -1.16 | 0.6 |
| BlackRock US Dynamic | 9.30% | Medium | North America | GB00B87XJQ69 | 0.59 | 17.42 | -5.12 | 0.93 |
| Cavendish Aim | 7.60% | High | UK Smaller Companies | GB00B0JX3X39 | 3.06 | 31.61 | -2.96 | 1.6 |
| Fidelity Global High Yield | 10.10% | Low | Sterling High Yield | GB00B7K7SQ18 | 1.5 | 7.14 | -1.44 | 1.03 |
| GAM North American Growth | 4.40% | High | North America | GB0002423852 | -3.31 | 16.17 | -7.06 | 1.58 |
| IFSL Brooks Macdonald Defensive Capital | 14.60% | Low | Targeted Absolute Return | GB00B61MR835 | 0.92 | 6.38 | -1.5 | 0.82 |
| JOHCM UK Equity Income | 8.90% | Medium | UK Equity Income | GB00B03KR831 | 1.05 | 15.89 | -4.05 | 1.31 |
| Man GLG - Japan Core Alpha | 8.50% | High | Japan | GB00B3F46Y30 | 2.77 | 28.15 | -4.01 | 1.65 |
| Marlborough European Multi-Cap | 14.20% | Medium | Europe Excluding UK | GB0001719730 | 4.45 | 19.18 | -6.12 | 1.8 |
| Schroder Global Equity income | 13.40% | Medium | Global | GB00B76V7M69 | -0.09 | 17.11 | -4.47 | 0.95 |
As you can see the portfolio as a whole doesn't need to be revamped in any way as most funds remain in the 80-20 Investor shortlists. If you've been following my commentaries about my £50,000 portfolio for the last two years you will notice that I prefer to prune and tweak and, where possible, limit the changes made. That's because you need to allow some time to ride the unfolding trends. The underlying research baked into the 80-20 Investor algorithm allows for funds to be held for up to six months. That means there is no need to knee-jerk and change funds every month.
That aside, January was a very good month for my portfolio as shown in the chart earlier so you wouldn't expect any drastic changes. So for now it's a case of 'steady as she goes' until the market trends alter. The one exception is the GAM North American fund. The fund's stop loss alert was triggered last month as it fell more than 5% from it's peak as shown in the chart below (green line). By comparison the Blackrock US Dynamic fund's return (orange line) was much more stable. While the GAM fund has recovered somewhat it's still down year to date (-1.77%). Its rebound may continue but there is no way of telling for sure. The GAM fund is a good illustration of how the 80-20 Investor stop loss alerts work.
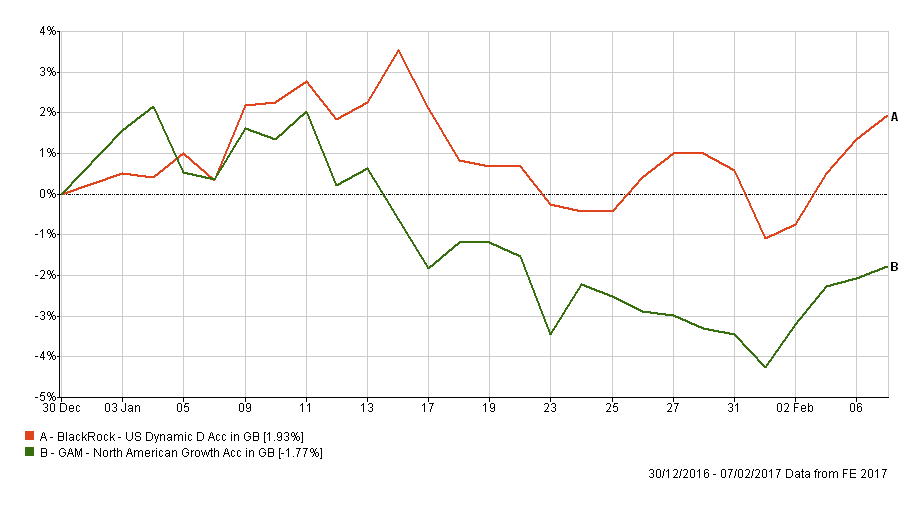
The stop loss on the GAM US fund was triggered because it was 5% below its high point yet wasn’t down 5% overall. In theory a fund could be up 10% and then drop to still be up 5% yet the trailing stop loss would be triggered. An ordinary stop loss only triggers when you hit a 5% loss which is why 80-20 Investor uses trailing stop losses as they are better at potentially protecting profits. On occasions where individual stop losses are triggered I do try and include a chart of price movements in the stop loss alert (as I did for the GAM fund - see here) so people can make a better judgement call on whether they want to switch out or not. The stop loss on the GAM fund was an early sign that perhaps the momentum had turned, and not a signal that the fund was sitting on a 5% loss for the month.
Interestingly the Blackrock US Dynamic fund has moved risk category since last month. It has historically been a high risk fund but has just dropped to medium risk. In February's Chatterbox I was asked the question as to why this would happen. There are two reasons why a fund couple move risk categories 1) the fund manager has consciously taken less investment risk or b) the manager hasn't done anything and it is a reflection of the increased risk other managers are taking.
Again this fund helps illustrate another nuance of 80-20 Investor. When determining a fund's risk level the algorithm takes into account how the manager has achieved his returns over time. What we are trying to do is identify managers' consistency of return and we group them into high, medium and low risk groups accordingly. So two funds within the same sector can have a different 80-20 Investor risk label, which is as it should be because the official Investment Association sector labels are incredibly broad. So if a fund moves down a risk category it is most likely to be a reflection of the increased inconsistency of performance of other managers around them. If you think about it logically, every investment adviser would classify bond funds as low risk investments, which they generally are. However, in the bond sell-off following the US election you were at greatest risk of losing money if you held bond funds instead of equities. It's for this reason that risk categorisation needs to be fluid.
In my last portfolio review I explained how the asset allocation (where you invest) is important, however of greater importance is the actual funds you chose. Yet, interestingly the asset mix of my portfolio contributed to the outperformance in recent weeks (rather than just being in the right funds) as shown by the blue line in the second chart above outperforming the red one (the average multi-asset fund) albeit marginally.
The latest asset mix of the BOTB (as stated above the BOTB tables) is not too dissimilar to that of my £50,000 portfolio below:
- Global fixed interest - 17%
- US equities -19%
- European equities - 14%
- UK equities - 20%
- Japanese equities - 9%
- Cash - 4%
- Property - 0%
- UK Gilts - 0%
- UK Fixed Interest - 3%
- Alternative assets/strategies - 14%
- Asia Emerging Equities - 0%
- Asia Equities ex Japan - 0%
Notice how the cash holding has dropped from 8% to 4% to reflect the fact that managers have put cash to work principally in US and European equities since January.
As I only plan to change the one fund my asset allocation won't match the BOTB's asset mix exactly which I am happy with, as being in the right funds is currently having the greater impact on returns.
Portfolio fund switches
Switch 100% out of the GAM North American Growth and equally into JOHCM UK Equity Income and Cavendish Aim
I've only held the GAM fund for a very short period of time and I'm sure it will make a reappearance in the BOTB soon. However, it's a relatively small holding, making up just 4% of my portfolio. So I plan to switch out of that fund and invest the proceeds equally into the JOHCM UK Equity Income fund and Cavendish AIM. This will bring my UK equity exposure up a touch in line with the BOTB and my US exposure down to just over 14%. It will also have the benefit of bringing the number of funds I hold down to 9. It's an example of backing your winners which will hopefully pay off.
My new portfolio:
My portfolio will now look like this (I have rounded the asset allocation %):
| Fund name | Allocation % | Risk | Sector | ISIN Code | SEDOL Code | Citicode / TIDM |
| AXA Framlington Managed Income | 9.00% | Low | Sterling Strategic Bond | GB00B6RPX228 | B6RPX22 | 11VN |
| Man GLG - Japan Core Alpha | 9.00% | High | Japan | GB00B3F46Y30 | B3F46Y3 | DWE6 |
| Fidelity Global High Yield | 10.00% | Low | Sterling High Yield | GB00B7K7SQ18 | B7K7SQ1 | 0Z51 |
| BlackRock US Dynamic | 9.00% | Medium | North America | GB00B87XJQ69 | B87XJQ6 | GTZX |
| IFSL Brooks MacDonald Defensive Capital | 14.50% | Low | Targeted Absolute Return | GB00B61MR835 | B61MR83 | IIP5 |
| JOHCM UK Equity Income | 11.00% | Medium | UK Equity Income | GB00B03KR831 | B03KR83 | JO98 |
| Cavendish Aim | 10.00% | High | UK Smaller Companies | GB00B0JX3X39 | B0JX3X3 | TM91 |
| Marlborough European Multi-Cap | 14.50% | Medium | Europe Excluding UK | GB0001719730 | 171973 | CA33 |
| Schroder Global Equity income | 13.00% | Medium | Global | GB00B76V7M69 | B76V7M6 | 0HCZ |
My portfolio asset mix
This means my asset mix is now:
- Global fixed interest - 17%
- US equities -14%
- European equities - 15%
- UK equities - 24%
- Japanese equities - 9%
- Cash - 4%
- Property - 0%
- UK Gilts - 0%
- UK Fixed Interest - 3%
- Alternative assets/strategies - 14%
- Asia Emerging Equities - 0%
- Asia Equities ex Japan - 0%

£200 Pension Cashback Offer
Make a qualifying deposit or transfer a pension to our partner Interactive Investor.
- Deposit or transfer a pension of at least £20k and you could earn £200 cashback
- Terms and Fees apply, Capital at risk
- New & Existing customers opening a SIPP
- Offer ends 31st July 2026
Before starting your transfer, check you won't lose any valuable benefits (such as guaranteed annuity rates or a lower protected pension age) and find out what exit fees you might have to pay
