

The background to my portfolio
Two years ago (in March 2015) I decided to invest £50,000 of my own money using 80-20 Investor. The purpose was firstly to show how you can use 80-20 Investor to invest and outperform the market with only a few minutes effort every now and then. I also wanted to prove the value of an 80-20 Investor membership. The biennial membership costs £288 which equates to just £12 a month. As you know 80-20 Investor members receive:
- fund shortlists
- weekly and monthly market commentary and analysis
- research articles on whatever topic they want to help them invest
- tools and heatmaps
- stop loss alerts
That alone is worth the subscription as members regularly tell me. However by investing £50,000 of my own money I wanted to show in pounds and pence that a membership to 80-20 Investor is worth every penny. No other investment commentator, journalist or research provider invests their own money in this way for fear of failing. This is a sorry state of affairs and is precisely why I committed to openly running my own portfolio for 80-20 Investor members to see. It was a bold move particularly as when I invested my money the markets were near all-time highs and everyone was predicting an imminent market crash.
Since I began investing I have periodically changed my portfolio using the fund suggestions provided by the 80-20 Investor algorithm and associated research. I always disclose the changes at the time they are made.
The best £288 you've ever spent?
My portfolio has continued to perform extremely well while not taking excessive risks, typically 50% to 60% of the portfolio is invested in equities. I have produced a profit of 18.83% despite the various crises we have experienced including a Greek crisis, a Chinese economic slowdown, a commodity crisis, Brexit vote and Donald Trump's surprise election win. I have turned my initial £50,000 into £59,365 in just two years.
Coincidentally I made the money back on my initial subscription within weeks of investing my £50,000 portfolio. The table shows how my £50,000 portfolio performed versus a number of benchmarks namely:
- my portfolio's benchmark (calculated by using the average return for each sector in which my portfolio invested)
- the average professionally run multi-asset fund with comparable equity content
- the FTSE 100
- APCIM benchmarks (the equivalent return an investment bank would have made a rich person who could afford their services)
- AFI cautious and AFI balanced (what the typical financial adviser would have made you)
- Vanguard benchmark - what the equivalent passive Vanguard portfolio achieved assuming the same equity content
| Name | 2 yr return % | Sharpe ratio | Volatility |
| 50k challenge | 18.73 | 0.48 | 1.28 |
| Passive Vanguard benchmark (passive strategy) | 15.73 | 0.39 | 1.3 |
| FTSE 100 | 15.28 | 0.2 | 2.14 |
| AFI Balanced (IFA's balanced portfolio) | 14.35 | 0.37 | 1.12 |
| Average managed multi-asset fund (fund manager) | 12.25 | 0.23 | 1.03 |
| AFI Cautious (IFA's cautious portfolio) | 10.57 | 0.22 | n/a |
| ARC Sterling Balanced Asset (Investment bank) | 9.33 | 0.01 | n.a |
The takeaway from the above table is that without taking undue risk (shown by the volatility figure) my £50,000 portfolio achieved the best return. However the extra investment risk taken was rewarded by an increased return when compared to other strategies. In simple terms when I increased the investment risk I made more money than when the other strategies increased the level of risk they were taking (illustrated by my portfolio having the highest sharpe ratio).
Profit from a 2 year 80-20 Investor membership
The table below shows how much profit (net of the 80-20 investor membership fee) I would have made using 80-20 Investor vs the other strategies for different sums invested. Don't forget that the 80-20 Investor membership is a fixed price so does not increase just because your portfolio size has. All figures are net of fund fees and the cost of the biennial 80-20 Investor membership.
| Amount invested | |||||
| £20,000 | £50,000 | £75,000 | £100,000 | £250,000 | |
| £50k challenge overall profit | £3,458 | £9,077 | £13,760 | £18,442 | £46,537 |
| extra profit over a Passive Vanguard benchmark | £312 | £1,212 | £1,962 | £2,712 | £7,212 |
| extra profit over the FTSE 100 | £402 | £1,437 | £2,300 | £3,162 | £8,337 |
| extra profit over a balanced IFA portfolio (AFI Balanced Index) | £588 | £1,902 | £2,997 | £4,092 | £10,662 |
| extra profit over an Average managed multi-asset fund | £1,008 | £2,952 | £4,572 | £6,192 | £15,912 |
| extra profit over a cautious IFA portfolio (AFI Cautious Index) | £1,344 | £3,792 | £5,832 | £7,872 | £20,112 |
| extra profit over an Investment Bank Discretionary Portfolio (ARC Sterling Balanced Asset Index) | £1,592 | £4,412 | £6,762 | £9,112 | £23,212 |
The other thing to bear in mind is that IFAs will typically charge you an extra 0.75% to 1% of your portfolio size each year to run your money which the above figures do not take into account. So their performance is overstated. In addition not only did the passive strategy have a higher volatility but it also had larger drawdowns (falls) than my portfolio.
So after two years of running my portfolio I am obviously delighted with the result. At the start of the exercise the market was near multi-year highs with most analysts predicting a stock market crash. I had no idea what the future held and which asset mix or strategy would outperform. However by applying a process I was able to outperform the market. Of course with the benefit of hindsight there are some funds or strategies that will have outperformed my portfolio. However there are two key points to bear in mind:
- you can not invest with hindsight
- my portfolio is constrained to make it balanced - you are not constrained in this way.
The second point is important. There are a number of you that have outperformed my portfolio using 80-20 Investor by choosing to take additional or less risk at certain times. 80-20 Investor excels at helping you pick the right funds to invest in given your own tactical preferences. If you were bold enough to take more risk at certain times, which was rewarded, then the 80-20 Investor fund shortlists would have amplified those returns. All the other strategies in the above table are not flexible and only offer 'one size that fits all' and therefore only one possible outcome.
Portfolio changes
The two year anniversary of my portfolio is a nice distraction however I am continuing to run my portfolio regardless. The table below shows my current portfolio. The funds in green are still in the BOTB while those in yellow are not in the BOTB but remain in the BFBS list. The funds in red have dropped out of both shortlists.
As you can see the portfolio as a whole doesn't need to be overhauled as most funds remain in the 80-20 Investor shortlists. There are of course two exceptions namely the Schroder Global Equity income fund and IFSL Brooks Macdonald Defensive Capital. The latter has served the portfolio well, having been a mainstay for a number of months.
However if you look at my analysis of March's BOTB portfolio there has been a shift in the asset mix away from Europe and more towards the US and technology stocks. Just for ease here is the asset mix of the current BOTB with the number in brackets representing the previous month's asset mix.
- Global Fixed Interest 12% (12%)
- Alternatives 11% (10%) - mostly absolute return strategies
- UK Corporate Fixed Interest (i.e UK bonds) 2% (2%)
- North American Equities 22% (12%)
- European Equities 7% (9%)
- Japanese Equities 11% (11%)
- Property 0% (0%)
- UK Equities 18% (24%)
- Cash 4% (8%)
- Asian equities 0% (0%)
- Asia Pacific Emerging equities 0% (0%)
- Other international equities 13% (12%) which includes Asian equities
At present my £50k portfolio's asset mix is:
- Global fixed interest - 17%
- US equities -14%
- European equities - 15%
- UK equities - 24%
- Japanese equities - 9%
- Cash - 4%
- Property - 0%
- UK Gilts - 0%
- UK Fixed Interest - 3%
- Alternative assets/strategies - 14%
- Asia Emerging Equities - 0%
- Asia Equities ex Japan - 0%
The asset mix is similar to that of the BOTB although I have more exposure to European equities while being underweight US equities. If you've been following my commentaries about my £50,000 portfolio for the last two years you will notice that I prefer to prune and tweak and, where possible, limit the changes made. That's because you need to allow some time to ride the unfolding trends. The underlying research baked into the 80-20 Investor algorithm allows for funds to be held for up to six months. That means there is no need to knee-jerk and change funds every month.
I plan to reduce my European exposure, especially as it has since moved into the high risk category and has seen its momentum reduce in recent months due to political risks (as shown in the latest Heatmap). The Marlborough European Multi-Cap has been in my portfolio for the last 8 months and has proved hugely profitable. The chart below shows the fund's return (green line) vs the average European equity fund (the red line) since I've held it. Click on the image to enlarge it:

I will take some profit and reduce my holding by 50% to bring it more in line with the BOTB selection. This also seems prudent given the uncertainty surrounding the upcoming French election and the impending triggering of article 50. While US equities are looking expensive versus their European counterparts the political risks in Europe are dampening returns for now. I expect this trend to reverse later in the year should the concerns over the French Presidential election prove unfounded. For now the beneficiary of my change will be US equities.
As I've mentioned one of the funds to drop out of the 80-20 Investor fund shortlists is IFSL Brooks Macdonald Defensive Capital. I have held this fund since the 10th October 2016. The fund has also been a fantastic low risk performer as shown by the chart below where I compare its performance (the green line) versus its sector average (red line) as well as other low risk alternatives such as UK bonds (blue line) and global bonds (orange line).
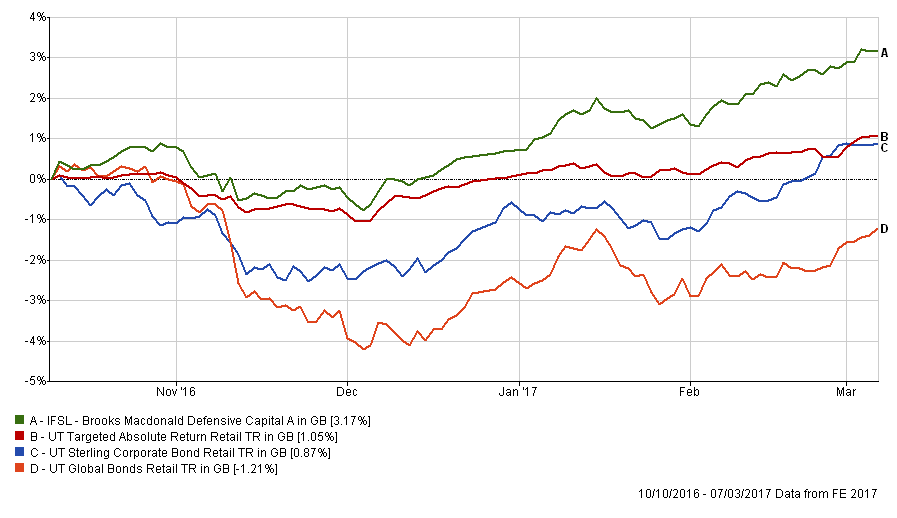
You can see that the fund barely lost money in the aftermath of the US election and the subsequent bond market sell-off. It then rose steadily to date. However, it has dropped out of the BOTB and BFBS, albeit only just, being replaced by those funds taking a bit more investment risk. Emotionally ditching a fund that has performed well is always tough but with emotion comes complacency. I have no doubt that the fund will return to the 80-20 Investor shortlists but for now it's time to try something new.
The Schroder Global Equity Income fund was only a new entrant into my portfolio last month and as the chart below shows it performed in line with its peers but has done nothing spectacular. Perhaps it's not surprising that it has now dropped out of the 80-20 Investor shortlists. Given its significant allocation in my portfolio better opportunities lie elsewhere.

One of the funds within my portfolio that did not make this month's BOTB was the AXA Framlington Managed Income. It remains a good fund and sits in the BFBS tables for its respective sector. However I plan to reduce my UK Fixed Interest exposure more in line with that of the BOTB. In addition UK fixed interest exposure could prove problematic if Theresa May does trigger article 50 and the pound sinks further, pushing up inflation. However, it's a tricky web to untangle and I have no strong conviction as to how bond prices will react.
The JOHCM UK Equity Income fund also dropped out of the BOTB this month but remains in the BFBS tables. So I see no reason just yet to remove it given its consistency of performance and my desire to maintain my UK equity exposure. In addition it helps diversify my UK equity content by not leaving me too exposed to the small cap focused Cavendish Aim fund.
Portfolio fund switches
Switch 100% out of IFSL Brooks Macdonald Defensive Capital and into 7IM Unconstrained
This is a like for like switch into another absolute return fund in order to avoid overexposure to bonds. In the current environment bonds still face a number of headwinds including a widely tipped interest rate hike in the US.
Switch 100% out of Schroder Global Equity Income and split it equally between Cavendish Technology and M&G Global Dividend
Last month I dwelled on whether to invest in a technology fund directly and (as I explained in Chatterbox) I decided to wait to see if the trend became more entrenched this month. I am somewhat regretting that decision given that the Cavendish Technology fund rose 5.49% versus 1.49% for the Cavendish Aim fund I backed. Well done to those of you who took the plunge. So true to my word I am now investing in the Cavendish fund in line with the BOTB overall technology exposure. Let's hope I've not missed the boat. That concern is precisely why I am investing in the Cavendish Technology fund, over the other technology funds in the BOTB, because of its lower max weekly fall figure. Hopefully it will mean that if markets stumble it may fare better than its peers. The other positive is that the fund retained it's position in this month's BOTB.
The balance of the Schroder Global Equity Income fund proceeds will be invested in the M&G Global Dividend fund. I favoured this fund over the other global / global equity income funds in the BOTB because a) it does not have a bid/offer spread (which Artemis Global Income does) b) it has shown strong consistent performance which has resulted in it retaining its BOTB position this month and c) it is cheaper.
Switch 50% out of Marlborough European Multi-Cap and 100% into Blackrock US Dynamic
I have already explained my reasons for reducing my exposure to the Marlborough fund in favour of US equities. I am simply backing a winner that I already hold in the Blackrock US Dynamic fund. There is a negligible bid/offer spread (around 0.2%) on the fund but I am happy to pay it given the strong profits the fund has already made for me.
Switch 50% out of AXA Framlington Managed Income and 100% into Fidelity Global High Yield
I have reduced my exposure to the AXA fund in favour of Fidelity Global High Yield bond. This allows me to maintain a similar bond exposure to that of the BOTB, which is around 20% of the portfolio which is mostly global. The Fidelity fund has performed strongly. A few of you previously got in touch to say that Hargreaves Lansdown does not have Fidelity Global High Yield on their platform which is surprising. My portfolio is currently on Fidelity's platform for legacy reasons. If I had been using Hargreaves I would invest in an alternative from the BOTB list within the same sector, namely AXA Global High Income. The two funds' returns have mostly mirrored each other.
Switch Timings
The switches mean that approximately 40% of my portfolio will be out of the market while the transactions go through. I am happy to take the associated risk markets may move against me for two reason. Firstly markets have been somewhat becalmed in recent days (although this could be famous last words) but more importantly the Federal Reserve will announce their interest rate decision next week which will likely move markets one way or another. There is the impending announcement by the ECB which it is hoped will pass with little consequence. So I am aiming to have the transactions completed ahead of the Federal Reserve meeting on March 14th-15th.
My new portfolio:
My portfolio will now look like this and now contains 10 funds (I have rounded the asset allocation %):
| Fund | Allocation | Risk | Sector | ISIN Code | SEDOL Code | Citicode / TIDM |
| 7IM - Unconstrained | 14 | Low | Targeted Absolute Return | GB00B75MS619 | B75MS61 | 0HF3 |
| Marlborough - European Multi-Cap | 7 | High | Europe Excluding UK | GB0001719730 | 171973 | CA33 |
| M&G - Global Dividend | 7 | Medium | Global | GB00B46J9127 | B46J912 | 0ZDY |
| Man GLG - Japan Core Alpha | 9 | High | Japan | GB00B3F46Y30 | B3F46Y3 | DWE6 |
| BlackRock - US Dynamic | 17 | Medium | North America | GB00B87XJQ69 | B87XJQ6 | GTZX |
| AXA - Framlington Managed Income | 4 | Low | Sterling Strategic Bond | GB00B6RPX228 | B6RPX22 | 11VN |
| Fidelity - Global High Yield | 14 | Low | Sterling High Yield | GB00B7K7SQ18 | B7K7SQ1 | 0Z51 |
| Cavendish - Technology | 7 | High | Technology & Telecoms | GB00B60SMN24 | B60SMN2 | ETX0 |
| JOHCM - UK Equity Income | 11 | Medium | UK Equity Income | GB00B03KR831 | B03KR83 | JO98 |
| Cavendish - AIM | 10 | High | UK Smaller Companies | GB00B0JX3X39 | B0JX3X3 | TM91 |
My portfolio asset mix
This means my asset mix is now (numbers in brackets represent the old asset mix):
- UK Equities 23% (24%)
- North American Equities 22% (14%)
- Global Fixed Interest 14% (17%)
- Japanese Equities 9% (9%)
- Other International Equities 9% (0%)
- European Equities 7% (15%)
- UK Fixed Interest 5% (3%)
- Cash 4% (4%)
- Alternative Investment Strategies 7% (14%)

£200 Pension Cashback Offer
Make a qualifying deposit or transfer a pension to our partner Interactive Investor.
- Deposit or transfer a pension of at least £20k and you could earn £200 cashback
- Terms and Fees apply, Capital at risk
- New & Existing customers opening a SIPP
- Offer ends 31st July 2026
Before starting your transfer, check you won't lose any valuable benefits (such as guaranteed annuity rates or a lower protected pension age) and find out what exit fees you might have to pay
