

The background to my portfolio
Back in March 2015 I decided to invest £50,000 of my own money using 80-20 Investor. The purpose was twofold, firstly to show how you can use 80-20 Investor to invest and outperform the market with only a few minutes effort every now and then. Secondly, no other investment commentator, journalist or research provider invests their own money for fear of failing. This is a sorry state of affairs and is precisely why I committed to openly running my own portfolio for 80-20 Investor members to see.
Since then I have periodically changed my portfolio using the fund suggestions provided by the 80-20 Investor algorithm and associated research. I always disclose the changes at the time they are made.
Performance update
My portfolio has continued to perform extremely well while not taking excessive risks, typically around 50-60% equities. At present it has approximately 70% of the portfolio invested in equities which is the highest level for quite some time. I have produced over 20% profit despite the various crises we have experienced including a Greek crisis, a Chinese economic slowdown, a commodity crisis, Brexit vote and Donald Trump's surprise election win.
The chart below shows how my portfolio has outperformed since I started the challenge in March 2015. The green line is the performance of my portfolio while the blue line is the benchmark showing the average return achieved by professional fund managers given the same asset mix. To accurately calculate this I have used the average return for each sector in which my portfolio invested. The red line shows what the average multi-asset fund with comparable equity content achieved. In other words the blue line would show the extra performance added by just the asset mix of my portfolio (where I was invested i.e European equities etc) over picking a typical multi-asset fund (the red line). While the green line (which is my actual performance) shows the impact of being in the right funds at the right time, as identified by the 80-20 Investor algorithm.
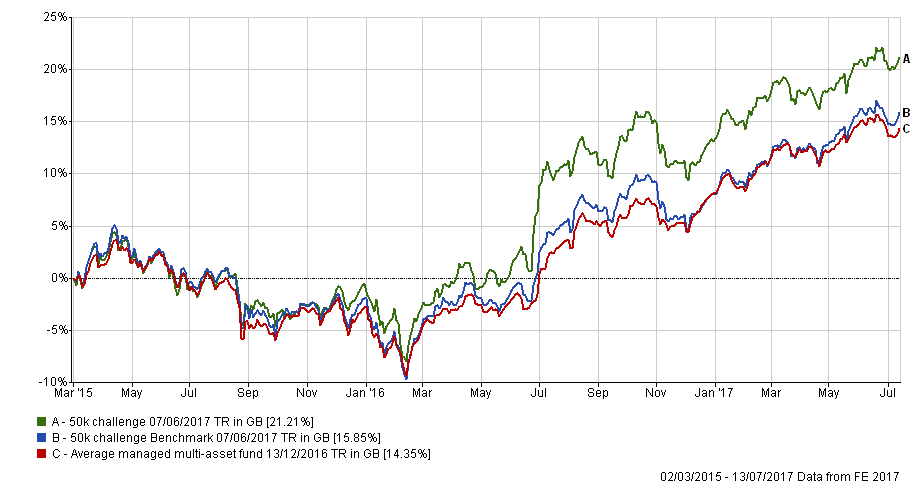
As you can see from the chart above my portfolio has continued to ride the market momentum and has continued to set its own all-time highs. At the time of writing the portfolio is up 21.28% in little over two years. Obviously I am very pleased with that result especially when compared to the aforementioned benchmarks.
June was a very tricky month for investors as I explained in July's monthly newsletter. So I was pleased to see how my portfolio fared since my last portfolio review at the start of June. The chart below shows my portfolio (in green) versus the key benchmarks. Of course it didn't avoid the bond market rout and technology sell-offs but the portfolio barely dipped into negative territory before recovering.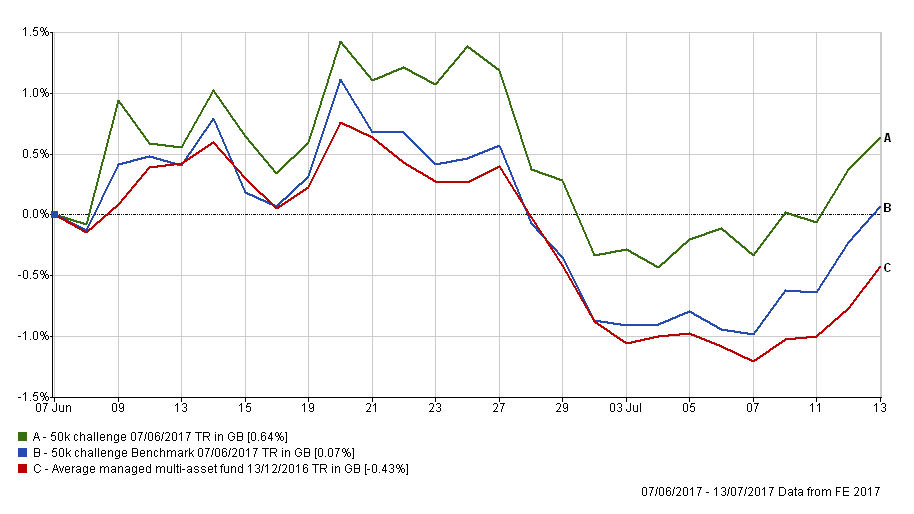
The one change that I made last time was to replace Blackrock US Dynamic with the Baillie Gifford American fund. The chart shows how the two funds have performed since I made the change. The Baillie Gifford fund which I currently hold is in blue.
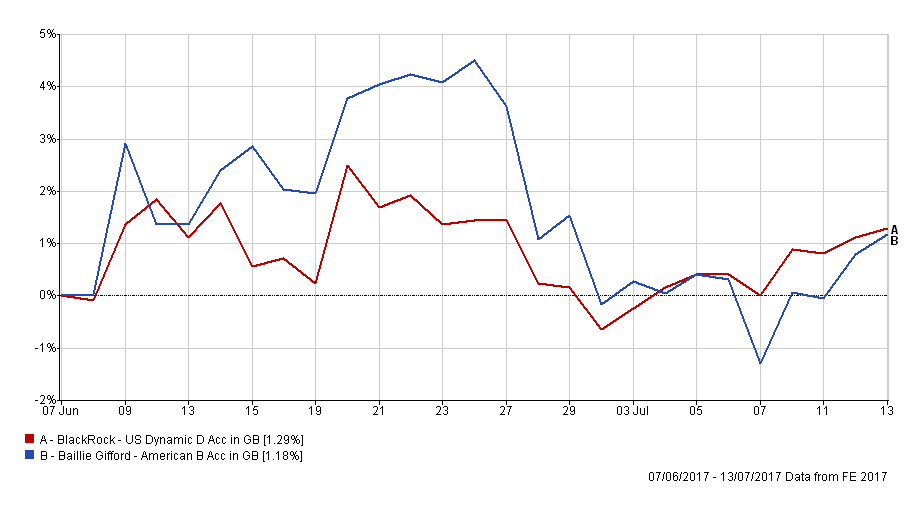
Until the last week of June the new fund was absolutely flying, helping to propel my portfolio to new highs. Then when global central banks appeared to start coordinating the potential removal of their monetary stimulus stock markets reacted badly. The Baillie Gifford fund took a bit of a blow and this is partly due to its high technology exposure (which accounts for 25% of its assets). Right now technology stocks are particularly sensitive to bouts of profit taking when an excuse arises. There is a certain irony that I picked the fund due to its low max fall figure, when compared to the Blackrock fund, but there really is no legislating for such huge macro changes. Ultimately the Baillie Gifford fund recovered to finish where its predecessor, Blackrock US Dynamic, did.
The table below shows my current portfolio, with those funds in green still in the BOTB while those in yellow are not in the BOTB but remain in the BFBS list. Meanwhile the funds in red have dropped out of both shortlists.
| Name | Allocation % | Risk | Sector | ISIN Code | SEDOL Code | Citicode / TIDM | Sector |
| AXA - Framlington Managed Income | 4.5 | Low | Sterling Strategic Bond | GB00B6RPX228 | B6RPX22 | 11VN | Sterling Strategic Bond |
| Baillie Gifford - Pacific | 3.0 | High | Asia Pacific Excluding Japan Ret | GB0006063233 | 606323 | BE80 | Asia Pacific Excluding Japan Ret |
| Baillie Gifford American | 16.0 | Medium | North America | GB0006061963 | 0606196 | BQ69 | North America |
| Fidelity - Global High Yield | 14.25 | Low | Sterling High Yield | GB00B7K7SQ18 | B7K7SQ1 | 0Z51 | Sterling High Yield |
| Marlborough - European Multi-Cap | 16.0 | High | Europe Excluding UK | GB0001719730 | 171973 | CA33 | Europe Excluding UK |
| Premier - Diversified | 15.5 | Low | Mixed Investment 40%-85% Shares | GB00B8BJV423 | B8BJV42 | GH6F | Mixed Investment 40%-85% Shares |
| Schroder - UK Dynamic Smaller Companies | 10.5 | High | UK Smaller Companies | GB0007220360 | 722036 | KR20 | UK Smaller Companies |
| TM - Cavendish Technology | 8.0 | High | Technology & Telecommunications | GB00B60SMN24 | B60SMN2 | ETX0 | Technology & Telecommunications |
| Wise Investments - TB Wise Income | 12.25 | Medium | Flexible Investment | GB00B0LJ0160 | B0LJ016 | TJ63 | Flexible Investment |
When reviewing this month's portfolio it has been particularly difficult for a number of reasons. Firstly we've seen markets, particularly in the US hitting all-time highs once again. While you can't time the market it is more preferable to make changes in a falling market because any time you spend in limbo, while the transaction completes, insulates you from a market fall. In a rising market a fund switch can cost you money in terms of lost profits.
Looking at the table above the two funds that stand out to be replaced are Fidelity Global High Yield and AXA Framlington Managed Income as they are no longer in any 80-20 Investor shortlist. These two funds make up a significant chunk of my low risk exposure and in a market where bonds have recently had a tough time I am quite happy to make a change now. Both of these funds have been brilliant performers but have flatlined in the last month or two. Therefore any time out of the market during the transaction is likely to have minimal negative impact on my portfolio, and perhaps arguably just as likely to be positive should bonds have another wobble.
I spent much time procrastinating over this change. For starters my previous research piece on the bonds for a bond bear market highlighted Fidelity Global High Yield as a good choice. It's partly why the fund originally made it into my portfolio. In addition when looking at a number of low risk alternatives in the BOTB and BFBS tables it became apparent that a number either weren't available on my platform (true of the absolute return funds I was considering) or had introduced wide bid/offer spreads, presumably a result of investors selling out in the recent bond-rout. With bond returns so low at present paying any kind of bid/offer spread is not worth it. In any case, as a general rule I avoid funds that are not single priced unless the bid/offer spread is tiny.
Being left to focus on bond funds as replacements I paid more attention than usual to the 1 month return figures in the 80-20 Investor fund tables. In the last month we experienced a minor tantrum in the bond market as investors rushed for the exit, spooked by the keenness of central banks to talk about raising interest rates. Therefore to switch out of a fund such as Fidelity Global High Yield, that's shown the ability to cope in a bond market slump, I was looking for any sign that its replacements might cope too.
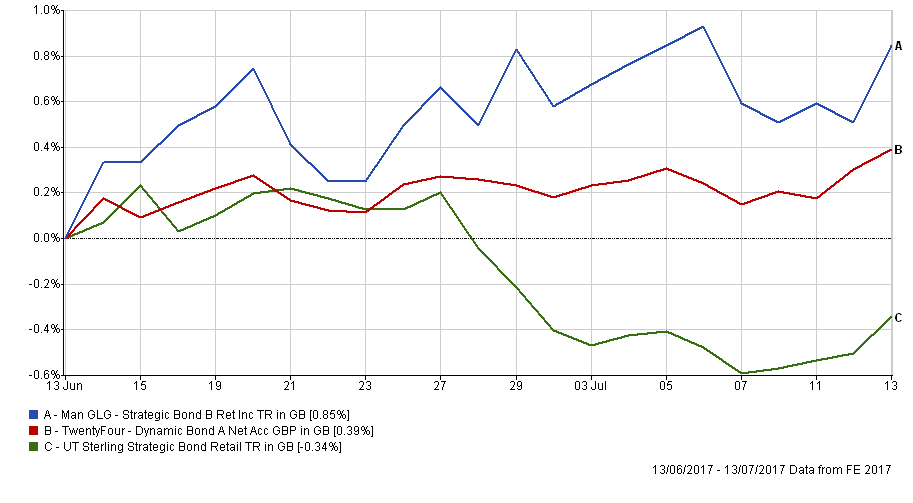
For that reason I settled for two strategic bond funds, namely TwentyFour Dynamic Bond (which is in the BFBS tables for the strategic bond sector) and Man GLG Strategic Bond (which is in the BOTB) to replace my existing two low risk funds highlighted in red above. Theoretically strategic bonds are supposed to manage bond exposure in a nimble and flexible manner which should help them fare better in a bond market sell-off. Unfortunately the reality is often different. However, as the chart below shows both these funds coped well with the recent bond market wobble compared to their peers (the green line). The TwentyFour Dynamic Bond fund should be no stranger to some of you as it has previously featured regularly featured in the BOTB. But right now it has a combination of pricing, momentum and short term (1 month) performance.
Elsewhere in the portfolio there was no compelling need for drastic changes. it's good to see both the Schroder UK Dynamic Smaller Companies and Premier Diversified bounce back in the 80-20 Investor shortlists. At present US equities still form a significant part of my portfolio (around 19%) which contrasts with the latest BOTB asset mix. However with US equities continuing to set new all-time highs as I type I will look to review the percentage equity exposure perhaps at the start of next month because I'm loathed to spend too much time out of a rising market.
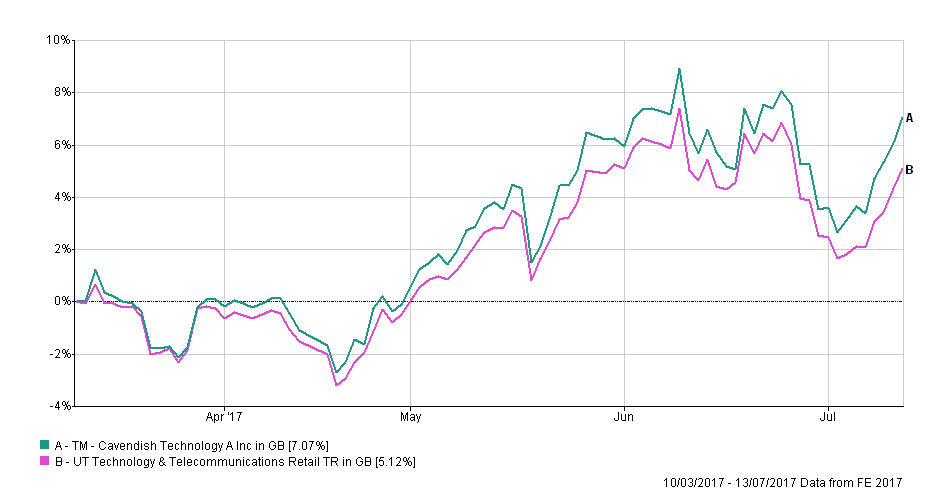
Having said that I have decided to switch out of Cavendish Technology which has performed brilliantly in the four months that I've held it. Up over 7% is an incredible result. The chart below shows the performance versus its sector average. Technology was clearly a good place to be. However there was a big dip in the recent tech sell-off which we've rebounded from.
The reason for the switch is two-fold 1) the sector and fund have disappeared out of the BOTB completely (although it remains in the BFBS) and 2) for diversification. As mentioned earlier, I still have some technology exposure via the Baillie Gifford American fund. So in effect I'm taking some chips off the table and investing those profits into other areas. That's not to say that technology stocks won't go higher but there are arguably better opportunities elsewhere. As such I plan to split the proceeds between two high risk funds in the BOTB, namely Baillie Gifford Greater China and Baillie Gifford Emerging Markets Growth. By doing so it will be a rare appearance for emerging markets in my portfolio but they have been increasingly gaining traction, as have Chinese equities, in the BOTB. This is in part due to the weakening value of the dollar. It's a bold move but hopefully it will prove profitable. Overall this leaves my portfolio perhaps the most diversified it has ever been, certainly in terms of equities.
Fund switches
- 100% out of Cavendish Technology and 50% into Baillie Gifford Emerging Markets Growth & 50% into Baillie Gifford Greater China
- 100% out of AXA Framlington Managed Income and 100% into Man GLG Strategic Bond
- 100% out of Fidelity Global High Yield and 50% into Man GLG Strategic Bond and 50% into TwentyFour Dynamic Bond
My new portfolio
My new portfolio will look like this:
| Name | Allocation % | Risk | Sector | ISIN Code | SEDOL Code | Citicode / TIDM |
| Baillie Gifford - American | 16 | High | North America | GB0006061963 | 606196 | BQ69 |
| Baillie Gifford - Emerging Markets Growth | 4 | High | Global Emerging Markets | GB0006020647 | 602064 | BG89 |
| Baillie Gifford - Greater China | 4 | High | China/Greater China | GB00B39RMM81 | B39RMM8 | CSF5 |
| Baillie Gifford - Pacific | 3 | High | Asia Pacific Excluding Japan | GB0006063233 | 606323 | BE80 |
| Man GLG - Strategic Bond | 12 | Low | Sterling Strategic Bond | GB00B731HR48 | B731HR4 | 0K5P |
| Marlborough - European Multi-Cap | 16 | High | Europe Excluding UK | GB0001719730 | 171973 | CA33 |
| Premier - Diversified | 16 | Low | Mixed Investment 40-85% Shares R | GB00B8BJV423 | B8BJV42 | GH6F |
| Schroder - UK Dynamic Smaller Companies | 10 | Medium | UK Smaller Companies | GB0007220360 | 722036 | KR20 |
| TwentyFour - Dynamic Bond | 7 | Low | Sterling Strategic Bond | GB00B5KPRZ34 | B5KPRZ3 | JZU3 |
| Wise Funds Limited - TB Wise Income | 12 | Medium | Flexible Investment | GB00B0LJ0160 | B0LJ016 | TJ63 |
My new asset mix
This means my asset mix is (previous asset mix is in brackets):
- UK Equities 18% (19%)
- North American Equities 19% (19%)
- Global Fixed Interest 13% (12%)
- Japanese Equities 0% (0%)
- Other International Equities 0% (15%)
- Asian equities 3% (3%)
- European Equities 13% (13%)
- UK Fixed Interest 6% (6%)
- Cash 6% (4%)
- Alternative Investment Strategies 13% (9%)
- Emerging Asia equities 9% (0%)

£200 Pension Cashback Offer
Make a qualifying deposit or transfer a pension to our partner Interactive Investor.
- Deposit or transfer a pension of at least £20k and you could earn £200 cashback
- Terms and Fees apply, Capital at risk
- New & Existing customers opening a SIPP
- Offer ends 31st July 2026
Before starting your transfer, check you won't lose any valuable benefits (such as guaranteed annuity rates or a lower protected pension age) and find out what exit fees you might have to pay
