

The background to my portfolio
Back in March 2015 I decided to invest £50,000 of my own money using 80-20 Investor. The purpose was two-fold, firstly to show how you can use 80-20 Investor to invest and outperform the market with only a few minutes effort every now and then. Secondly, no other investment commentator, journalist or research provider invests their own money for fear of failing. This is a sorry state of affairs and is precisely why I committed to openly running my own portfolio for 80-20 Investor members to see.
Since then I have periodically changed my portfolio using the fund suggestions provided by the 80-20 Investor algorithm and associated research. I always disclose the changes at the time they are made.
Performance roundup: Still well ahead
My portfolio has continued to perform extremely well while not taking excessive risks, as currently only around 50% of the portfolio is invested in equities. I have produced a double-digit profit despite the various crises we have experienced including a Greek crisis, a Chinese economic slowdown, a commodity crisis, Brexit vote and now Donald Trump's surprise election win.
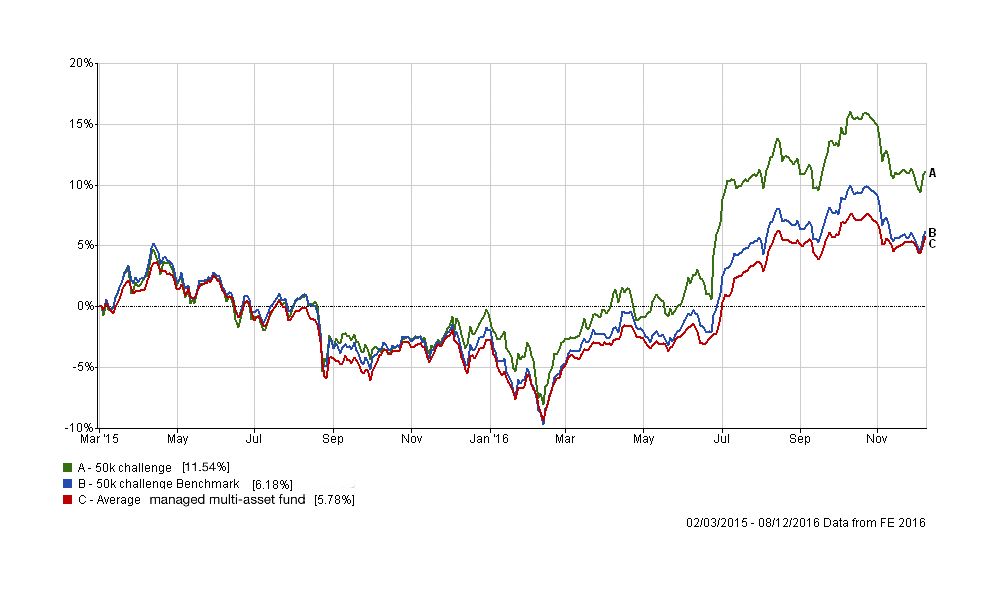
The chart below shows how my portfolio has outperformed since I started the challenge in March 2015. The green line is the performance of my portfolio while the blue line is the benchmark showing the average return achieved by professional fund managers given the same asset mix. To accurately calculate this I have used the average return for each sector in which my portfolio invested. The red line shows what the average multi asset fund with comparable equity content achieved. In other words the blue line shows the extra performance added by the asset mix of my portfolio (where I was invested i.e European equities etc) over picking a typical multi-asset fund (the red line). While the green line (which is my actual performance) shows the impact of being in the right funds at the right time, as identified by the 80-20 Investor algorithm.
The chart demonstrates that asset allocation (where you invest) is important, however of greater importance is the actual funds you chose. Having said that, what is interesting is the benefit that just the asset allocation has provided to my portfolio has shrunk over the past month, which is indicative of my portfolio's slight underweight in US equities and more significant global bond exposure. Since Donald Trump won the election the Trump trade has favoured the former while penalising the latter.
Looking into this period in more detail, the chart below highlights that where you invested (the asset mix) has had an unusually high impact on investor returns since Trump won the US election exactly one month ago. In summary, bonds have been a bad place to be (unless they are short dated) while developed world equities (especially in the US) has been the sweet spot.
| Name | % return since US election |
| North American Smaller Companies | 10.77 |
| North America | 4.99 |
| UK Smaller Companies | 4.37 |
| UK All Companies | 2.58 |
| UK Equity Income | 1.91 |
| Japan | 1.69 |
| Global | 1.49 |
| Global Equity Income | 0.89 |
| Flexible Investment | 0.57 |
| Mixed Investment 40%-85% Shares | 0.52 |
| Sterling High Yield | 0.51 |
| UK Equity & Bond Income | 0.44 |
| Mixed Investment 20%-60% Shares | 0.13 |
| Property | 0.12 |
| Cash | 0.01 |
| Targeted Absolute Return | -0.1 |
| Technology & Telecoms | -0.12 |
| Europe Including UK | -0.17 |
| Mixed Investment 0%-35% Shares | -0.39 |
| Sterling Strategic Bond | -0.48 |
| Europe Excluding UK | -0.49 |
| Sterling Corporate Bond | -0.66 |
| Asia Pacific Excluding Japan | -1.12 |
| UK Gilts | -1.16 |
| European Smaller Companies | -1.18 |
| China/Greater China | -1.74 |
| UK Index - Linked Gilts | -1.98 |
| Asia Pacific Including Japan | -2.07 |
| Global Bonds | -2.85 |
| Global Emerging Markets | -3.28 |
| Japanese Smaller Companies | -4.98 |
| Global Emerging Market Bond | -5.51 |
Portfolio changes
As you know I tend to track my £50,000 portfolio's asset allocation alongside that of the Best of the Best Selection (BOTB). Taking into account the December update of the BOTB as well as the chart above it would suggest that my portfolio could benefit from a reduction in exposure to global bonds (as UK investors have been hit twice by the strengthening pound and falling bond prices in the last month 6 weeks). In addition, increasing my exposure to US equities from the current 6% towards 10%+ would bring it more in line with the current BOTB asset mix. While the Trump trade may fade, and my sense is that it will, I am humble enough to follow a trend and move my portfolio back to a more neutral stance with regard to both US equities and global bonds. I'm not betting the house on the fact that the Trump trade will continue but I don't want to be betting against it either.
With the European Central Bank appearing to start the ball rolling on tapering its monetary stimulus (despite it stating emphatically that it wasn't) and the US Federal Reserve predicted to raise interest rates this week there are more potential headwinds for bonds.
So bearing that in mind how do I plan to reflect this in my portfolio? The table below summarises the funds within my £50,000 portfolio. Funds in green are still in the Best of the Best Selection (BOTB), funds in orange have dropped out of the BOTB but remain in the Best Funds by Sector (BFBS) tables while the red funds have dropped off both shortlists entirely.
| Name | % Allocation | Risk | Sector | ISIN Code |
| AXA - Framlington Managed Income | 8.81 | Low | Sterling Strategic Bond | GB00B6RPX228 |
| Baillie Gifford - Japanese | 8.61 | High | Japan | GB0006010838 |
| BlackRock - Overseas Corporate Bond Tracker | 19.8 | Medium | Global Bonds | GB00B58YKH53 |
| Franklin - UK Equity Income | 8.63 | Medium | UK Equity Income | GB00B7DRD638 |
| Henderson - China Opportunities | 8.02 | High | China/Greater China | GB0031860934 |
| IFSL - Brooks Macdonald Defensive Capital | 8.61 | Low | Targeted Absolute Return | GB00B61MR835 |
| Invesco Perpetual - Asian | 4.42 | High | Asia Pacific Excluding Japan | GB00B8N44Q86 |
| Marlborough - European Multi-Cap | 13.85 | Medium | Europe Excluding UK | GB0001719730 |
| Threadneedle - Dynamic Real Return | 5.9 | Low | Targeted Absolute Return | GB00BWWC6P48 |
| Vanguard - LifeStrategy 80% Equity | 13.35 | Medium | Mixed Investment 40%-85% Shares | GB00B4PQW151 |
On the face of it there isn't a need for any radical changes. As discussed in last week's newsletter the market rally in equities is still in play for now. Ideally I would switch the UK equity fund in red for an alternative from the UK (picked either from the BOTB or the BFBS tables). Similarly I would sell around 48% of my BlackRock Overseas Corporate Bond Tracker to bring my global fixed interest down from 24% to 15% more in line with the current BOTB. I might also look to move out of the Vanguard fund (also in red). When reducing my global bond exposure rather than reinvest in other bond funds I'd have probably split the proceeds from the sale of part of my Blackrock holding between the two targeted return funds I already hold and then looked to gain more US exposure from any change to the Vanguard holding. However, I said I would have because I'm not going to...
Switching on 'triple witching'
The trouble is that markets are moving at quite a pace at the moment and a day or two out of the equity markets, especially if a Santa rally pushes equities higher, is not ideal. On top of that by the time any trades go through there are only between 10-12 trading days left this month, given the Christmas holiday. The other big issue is something called triple witching (make sure you read my note from this time last year which explains what it is). The upshot is that at the end of this week don't be surprised to see a spike in volatility and it's always best to avoid these days when switching funds. Now is not really a great time to be making lots of fund switches.
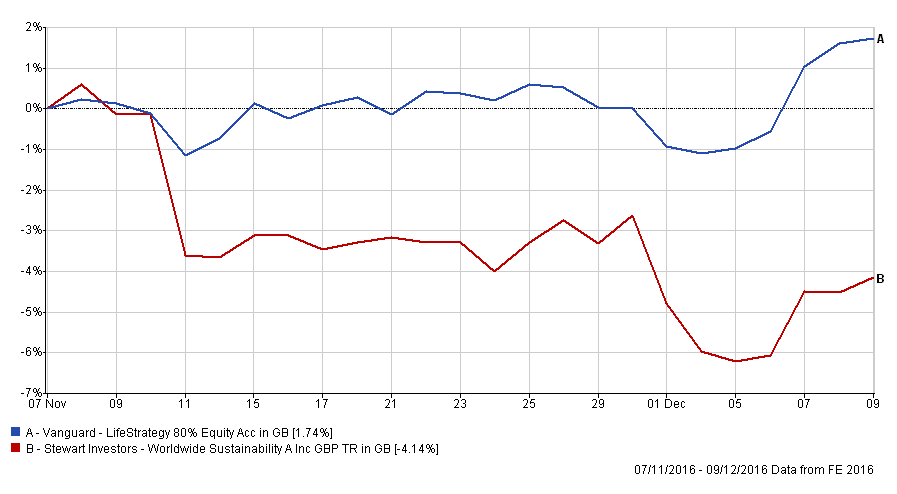
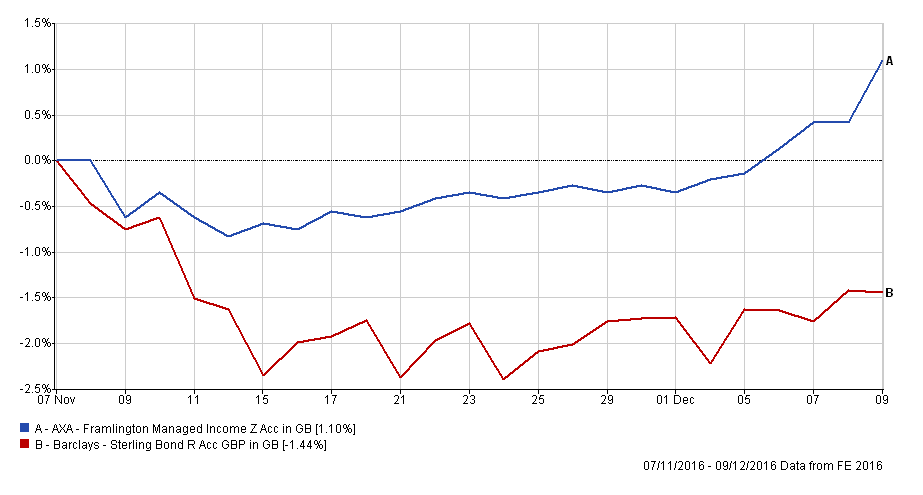
Last month I made two fund switches and got rid of two funds which had fallen out of the BOTB and the BFBS lists (i.e. the equivalent of being red in the above table). That turned out to be a good move (see chart below) although the market did move slightly against me while the trade was processed. The funds I previously held are in red while their replacements are in blue. So while I'd like to tweak the Franklin UK Equity Income fund and the Vanguard LifeStrategy 80% Equity fund that I currently hold now is not the right time for the reasons stated above. Also the Vanguard fund is one of the positive replacements shown below so there really is no need to panic just yet. Click to enlarge images.
Remember that the 80-20 Investor algorithm allows for funds to be held for up to a six month period so there really is no compulsion or dire need to change these funds as they've only dropped out of the lists in the last month. The new year is not far away so I will review things again then and will likely reduce the number of fund holdings back to 10 or less (it will temporarily be 11 after the switch stated below).
Fund switch
So for now I will switch 48% of my holding in the BlackRock Overseas Corporate Bond Tracker into Blackrock US Dynamic (GB00B87XJQ69) which is a US equity fund in this month's BOTB. This means my US equity and global bond exposure become more balanced (neutral) and in line with the BOTB asset mix. There is a tiny bid/offer spread on the Blackrock US Dynamic fund but it is not worth dwelling over. Of the US funds in this month's BOTB it has the lowest charges and lowest max drawdown figure so hopefully will provide a bit of stability if markets sell-off. This does mean that the equity exposure of my new portfolio has marginally increased but that may change in the new year. I am also happy with the associated increased risk as bonds offer dubious downside protection at the moment.
My new portfolio
New funds are in green:
| Name | % Allocation | Sector | ISIN Code |
| AXA - Framlington Managed Income | 9.14 | Sterling Strategic Bond | GB00B6RPX228 |
| Baillie Gifford - Japanese | 8.66 | Japan | GB0006010838 |
| BlackRock - Overseas Corporate Bond Tracker | 10 | Global Bonds | GB00B58YKH53 |
| Franklin - UK Equity Income | 8.74 | UK Equity Income | GB00B7DRD638 |
| Henderson - China Opportunities | 7.81 | China/Greater China | GB0031860934 |
| IFSL - Brooks Macdonald Defensive Capital | 8.83 | Targeted Absolute Return | GB00B61MR835 |
| Invesco Perpetual - Asian | 4.42 | Asia Pacific Excluding Japan | GB00B8N44Q86 |
| Marlborough - European Multi-Cap | 13.84 | Europe Excluding UK | GB0001719730 |
| Threadneedle - Dynamic Real Return | 5.99 | Targeted Absolute Return | GB00BWWC6P48 |
| Vanguard - LifeStrategy 80% Equity | 13.41 | Mixed Investment 40%-85% Shares | GB00B4PQW151 |
| Blackrock - US Dynamic | 9.16 | North America | GB00B87XJQ69 |
My new asset allocation
My new asset allocation is shown below with my previous allocation in brackets
- Global fixed interest - 16% (24%)
- US equities -13% (6%)
- European equities - 13% (13%)
- UK equities - 11% (11%)
- Japanese equities - 10% (10%)
- Other international equities - 0% (0%)
- Cash - 5% (3%)
- Property - 0% (0%)
- UK Gilts - 0% (0%)
- UK Fixed Interest - 9% (9%)
- Alternative assets/strategies - 11% (11%)
- Asia Emerging Equities - 9% (9%)
- Asia Equities ex Japan - 3% (4%)

£200 Pension Cashback Offer
Make a qualifying deposit or transfer a pension to our partner Interactive Investor.
- Deposit or transfer a pension of at least £20k and you could earn £200 cashback
- Terms and Fees apply, Capital at risk
- New & Existing customers opening a SIPP
- Offer ends 31st July 2026
Before starting your transfer, check you won't lose any valuable benefits (such as guaranteed annuity rates or a lower protected pension age) and find out what exit fees you might have to pay
