

The background to my portfolio
Back in March 2015 I decided to invest £50,000 of my own money using 80-20 Investor. The purpose was twofold, firstly to show how you can use 80-20 Investor to invest and outperform the market with only a few minutes effort every now and then. Secondly, no other investment commentator, journalist or research provider invests their own money for fear of failing. This is a sorry state of affairs and is precisely why I committed to openly running my own portfolio for 80-20 Investor members to see.
Since then I have periodically changed my portfolio using the fund suggestions provided by the 80-20 Investor algorithm and associated research. I always disclose the changes at the time they are made.
Performance update
My portfolio has continued to perform extremely well while not taking excessive risks, typically around 50-60% equities. At present it has approximately 62% of the portfolio invested in equities which is the highest level for quite some time. I have produced over 26% profit despite the various crises we have experienced including a Greek crisis, a Chinese economic slowdown, a commodity crisis, Brexit vote, Donald Trump's surprise election win and the latest technology and Asia sell-off.
The chart below shows how my portfolio has outperformed since I started the challenge in March 2015. The green line is the performance of my portfolio while the red line is the benchmark showing the average return achieved by professional fund managers given the same asset mix. To accurately calculate this I have used the average return for each sector in which my portfolio invested. The blue line shows what the average multi-asset fund with comparable equity content achieved. In other words the red line would show the extra performance added by just the asset mix of my portfolio (where I was invested i.e European equities etc) over picking a typical multi-asset fund (the blue line). While the green line (which is my actual performance) shows the impact of being in the right funds at the right time, as identified by the 80-20 Investor algorithm. At the time of writing, I have turned my original £50,000 into £63,075 which is a profit of 26.15%.
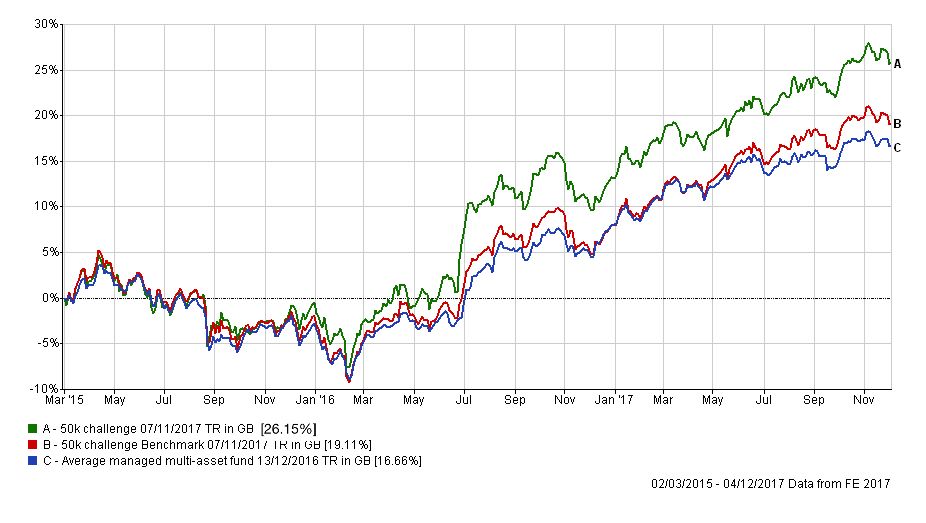
The boost provided by where I am invested (my portfolio's asset mix) has continued to grow and that has been down to my exposure to Asian equities, emerging markets (such as China). and technology stocks. This has then been amplified by being in the right funds within those sectors.
The table below shows my current portfolio, with those funds in green still in the BOTB while those in yellow are not in the BOTB but remain in the BFBS list. Meanwhile any funds in red have dropped out of both shortlists.
| Name | Allocation % (rounded) | Risk | Sector | ISIN Code | SEDOL Code |
| Baillie Gifford American | 13.7 | Medium | North America | GB0006061963 | 606196 |
| Baillie Gifford Emerging Markets Growth | 3.3 | High | Global Emerging Markets | GB0006020647 | 602064 |
| Baring Eastern Trust | 4.7 | High | Asia Pacific Excluding Japan | GB0000799923 | 79992 |
| CF Miton European Opportunities | 3.1 | High | Europe Excluding UK | GB00BZ2K2M84 | BZ2K2M8 |
| F&C Property Growth and Income | 3.5 | Low | Property | GB00BQWJ8687 | BQWJ868 |
| Fidelity China Consumer | 6.9 | High | China/Greater China | GB00B82ZSC67 | B82ZSC6 |
| Man GLG Strategic Bond | 16.8 | Low | Sterling Strategic Bond | GB00B731HR48 | B731HR4 |
| Man GLG UK Income | 3.3 | Medium | UK Equity Income | GB00B0117B11 | B0117B1 |
| Neptune Japan Opportunities | 7.2 | High | Japan | GB00B3Z0Y815 | B3Z0Y81 |
| Premier Diversified | 18.7 | Low | Mixed Investment 40-85% Shares | GB00B8BJV423 | B8BJV42 |
| TM Cavendish AIM | 10.7 | Medium | UK Smaller Companies | GB00B0JX3Z52 | B0JX3Z5 |
| TwentyFour Dynamic Bond | 8.1 | Low | Sterling Strategic Bond | GB00B5KPRZ34 | B5KPRZ3 |
The table above shows that there has been a subtle shift in the underlying momentum in markets. I say this because four funds have now dropped out of the BOTB and BFBS tables. If you've already read this month's analysis of the BOTB changes you will recall that I noted the reduction in exposure to technology stocks. In November technology accounted for around 19% of assets within the BOTB selection making it the largest sector by exposure. In December this has fallen to 14% with financial taking up much of the slack. This reflects the sector rotation we've seen in the US as a result of the progress made with Trump's proposed tax reforms, as I explained in detail in this recent newsletter. This goes some way to explain why the tech heavy Baillie Gifford American fund has lost momentum and fallen from the 80-20 Investor fund lists. Technology has had a stellar run in 2017 so the sector was overdue a breather and a bout of profit taking. It's a similar story with Chinese equities, a stellar year has given way to some recent weakness (the reasons for this are explained in my newsletter titled 'Chinese whispers'). This, along with the latest technology sell-off, has also taken its toll on the Baillie Gifford Emerging Markets Growth fund.
European equities have remained lacklustre and so it doesn't surprise me that the CF Miton European Opportunities has slipped out of the 80-20 Investor fund lists. The fund was on my watchlist after November's review. Interestingly the F&C Property Growth and Income was my top performing fund in November (up 1.5% for the month) but there were a few funds within the same sector that outperformed. It's fared well in the latest bout of market volatility.
Fund switches
Switch 1
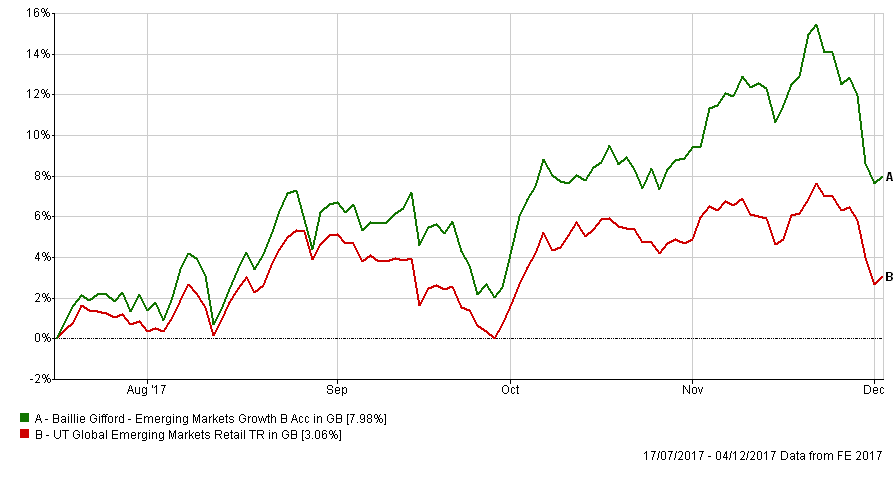
100% out of Baillie Gifford Emerging Markets Growth and 100% into Neptune Japan Opportunities. The Baillie Gifford fund has had a change in fortunes, partly due to the profit taking we've seen in Chinese and technology stocks. You can see from the chart below that just over a week ago the fund was up over 15% in the 5 months I've been invested in it. There's since been a pullback but the fund remains almost 8% in profit versus 3% for the sector average. That's still a great result. In light of its removal from the BOTB tables and the change in fortunes I think it's a good time to take profits and reinvest elsewhere.
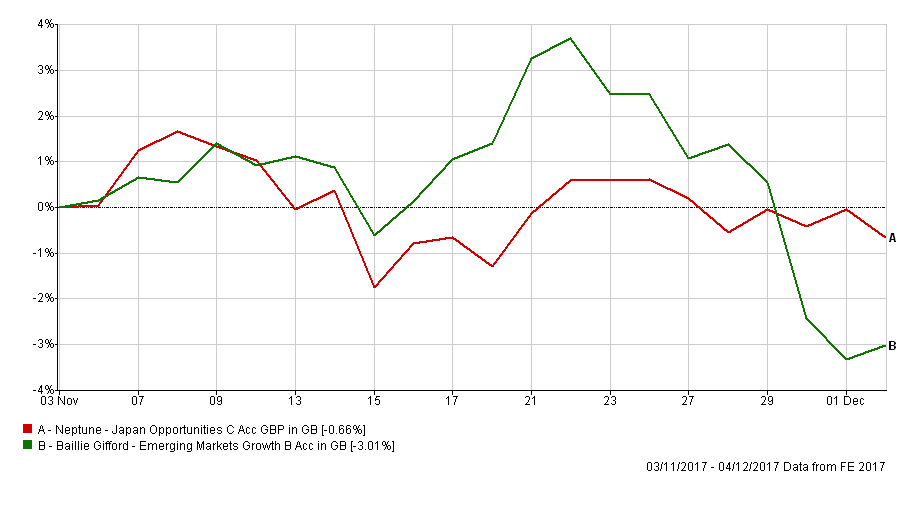
By contrast the fortunes of Japanese equities (especially hedged funds) have been better despite the tech sell-off as shown below. That's not to say this will remain the case going forward but if you use the Stress Test tool the fund has managed to weather past tech stock falls better. The switch will bring my Japan exposure up in line with that of the BOTB and the number of funds in my portfolio back down to 11. The Neptune fund is currently classed as medium risk (vs high risk for Baillie Gifford Emerging Markets Growth) and has a lower max weekly fall figure. Hopefully this will provide my portfolio with a bit more resilience if the market weakness persists.
Switch 2
100% out of Baillie Gifford American fund and 100% into 7IM US Equity Value. This is a simple like-for-like swap of one US equity fund for another. The key difference is that the 7IM fund is more closely correlated to the fortunes of the Dow Jones Industrial Average (see chart below) while the Baillie Gifford fund more closely follows the tech heavy Nasdaq. For example the 7IM fund doesn't have any of the big mega-tech stocks (Facebook etc) in its top 10 holdings. The Dow Jones has benefited from the rotation out of tech stocks into financials, as the latter looks set to benefit from Trump's tax reforms, and the 7IM fund is riding this wave.
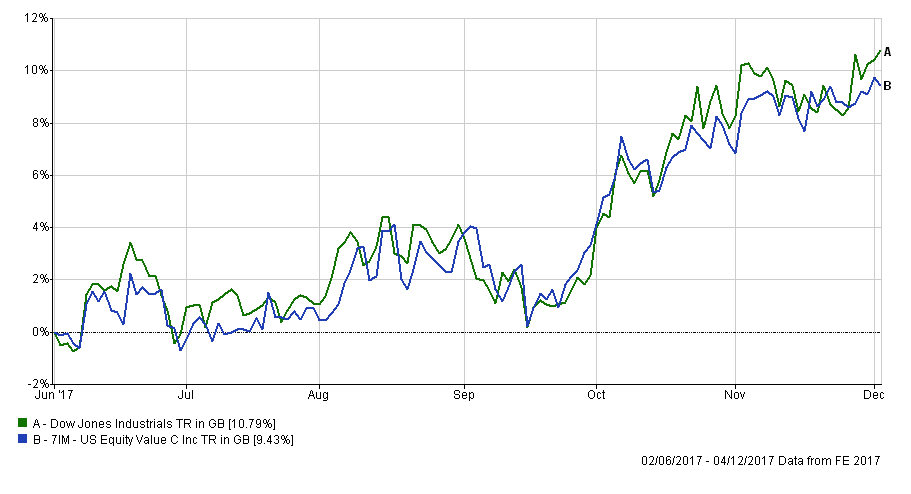
From a portfolio point of view it reduces my exposure to tech stocks which has been an incredibly profitable trade but its future looks uncertain. The chart below shows how the Baillie Gifford fund has outperformed its peers since I've held it despite the recent tech sell-off (which you can see in the top right). 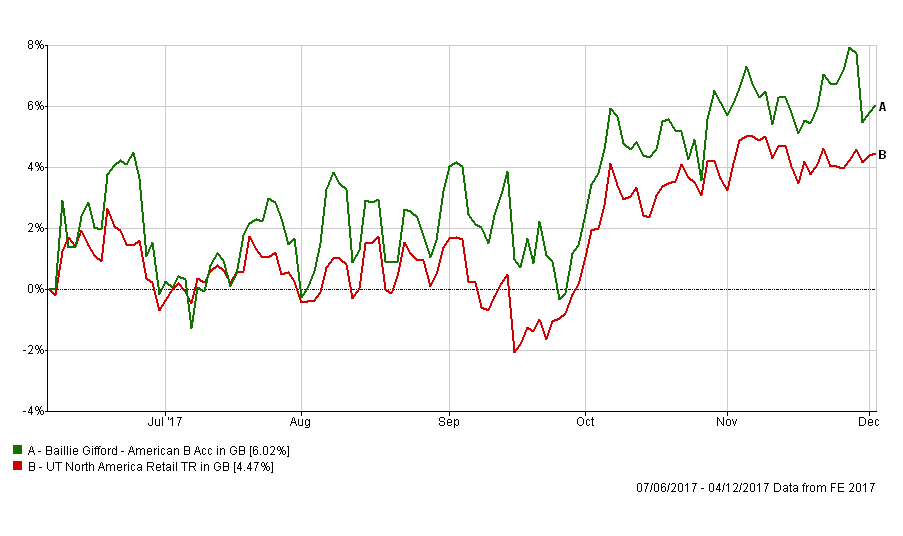
Switch 3
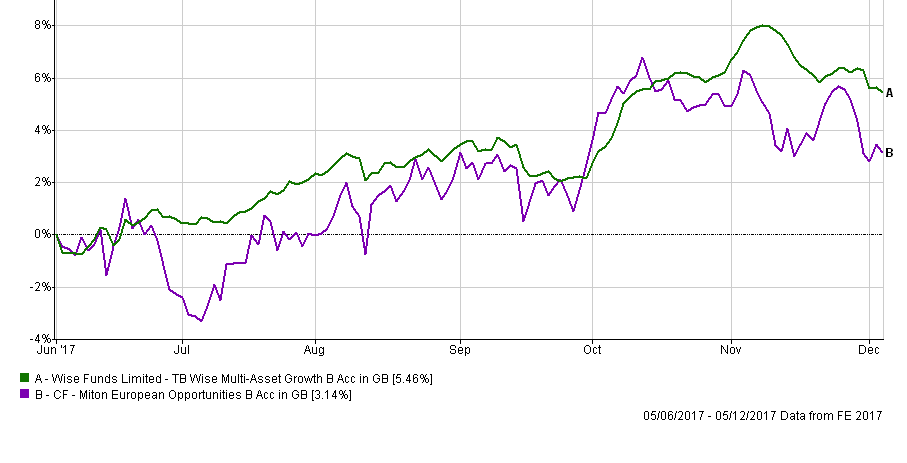
100% out of CF Miton European Opportunities and 100% into Wise Funds Limited TB Wise Multi-Asset Growth. European equities now account for only 3% of my portfolio and for now I will remove the last remnants. The Miton fund has continued to struggle alongside its European peers and I've chosen to invest in a medium risk multi-asset fund instead. With the continued weakness of equities generally, it pays to diversify into other assets. While the Wise Multi-Asset Growth fund invests in a range of assets including property it does still have an equity base but has managed to smooth out the market falls while capturing much of the upside. The chart below shows the recent performance of the Miton fund versus the Wise Multi-Asset fund.
The overriding theme of the switches is sector rotation and moving into a range of more diversified assets. Some big bets on Asia and technology stocks within the portfolio have paid off but now I am moderating their exposure. By the way before I made the switches I made sure none of the funds carried a bid/offer spread.
I have decided to keep the F&C Property Growth and Income despite it falling out of the 80-20 Investor fund lists. When a fund falls out of the 80-20 Investor fund lists it doesn't suddenly become a bad fund, don't forget the research behind 80-20 Investor allows for funds to be held for 6 months. Yet with December being such a short month, with trading desks closed during the Christmas holidays, I plan to look at my portfolio in January again once the dust has settled. With market volatility picking up and the outside chance of a Santa rally (fingers crossed) I don't want to make drastic changes right now, beyond those listed above. The F&C Property Growth and Income fund is a low risk fund so holding on to it for a few weeks is unlikely to be too painful, especially in a market where equities are taking a breather. Unless the fund makes a reappearance in the 80-20 Investor fund lists in the interim then it will likely be replaced in January.
Overall I am only switching about 20% of my portfolio and my new portfolio will look as follows leaving my equity exposure around 67% (which is slightly up on last time):
| Name | Allocation % (rounded) | Risk | Sector | ISIN Code | SEDOL Code |
| 7IM US Equity Value | 13.8 | High | North America | GB00BWBSHX88 | BWBSHX8 |
| Baring Eastern Trust | 4.6 | High | Asia Pacific Excluding Japan | GB0000799923 | 79992 |
| F&C Property Growth and Income | 3.6 | Low | Property | GB00BQWJ8687 | BQWJ868 |
| Fidelity China Consumer | 6.6 | High | China/Greater China | GB00B82ZSC67 | B82ZSC6 |
| Man GLG Strategic Bond | 16.8 | Low | Sterling Strategic Bond | GB00B731HR48 | B731HR4 |
| Man GLG UK Income | 3.3 | Medium | UK Equity Income | GB00B0117B11 | B0117B1 |
| Neptune Japan Opportunities | 10.4 | Medium | Japan | GB00B3Z0Y815 | B3Z0Y81 |
| Premier Diversified | 18.8 | Low | Mixed Investment 40-85% Shares | GB00B8BJV423 | B8BJV42 |
| TM Cavendish AIM | 10.7 | High | UK Smaller Companies | GB00B0JX3Z52 | B0JX3Z5 |
| TwentyFour Dynamic Bond | 8.2 | Low | Sterling Strategic Bond | GB00B5KPRZ34 | B5KPRZ3 |
| Wise Funds Limited TB Wise Multi-Asset Growth | 3.2 | Medium | Flexible Investment | GB0034272533 | 3427253 |
My new asset mix
This means my new asset mix is (previous asset mix is in brackets):
- UK Equities 19% (18%)
- North American Equities 16% (17%)
- Global Fixed Interest 18% (18%)
- Japanese Equities 11% (7%)
- Other International Equities 9% (3%)
- Asian equities 4% (5%)
- European Equities 0% (4%)
- UK Fixed Interest 6% (6%)
- Cash 1% (1%)
- Alternative Investment Strategies (including property) 8% (13%)
- Emerging Asia equities 8% (8%)
- Emerging Market Fixed Interest 0% (0%)

£200 Pension Cashback Offer
Make a qualifying deposit or transfer a pension to our partner Interactive Investor.
- Deposit or transfer a pension of at least £20k and you could earn £200 cashback
- Terms and Fees apply, Capital at risk
- New & Existing customers opening a SIPP
- Offer ends 31st July 2026
Before starting your transfer, check you won't lose any valuable benefits (such as guaranteed annuity rates or a lower protected pension age) and find out what exit fees you might have to pay
