

The background to my portfolio
Back in March 2015 I decided to invest £50,000 of my own money using 80-20 Investor. The purpose was twofold, firstly to show how you can use 80-20 Investor to invest and outperform the market with only a few minutes effort every now and then. Secondly, no other investment commentator, journalist or research provider invests their own money for fear of failing. This is a sorry state of affairs and is precisely why I committed to openly running my own portfolio for 80-20 Investor members to see.
Since then I have periodically changed my portfolio using the fund suggestions provided by the 80-20 Investor algorithm and associated research. I always disclose the changes at the time they are made.
Performance update
As is usual in my portfolio reviews, the chart below shows how my portfolio has outperformed since I started the challenge in March 2015, three and a half years ago. The green line is the performance of my portfolio while the red line is the benchmark showing the average return achieved by professional fund managers given the same asset mix. To accurately calculate this I have used the average return for each sector in which my portfolio invested. The blue line shows what the average multi-asset fund with comparable equity content achieved. In other words, the red line would show the extra performance added by just the asset mix of my portfolio (where I was invested i.e European equities etc) over picking a typical multi-asset fund (the blue line). While the green line (which is my actual performance) shows the impact of being in the right funds at the right time, as identified by the 80-20 Investor algorithm.
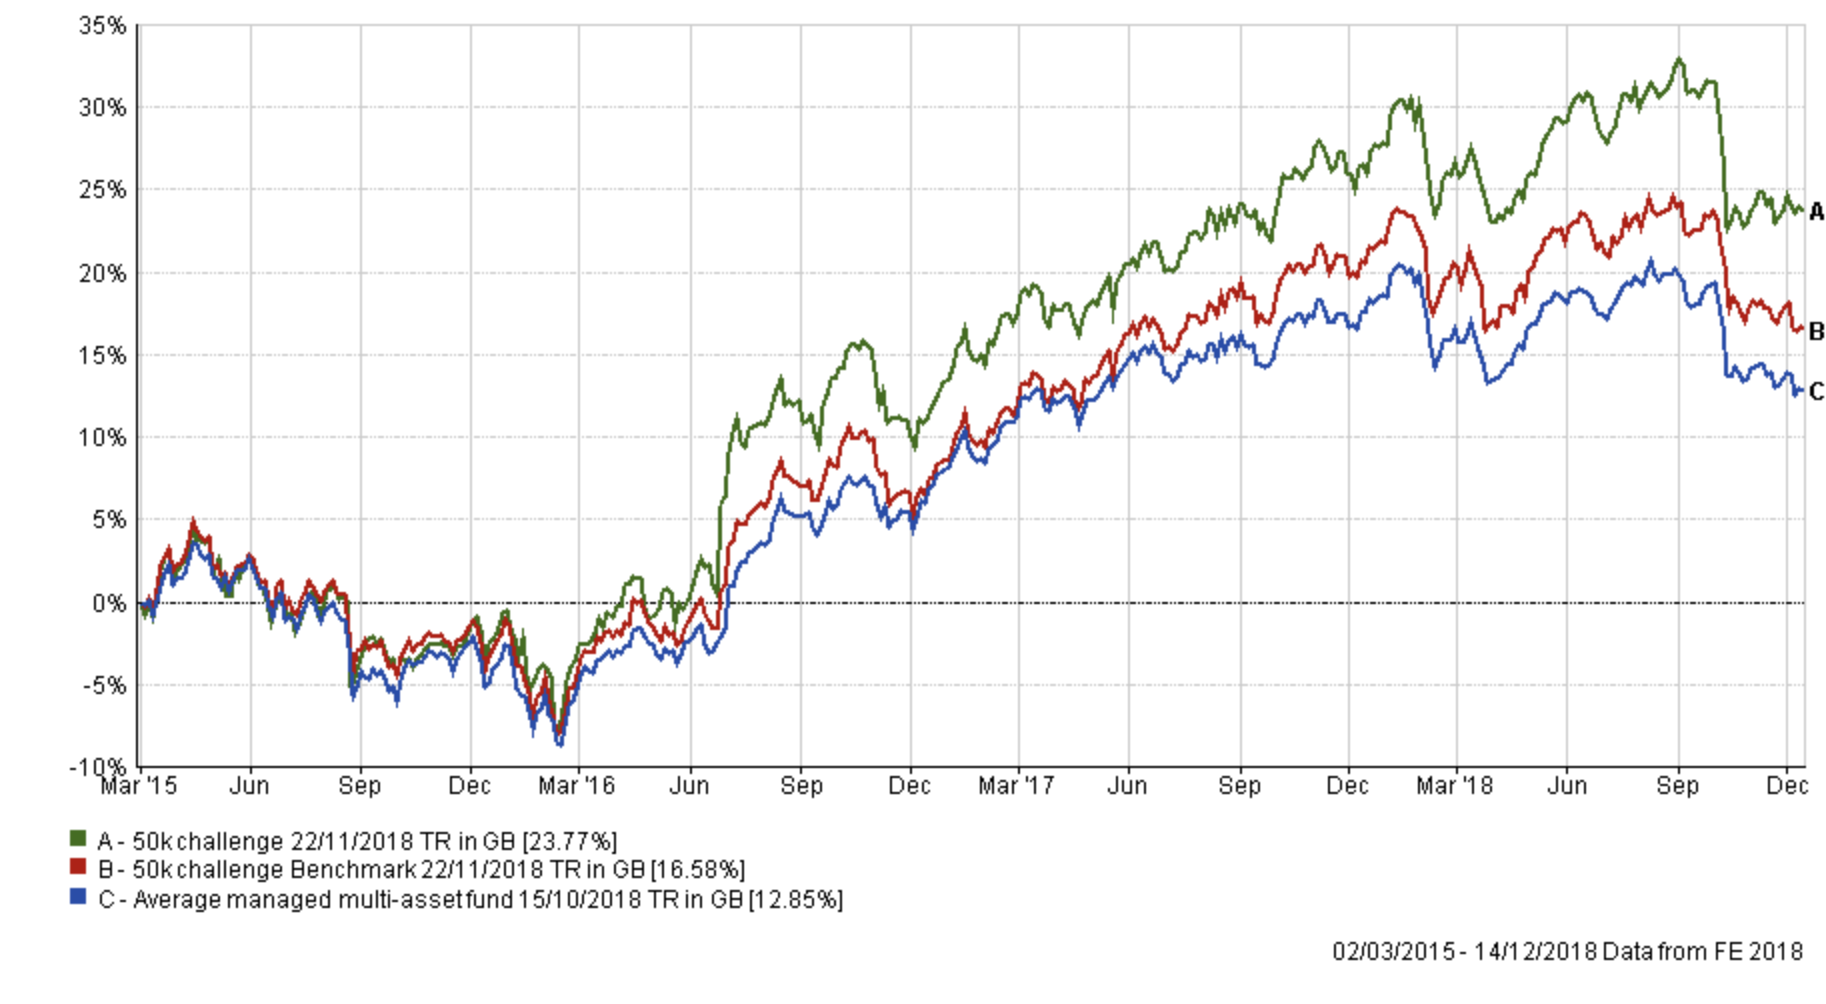
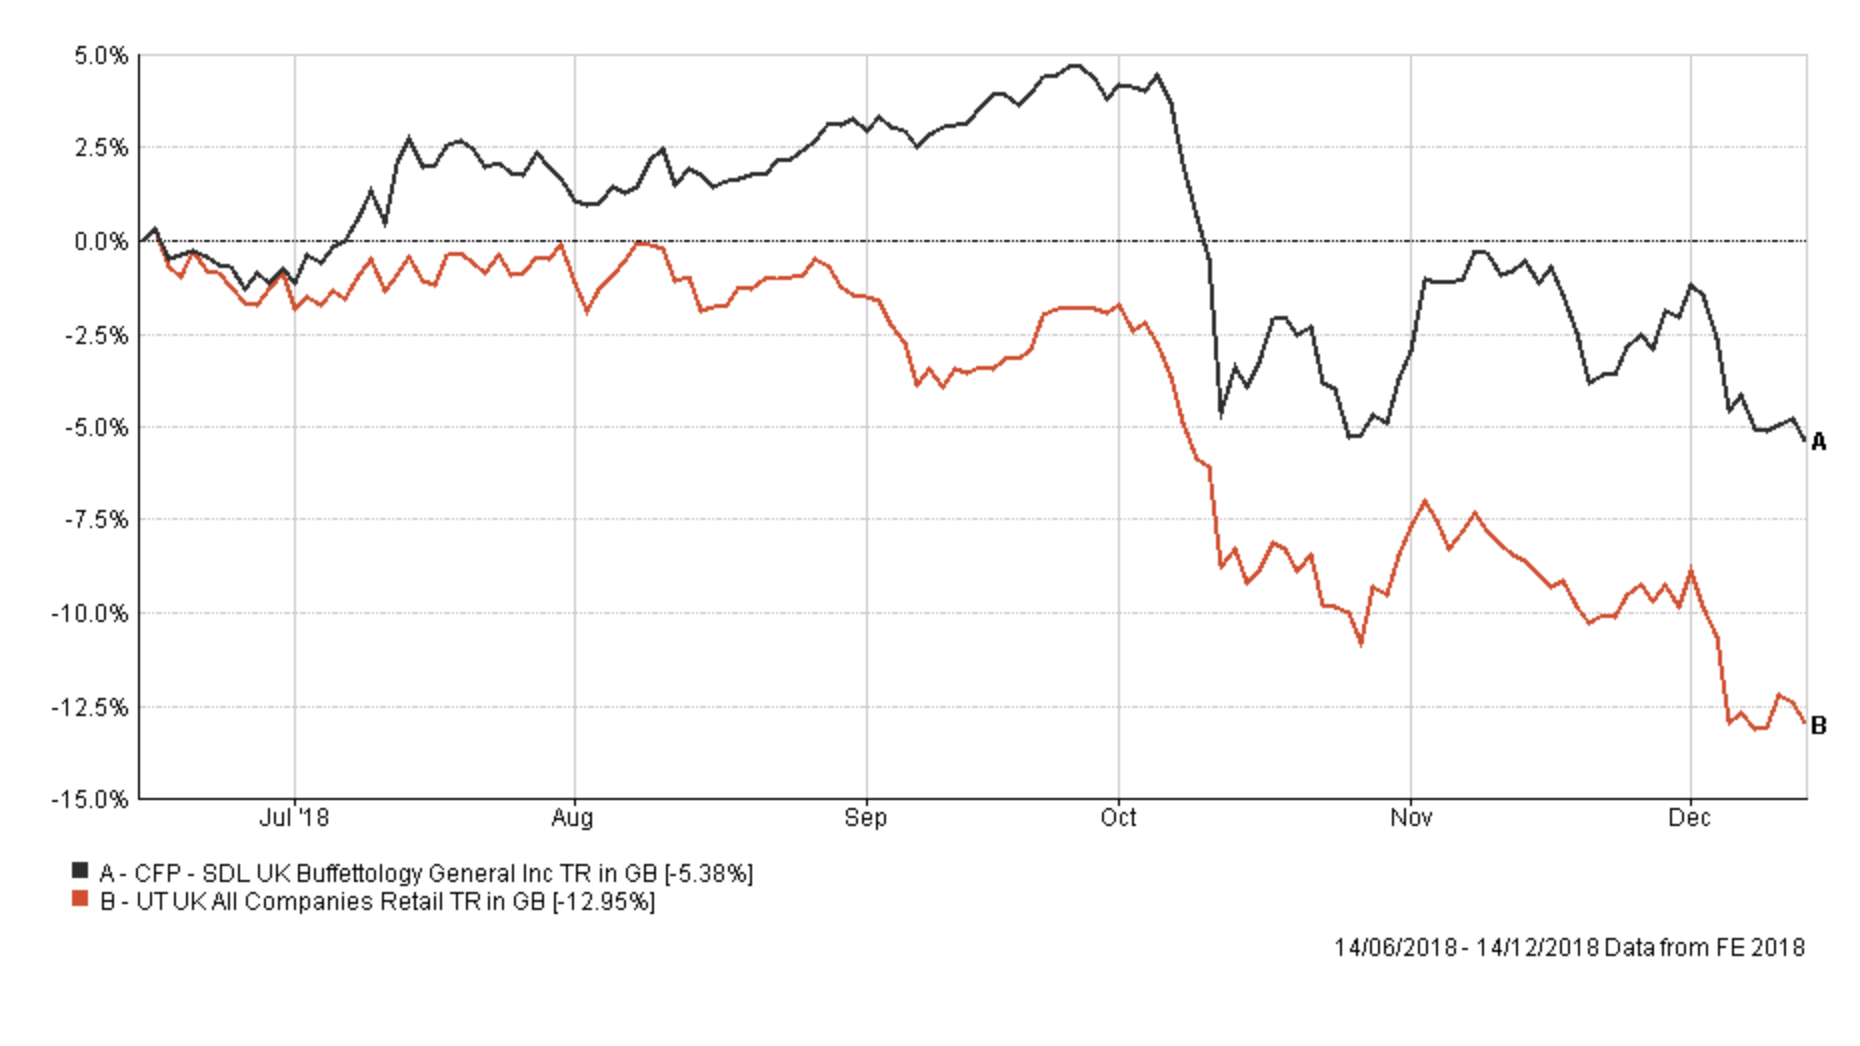
You can see the impact of October's market wobble on the far right of the chart. However, you will recall that in last month's portfolio review I discussed how my portfolio had outperformed its benchmarks since the changes I made in the aftermath of the October market sell-off. The situation remains the same and my portfolio is still benefiting from taking my foot off the gas as shown in the chart above. You can see on the far right how after the initial crash my portfolio has actually produced a positive return in the last two months despite a difficult and volatile market, while most professionally managed multi-asset funds have posted a loss. The chart below shows the last two months in isolation.

At the start of December, I intended to review my portfolio after December's BOTB was published. As I stated in December's monthly newsletter, I did, in fact, sit down and plan my potential tweaks but the renewed equity market sell-off and subsequent spike in volatility meant that I decided to postpone the changes until things settled down. The increased volatility in the value of the pound also hit a multi-year high which has added to the level of volatility already being experienced in equity markets. When markets are incredibly volatile they can move against you rapidly, especially as trading unit trusts leaves you out of the market for at least a day. At present my portfolio has the lowest equity content that I've ever had. It has around 20% invested in global bonds and 20% in cash, a minimal exposure to tech stocks and even shorts European stocks in a small part. So during a period where US Treasuries have rallied and stock markets have tumbled it's unsurprising that my portfolio has outperformed 84% of the professionally managed funds within the Mixed Investment 40-85% Shares sector.
The table below shows my portfolio's current allocation, with those funds in green still in the BOTB while those in yellow are not in the BOTB but remain in the BFBS list. Meanwhile, any funds in red have dropped out of both shortlists.
| Fund | Allocation % | Risk | Sector | ISIN Code | SEDOL Code | Citicode / TIDM |
| BlackRock European Absolute Alpha | 8 | Low | Targeted Absolute Return | GB00B4Y62W78 | B4Y62W7 | EYN0 |
| CFP SDL UK Buffettology | 12.5 | Medium | UK All Companies | GB00B3QQFJ66 | B3QQFJ6 | MJZ1 |
| JPM Japan | 3 | High | Japan | GB0030879471 | 3087947 | RT06 |
| FP - Octopus UK Micro Cap Growth | 5 | High | UK Smaller Companies | GB00BYQ7HN43 | BYQ7HN4 | NFZH |
| LF Miton European Opportunities | 4 | High | Europe Excluding UK | GB00BZ2K2M84 | BZ2K2M8 | MSED |
| Newton Real Return | 6.8 | Low | Targeted Absolute Return | GB0001642635 | 164263 | BS97 |
| Thesis TM Sanditon European Select | 6 | Medium | Targeted Absolute Return | GB00BNY7Y722 | BNY7Y72 | KMPQ |
| Man GLG Corporate Bond | 12.6 | Low | Global Bonds | GB00B0118B85 | B0118B8 | AX76 |
| LF Canlife North American | 12.6 | High | North America | GB00B73N3278 | B73N327 | 0YMD |
| Newton International Bond | 10 | Low | Global Bonds | GB0006779655 | 677965 | RZ04 |
| Cash | 19.5 | Low | N/A | N/A | N/A | N/A |
You will notice an absence of any yellow funds in the table above. That is mostly a result of the BFBS tables being fairly sparse right now as momentum in stock markets has evaporated. There are no European, Japanese, Chinese or UK Equity funds at all in the BFBS tables at the moment, as these sectors have felt the brunt of an equity sell-off sparked by worries over global economic growth while Brexit proves a further headwind.
Of the five funds in red Newton Real Return and CFP SDL UK Buffettology have only just dropped out off the BFBS table. If you look at the performance of the Buffettology fund over the last six months versus its sector peers it has held up relatively well (outperforming the average of its peers by 7.57%). A large part of the reason for that is that value stocks have outperformed growth stocks since the October sell-off.
So my original intention had been to simply remove the LF Miton European Opportunities, JPM Japan and LF Miton European Opportunities funds out of my portfolio in favour of other more defensively positioned equity funds with global exposure. However as mentioned earlier, the extreme levels of market volatility meant that being out of the market for some time could be counterproductive. In addition with markets moving so quickly and equity markets continuing to weaken/struggle I decided to hold off making a change, given the potential risks/reward. Bear in mind that the three funds mentioned only account for around 12% of my portfolio in total, so their impact on my portfolio is limited.
Furthermore, my current asset mix has fared well over the last two months (i.e it's managed to make a small profit while other professionally managed funds continue to lose value) so it's a case of if it's not broke don't try and fix it for now. On top of that, there are only 6 and a half trading days until the end of the year. Then in January there will, of course, be new BOTB and BFBS tables. I will therefore look to review my portfolio at the start of the new year.
Of course, equity markets could rebound from here at which point my portfolio would lag those with higher equity exposure. While I accept that 'taking my foot off the gas' has so far proved successful should the market suddenly rally into the year-end it would mean that I wouldn't enjoy as much of the upside, but from a risk management standpoint I am comfortable with that. The possibility of a more severe market crash still remains on the table for now.
My portfolio
My portfolio still looks like this:
| Fund | Allocation % | Risk | Sector | ISIN Code | SEDOL Code | Citicode / TIDM |
| BlackRock European Absolute Alpha | 8 | Low | Targeted Absolute Return | GB00B4Y62W78 | B4Y62W7 | EYN0 |
| CFP SDL UK Buffettology | 12.5 | Medium | UK All Companies | GB00B3QQFJ66 | B3QQFJ6 | MJZ1 |
| JPM Japan | 3 | High | Japan | GB0030879471 | 3087947 | RT06 |
| FP - Octopus UK Micro Cap Growth | 5 | High | UK Smaller Companies | GB00BYQ7HN43 | BYQ7HN4 | NFZH |
| LF Miton European Opportunities | 4 | High | Europe Excluding UK | GB00BZ2K2M84 | BZ2K2M8 | MSED |
| Newton Real Return | 6.8 | Low | Targeted Absolute Return | GB0001642635 | 164263 | BS97 |
| Thesis TM Sanditon European Select | 6 | Medium | Targeted Absolute Return | GB00BNY7Y722 | BNY7Y72 | KMPQ |
| Man GLG Corporate Bond | 12.6 | Low | Global Bonds | GB00B0118B85 | B0118B8 | AX76 |
| LF Canlife North American | 12.6 | High | North America | GB00B73N3278 | B73N327 | 0YMD |
| Newton International Bond | 10 | Low | Global Bonds | GB0006779655 | 677965 | RZ04 |
| Cash | 19.5 | Low | N/A | N/A | N/A | N/A |
My asset mix
This means my asset mix remains as follows (previous asset mix is in brackets):
-
- UK Equities 17%
- North American Equities 14%
- Global Fixed Interest 22%
- Japanese Equities 3%
- Other International Equities 0%
- Asian equities 1%
- European Equities 5%
- UK Fixed Interest 0%
- Cash 23%
- Alternative Investment Strategies 15%
- Emerging Asia equities 0%
- Emerging Market Fixed Interest 0%
- Property 0%
If you are looking for the notional high and low-risk versions of my £50k portfolio which are often published with these updates then see the question and answer (regarding their omission) in October's Chatterbox.

£200 Pension Cashback Offer
Make a qualifying deposit or transfer a pension to our partner Interactive Investor.
- Deposit or transfer a pension of at least £20k and you could earn £200 cashback
- Terms and Fees apply, Capital at risk
- New & Existing customers opening a SIPP
- Offer ends 31st July 2026
Before starting your transfer, check you won't lose any valuable benefits (such as guaranteed annuity rates or a lower protected pension age) and find out what exit fees you might have to pay
