

The background to my portfolio
Back in March 2015 I decided to invest £50,000 of my own money using 80-20 Investor. The purpose was twofold, firstly to show how you can use 80-20 Investor to invest and outperform the market with only a few minutes effort every now and then. Secondly, no other investment commentator, journalist or research provider invests their own money for fear of failing. This is a sorry state of affairs and is precisely why I committed to openly running my own portfolio for 80-20 Investor members to see.
Since then I have periodically changed my portfolio using the fund suggestions provided by the 80-20 Investor algorithm and associated research. I always disclose the changes at the time they are made.
Performance update
As is usual in my portfolio reviews, the chart below shows how my portfolio has outperformed since I started the challenge in March 2015, three and a half years ago. The green line is the performance of my portfolio while the red line is the benchmark showing the average return achieved by professional fund managers given the same asset mix. To accurately calculate this I have used the average return for each sector in which my portfolio invested. The blue line shows what the average multi-asset fund with comparable equity content achieved. In other words, the red line would show the extra performance added by just the asset mix of my portfolio (where I was invested i.e European equities etc) over picking a typical multi-asset fund (the blue line). While the green line (which is my actual performance) shows the impact of being in the right funds at the right time, as identified by the 80-20 Investor algorithm.
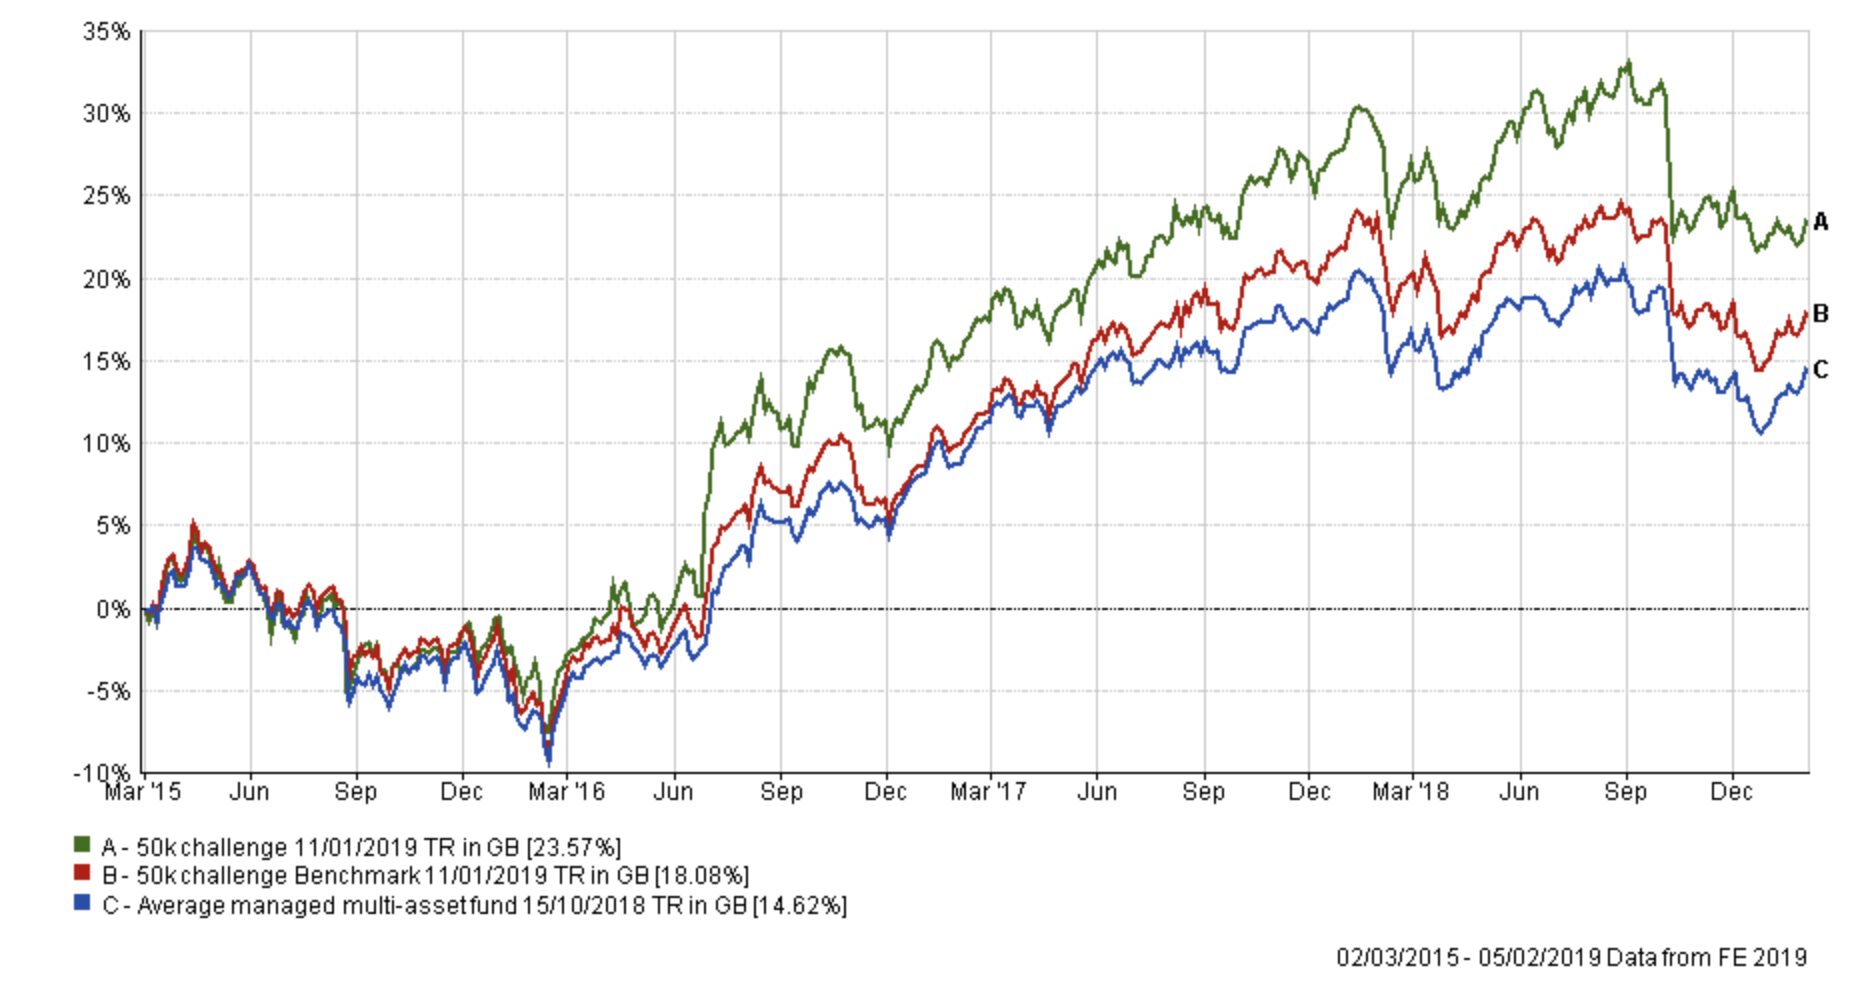
It's been a fascinating start to the new year. If you've read February's monthly newsletter you will know that the worst December for stock markets in almost 90 years was followed by the best January for 32 years. The net result is that most stock markets are back near where they were at the start of December. Investors who sat on the sidelines in cash are still better off and would have slept a hell of a lot better too.
In fact, the chart below demonstrates this nicely. The green line represents the performance of my £50k portfolio while the red line represents the performance of the average professionally managed multi-asset fund.
You can see that my portfolio behaved as I predicted it would in my last portfolio review in January. While the typical managed fund fell 5% in December my portfolio fell by just half of that. When stock markets enjoyed a huge rebound in January, mostly a result of manipulation by the US Federal Reserve and the White House, my portfolio lagged. Without the benefit of hindsight (or indeed even with it) which portfolio would you rather have had? Don't forget that there were fears that stock markets were staring at a further 10-20% decline when they hit their December low. Personally, I would rather hold the green portfolio (i.e. my portfolio) every time. You have to remember it is not possible to choose a portfolio that captures less of the market's downside but all of the upside.
As I mentioned last time, it is tempting to follow your emotions and the investment headlines out there. To avoid this I stick to a process and will continue to do so.
Last month I slightly reduced my equity portfolio in favour of bonds. Given the stock market rally that followed that decision 'cost' my portfolio 0.51% of performance overall. Not much but I highlight it to demonstrate that sometimes a process will mean that you don't capture all of the upside all of the time. The problem is that if you don't follow a process you are following your emotions and that almost always ends up being far more costly.
The 80-20 Investor process is not just about performance but also risk management. I am therefore happy with how the portfolio has fared in the last two months, demonstrating a low level of volatility in what has been an incredibly volatile period for markets. Right now everyone will tell you that the market is headed higher. The consensus is once again bullish, yet the market is teetering on the verge of being overbought which can be a sign of a possible reversal in fortunes, but it doesn't have to be. If you revisit my recent technical analysis article which takes an objective view of the market, the market is now in a more positive place than it has been over the last two months. Stock markets are within a whisker of confirming that the downtrend stemming from October has been negated, but it hasn't been confirmed yet. This means that there is a possibility of more upside for stock markets, although it's unlikely to be straightforward if it does occur. In reality, while the risk of a retest of the December stock market lows has diminished it certainly has not yet disappeared altogether. If the last two months have taught investors anything then it is to expect the unexpected.
I have no idea which way the market will go and am not in the game of making bold predictions. So I intend to stick with the 80-20 Investor process, to ensure that any sustained changes in market momentum are reflected in my portfolio.
In last month's portfolio review I broke with tradition and, rather than presenting the colour coded table detailing which funds within my portfolio are in the BOTB and which are still in the BFBS, I ran through each of my fund holdings to discuss their inclusion/removal. I have decided to do this once again partly because the only funds that remain in the BOTB or BFBS tables are Newton International Bond and BlackRock European Absolute Alpha.
BlackRock European Absolute Alpha & Newton Real Return
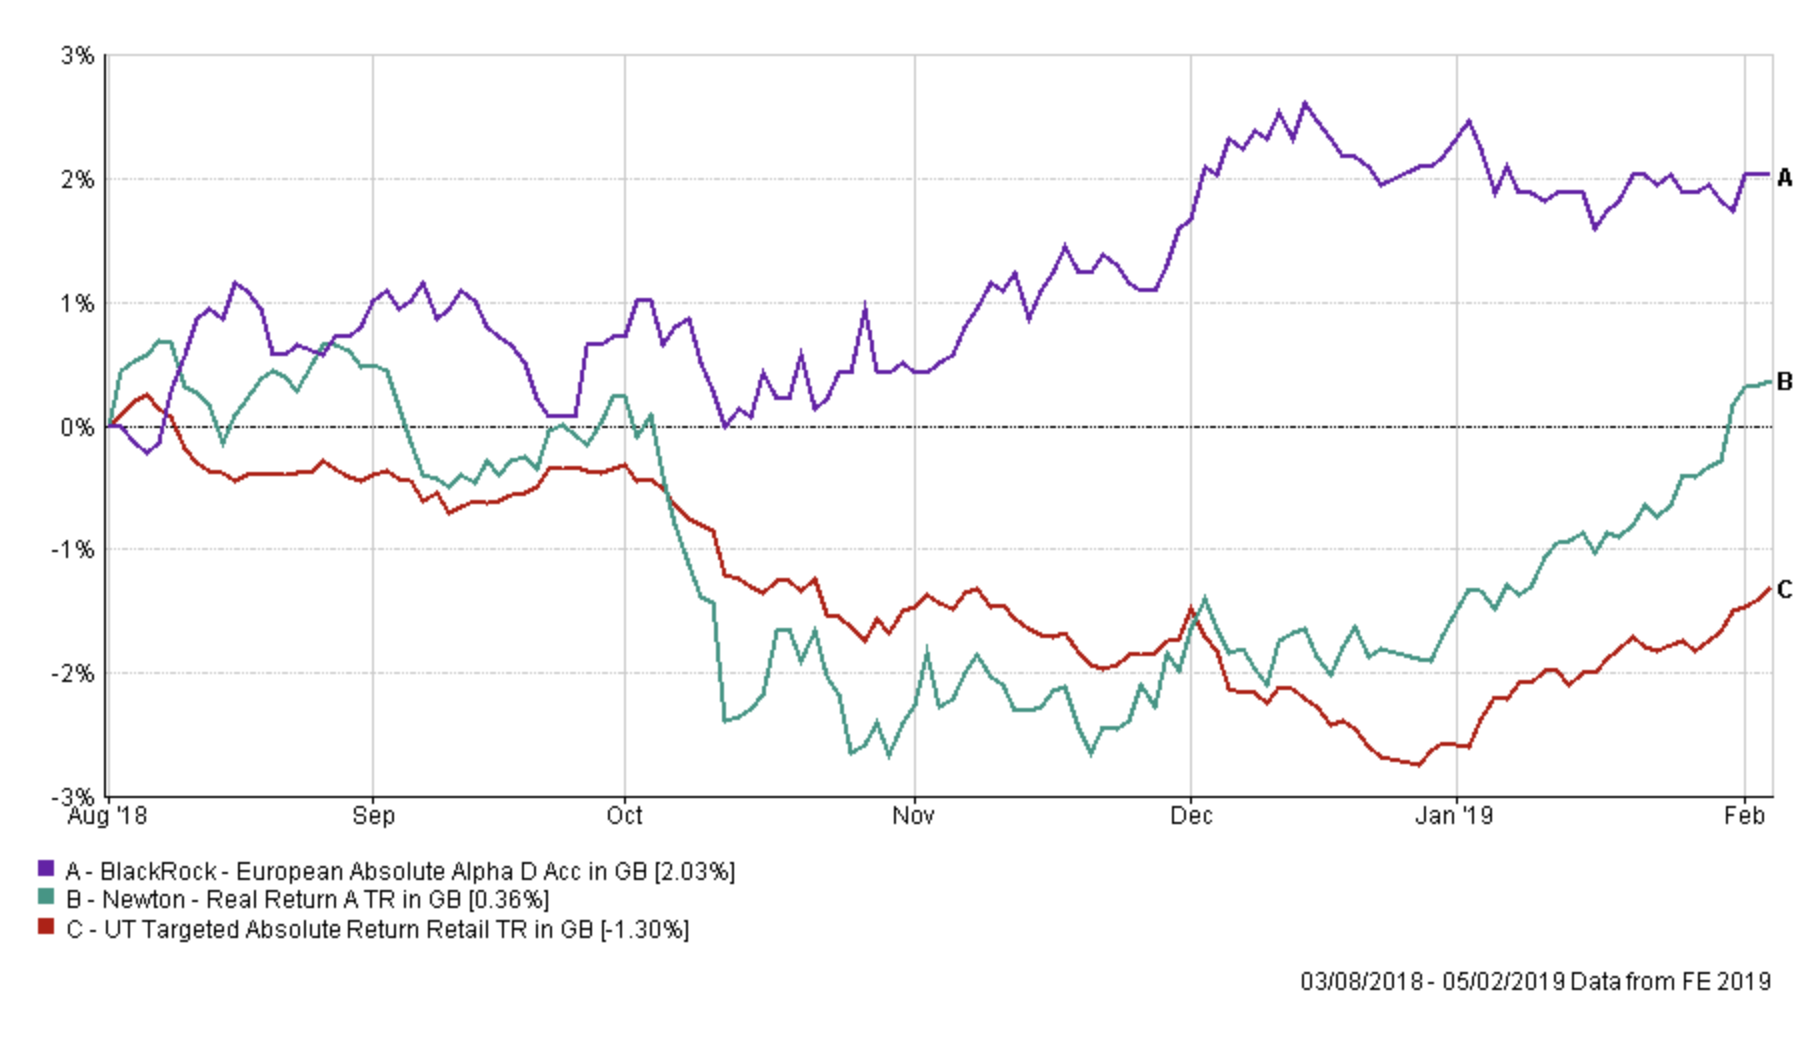
Both funds are part of my portfolio that reside in the Targeted Absolute Return sector. The Blackrock fund remains in the BOTB while Newton Real Return has only now drifted out of both the BOTB and BFBS tables. Last time I highlighted how the Blackrock fund had performed fantastically well in the face of equity market weakness, which is what you want from such a fund (see the purple line in the chart below). By contrast, the Newton fund's performance continues to be influenced by equity market returns but its strong performance in December (when equity markets in fact tumbled) resulted in it outperforming its peers. This outperformance has continued into January so I still see little reason to change things right now.
Man GLG Corporate Bond & Newton International Bond
Both bond funds have been strong performers during periods of equity market weakness and in the face of slowing global economic growth. The Newton fund remains in the BOTB and BFBS tables while the Man GLG fund has drifted out. The funds posted small negative returns in the last month because the equity rally saw investors ditch bonds in favour of equities. However, as I said earlier I will continue to stick with a process, which means that I will maintain a significant exposure to global bonds. The current BOTB has around a 22% exposure to global bonds and emerging market bonds. This is lower than my current exposure of 29% so I will look to trim this down to be more in line with the BOTB.
LF Canlife North American
Last month I placed this fund on my watchlist with a view to reviewing it this time around. As you can see the performance of the fund has continued to lag its peer group so I am deciding to remove it from my portfolio. The chart below shows the performance of the fund since I've held it versus its peer group. It's not a disaster by any stretch but it is a little uninspiring.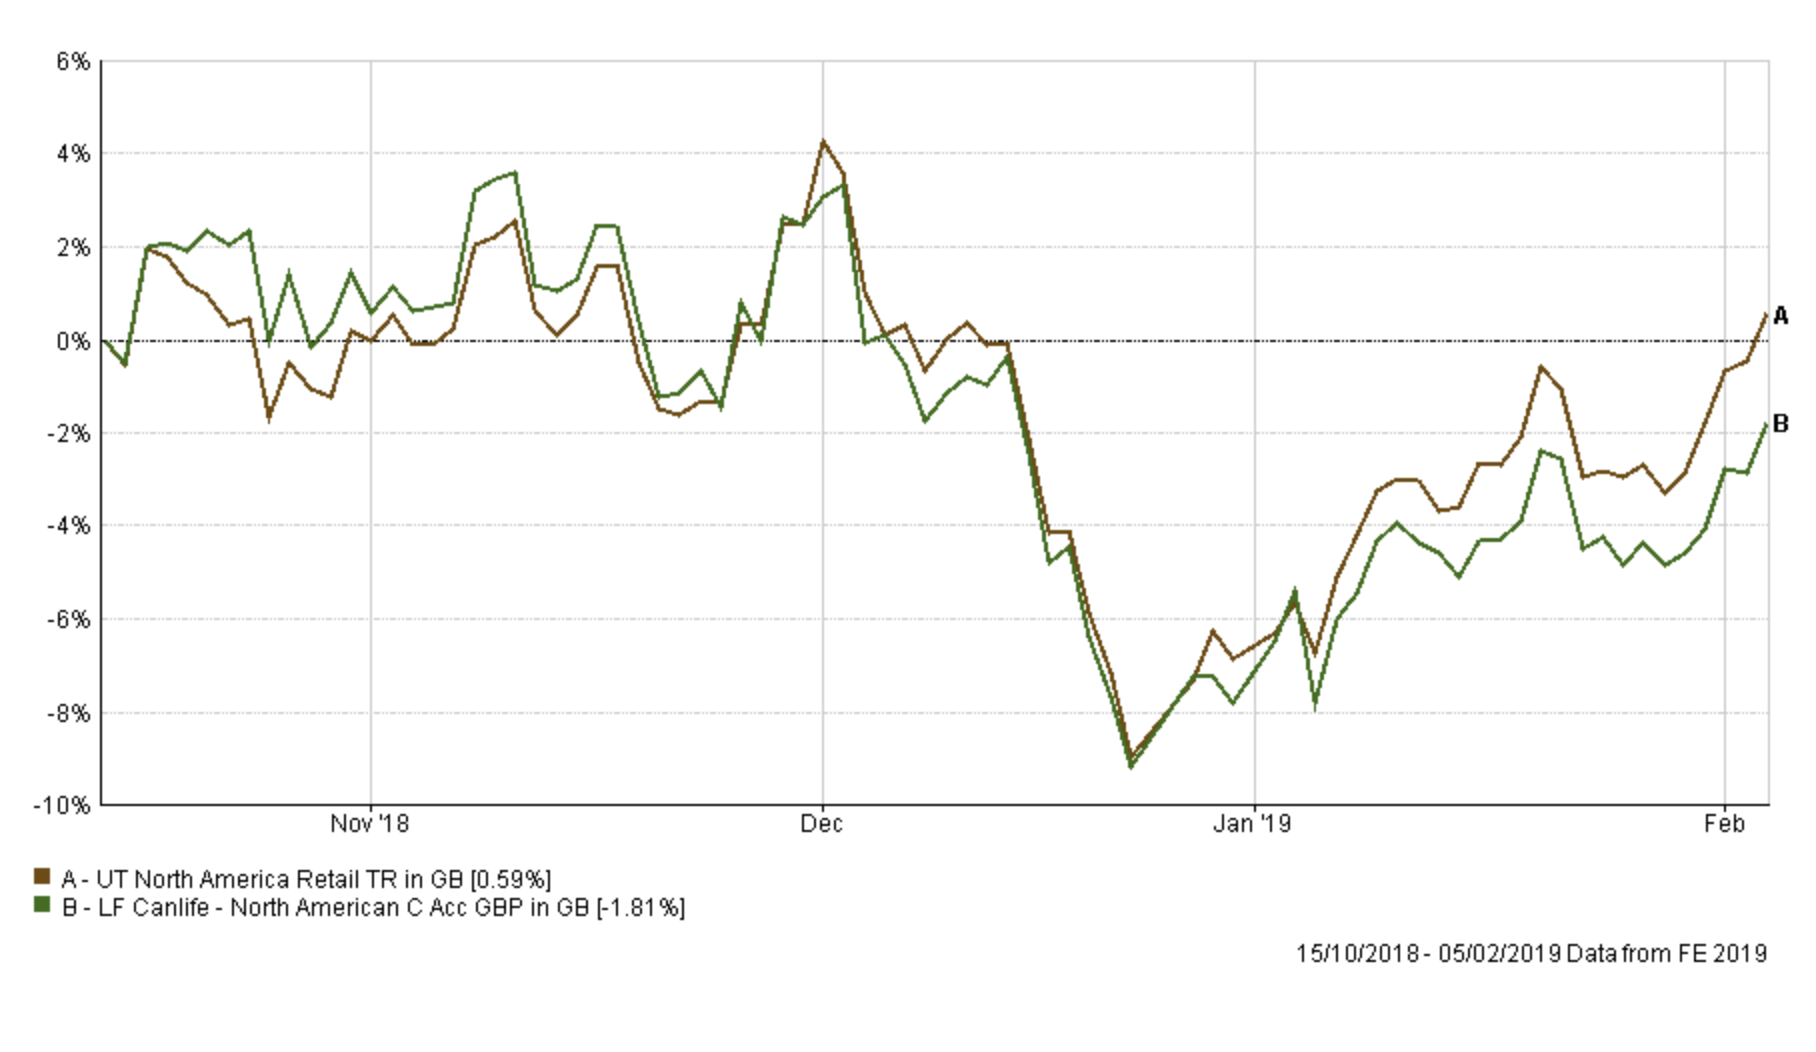
CFP SDL UK Buffettology
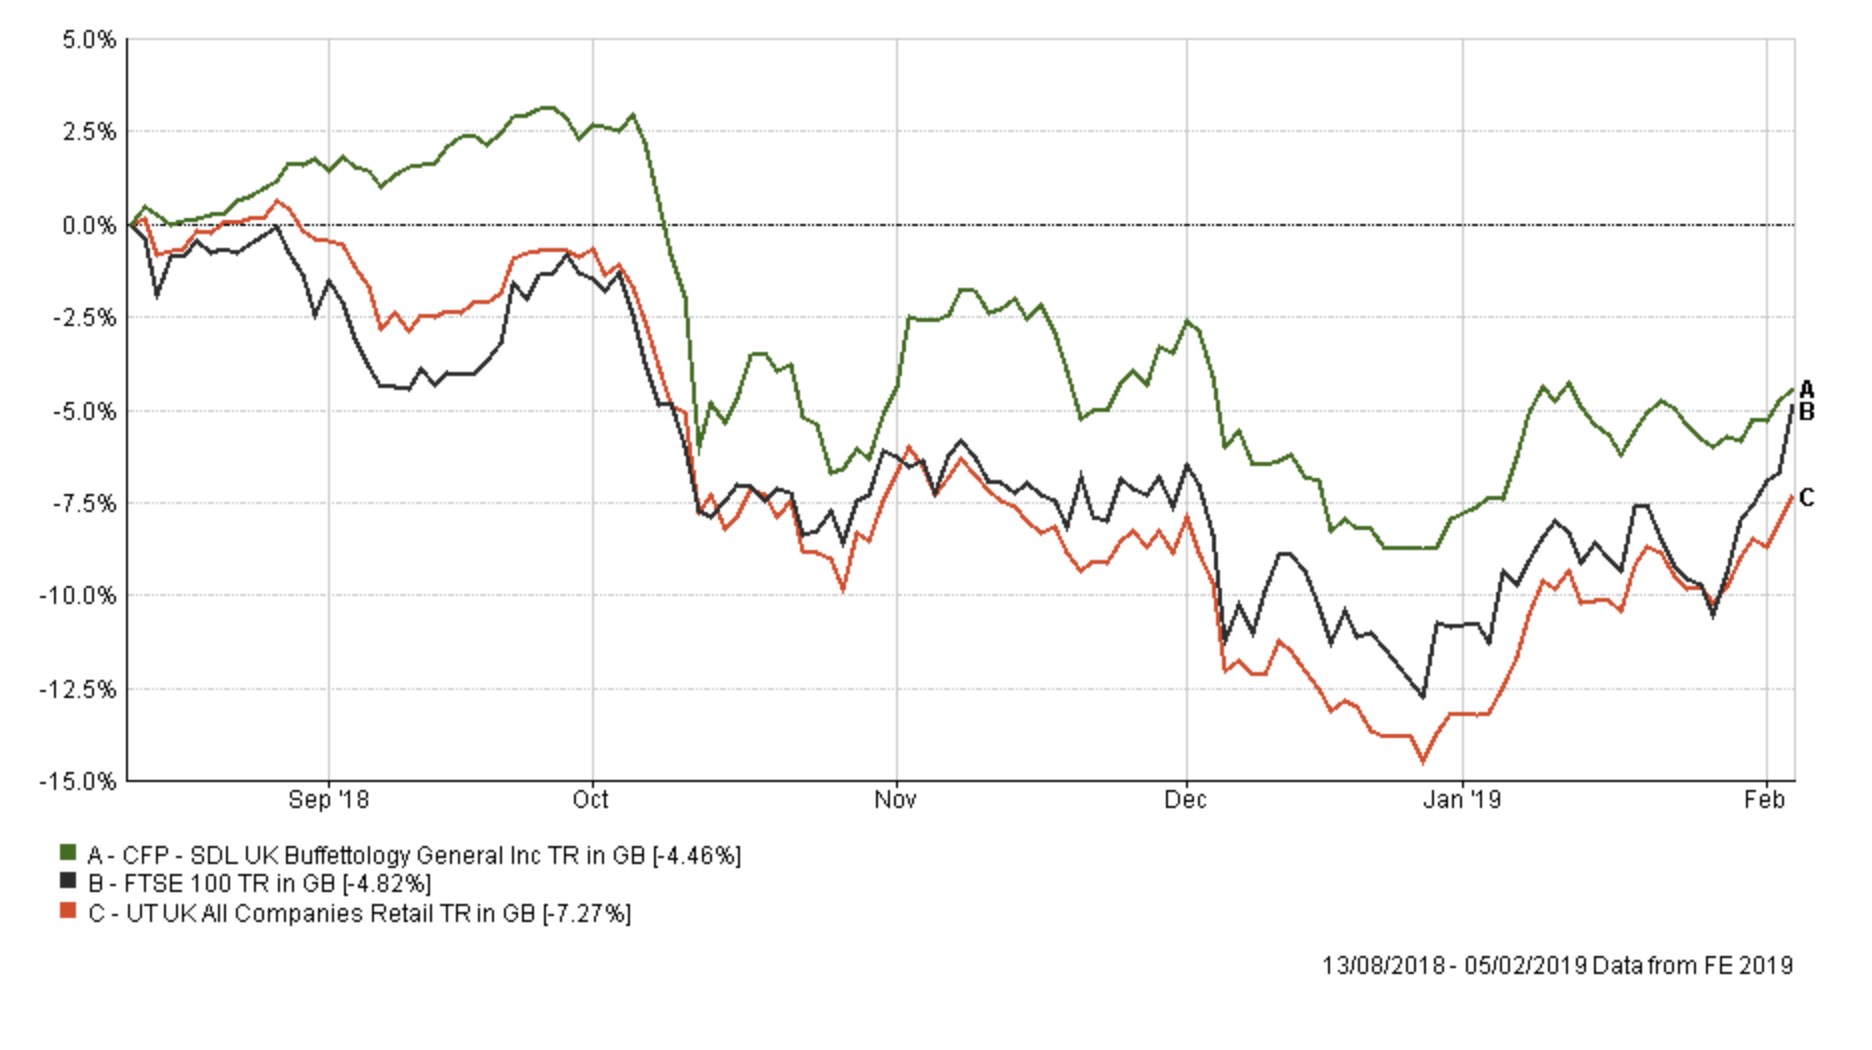
Last time I wrote that the fund had significantly outperformed its peer group. At that time, out of the 232 funds within its sector it ranked 5th for performance for the period of time that I'd held it. January's subsequent stock market rebound favoured those funds with exposure to growth stocks and oil (the price of oil rallied significantly) which meant that its ranking dropped slightly. Despite this the fund still has still outperformed 90% of its peers since I've held it which is no mean feat. If there was a UK equity fund to hold this remains a strong contender. However, UK equity funds have all dropped out of the BOTB as momentum has faded, especially in the lead up to Brexit.
The BOTB has been reducing its exposure to UK equities over the last couple of months and I will continue to follow suit (and drip out) by selling 50% of my holding in the CFP SDL UK Buffettology fund. This will bring my UK equity exposure back in line with the BOTB
Thesis TM Sanditon European Select & LF Miton European Opportunities
These two funds have provided my exposure to European equities. If you recall from last time, despite the LF Miton fund having long fallen out the BOTB and BFBS tables it has managed to outperform its sector average in the last two months. The Thesis fund's performance since October's sell-off began has also outsripped the average European equity fund because it shorts European equities, as shown below. However, the fund started to give back some of those gains during the January stock market rally. As such it is no longer in the BOTB, but only because the level of risk associated with the fund has risen.

Up until now, I've been deliberately using both funds in tandem to construct a hedged European equity position. The chart below shows how well this has fared since I've held the position. As you can see it has been a very successful and profitable way to gain exposure to European equities. On the basis that European equity funds are not in the BOTB or BFBS tables and have not been for some time I'm now going to remove both positions from my portfolio and reinvest the proceeds elsewhere.

Cash
My cash holding is at around 20% and my intention has always been to put this money to work when opportunities are identified by the 80-20 Investor algorithm. There are now such opportunities and I plan to invest half of my cash holding this month into a low risk diversified fund. The fact that the current BOTB still only has 25 funds shows that cash remains a viable destination right now. As such I will maintain some cash in the portfolio for now until we see confirmation that the market is finally out of its downtrend.
Fund switches
When making my fund choices I have applied the following logic:
- I've tried to reflect the BOTB's asset mix and equity exposure in my new portfolio
- minimised the number of changes where possible
- focused more on minimising the potential downside (by looking at the max weekly fall numbers) when I've had to make a choice between funds within the same sector
Below I list the fund switches:
- 100% out of LF Canlife North American with 50% into Fidelity Global Property and 50% into M&G Global Listed Infrastructure
- 50% out of cash and with 100% going into LF Seneca Diversified Income
- 50% out of CFP SDL UK Buffettology with 100% going into JPM Emerging Markets Income
- 33% out of Man GLG Corporate Bond with 100% going into Fidelity Global Property
- 100% out of Thesis TM Sanditon European Select with 50% into JPM Emerging Markets Income and 50% into Fidelity Global Enhanced Income
- 100% out of LF Miton European Opportunities with 50% into JPM Emerging Markets Income and 50% into Fidelity Global Enhanced Income
During the recent equity market weakness there have been sectors that have fared better than others. For example, property companies have performed better on a relative basis (as their income becomes more attractive when bond yields fall) versus other areas of the stock market. That's not to say that they won't fall when the market falls, but they have shown some resilience. That's why I have added some exposure to Fidelity Global Property. The fund invests purely in equities and while the HSBC Global Property fund would have been my first choice, given its lower 'max weekly fall' figure, the HSBC fund partly invests partly in UK direct property funds. As you know ahead of Brexit I am loathed to invest in such funds in case they once again impose withdrawal restrictions or penalties should investors rush for the exit all at once. That is why I discounted the HSBC fund.
You will also notice a greater exposure to income funds, both globally and in emerging markets as well as via a diversified managed fund. Income funds are usually more defensively positioned than growth focused peers. Overall the equity exposure of my portfolio increases slightly, to be more in line with the BOTB, towards 40%.
While obviously, I want to capture as much upside as possible I still want to limit the downside in case the market does sell-off. I aim to do this by diversifying my holdings (there are now 11 including my cash position). As a useful exercise, I backtested how my new portfolio would have fared over the December and January period, which is shown below. Interestingly the new portfolio would have endured less downside but more upside. Of course history never exactly repeats but in constructing a portfolio I wanted to be mindful that markets could just as likely retest their recent lows as much as they could move higher.

My portfolio
My portfolio now looks like this:
| Fund | Allocation % | Risk | Sector | ISIN Code |
| BlackRock European Absolute Alpha | 8 | Low | Targeted Absolute Return | GB00B4Y62W78 |
| CFP SDL UK Buffettology General | 6 | Medium | UK All Companies | GB00B3QQFJ66 |
| Fidelity Global Enhanced Income | 5 | Medium | Global Equity Income | GB00BD1NLJ41 |
| Fidelity Global Property | 12 | High | Property Other | GB00B7K2NZ09 |
| JPM Emerging Markets Income | 11 | High | Global Emerging Markets | GB00B56DF680 |
| LF Seneca Diversified Income | 10 | Low | Mixed Investment 20-60% Shares R | GB00B7JTF560 |
| M&G Global Listed Infrastructure | 6 | Medium | Global | GB00BF00R928 |
| Man GLG Corporate Bond | 10 | Low | Global Bonds | GB00B0118B85 |
| Newton International Bond | 15 | Low | Global Bonds | GB0006779655 |
| Newton Real Return | 7 | Low | Targeted Absolute Return | GB0001642635 |
| Cash | 10 | Low | N/A | N/A |
My asset mix
This means my asset mix is as follows (previous asset mix is in brackets):
-
- UK Equities 9% (11%)
- North American Equities 6% (13%)
- Global Fixed Interest 25% (29%)
- Japanese Equities 0% (0%)
- Other International Equities 2% (0%)
- Emerging market equities 11% (0%)
- European Equities 3% (5%)
- UK Fixed Interest 0% (2%)
- Cash 13% (24%)
- Alternative Investment Strategies 20% (15%) (including absolute return)
- Emerging Market Fixed Interest 0% (1%)
- Property 11% (0%) - most of which is equities in the US.
If you are looking for the notional high and low-risk versions of my £50k portfolio which are often published with these updates then see the question and answer (regarding their omission) in October's Chatterbox.

£200 Pension Cashback Offer
Make a qualifying deposit or transfer a pension to our partner Interactive Investor.
- Deposit or transfer a pension of at least £20k and you could earn £200 cashback
- Terms and Fees apply, Capital at risk
- New & Existing customers opening a SIPP
- Offer ends 31st July 2026
Before starting your transfer, check you won't lose any valuable benefits (such as guaranteed annuity rates or a lower protected pension age) and find out what exit fees you might have to pay
