

The background to my portfolio
Back in March 2015 I decided to invest £50,000 of my own money using 80-20 Investor. The purpose was twofold, firstly to show how you can use 80-20 Investor to invest and outperform the market with only a few minutes effort every now and then. Secondly, no other investment commentator, journalist or research provider invests their own money for fear of failing. This is a sorry state of affairs and is precisely why I committed to openly running my own portfolio for 80-20 Investor members to see.
Since then I have periodically changed my portfolio using the fund suggestions provided by the 80-20 Investor algorithm and associated research. I always disclose the changes at the time they are made.
Performance update
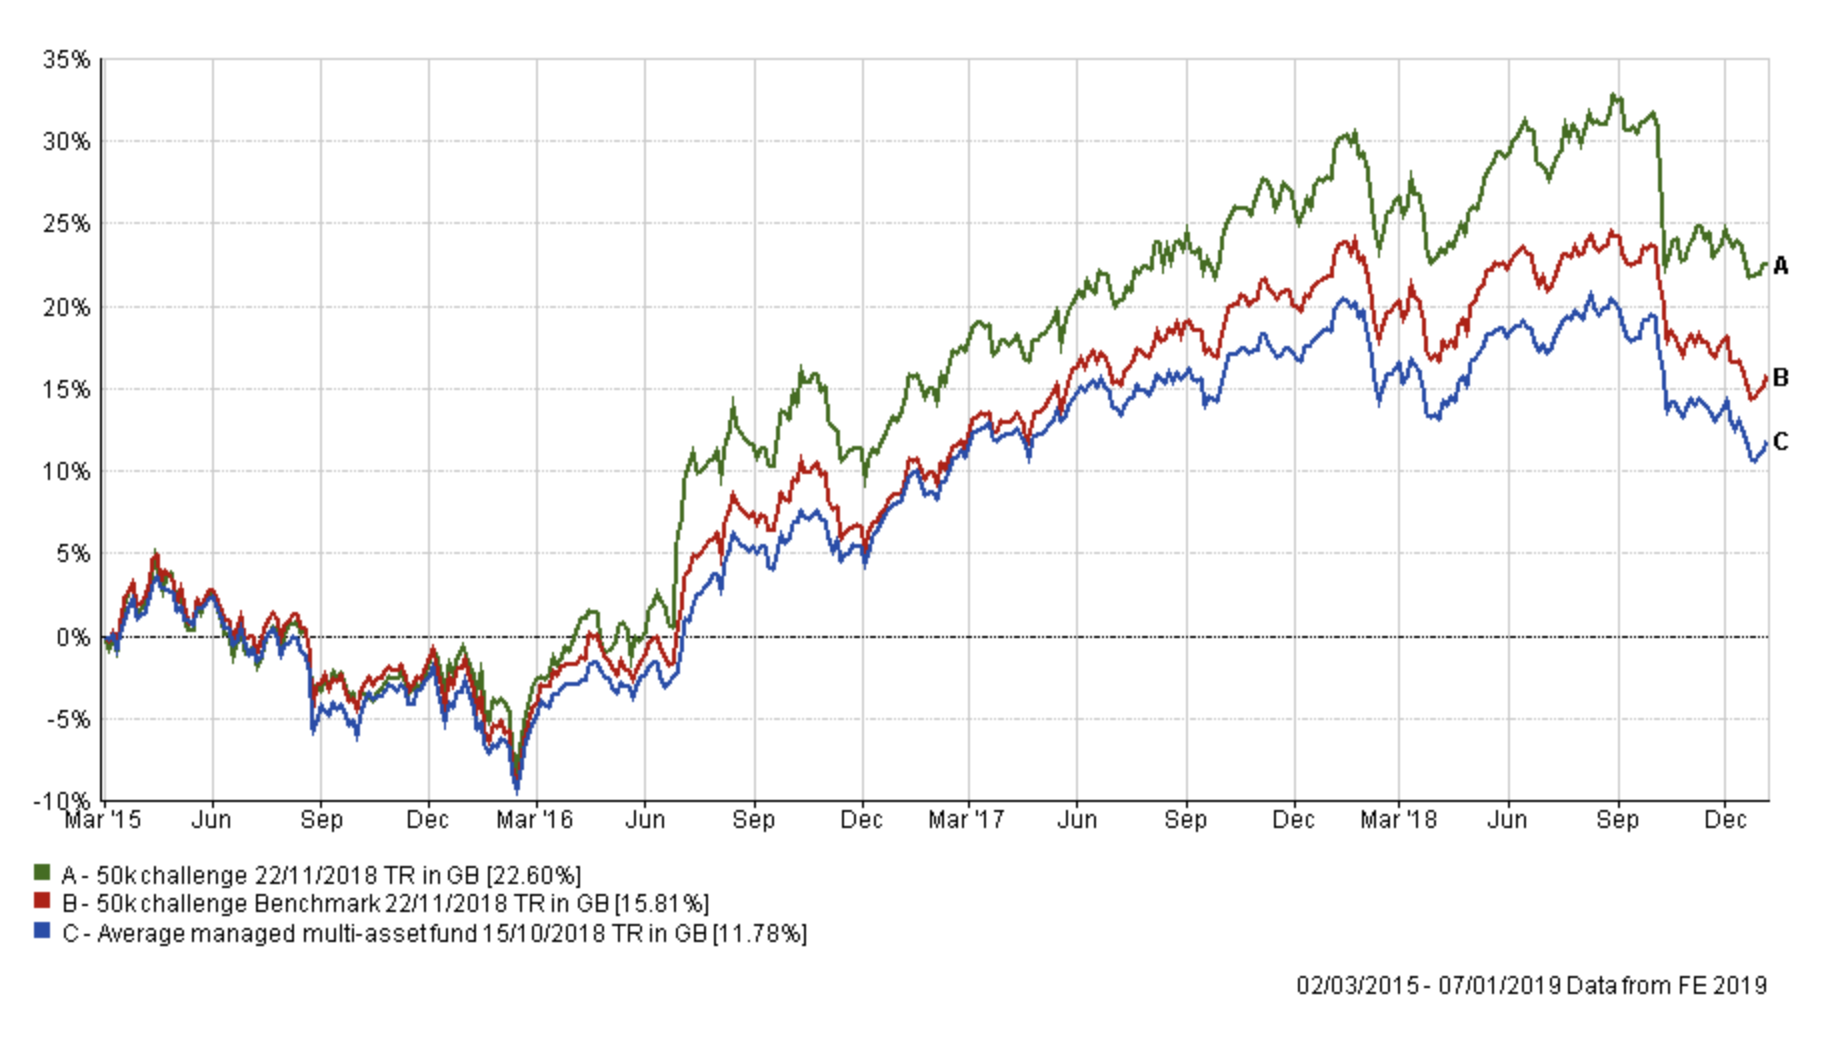
As is usual in my portfolio reviews, the chart below shows how my portfolio has outperformed since I started the challenge in March 2015, three and a half years ago. The green line is the performance of my portfolio while the red line is the benchmark showing the average return achieved by professional fund managers given the same asset mix. To accurately calculate this I have used the average return for each sector in which my portfolio invested. The blue line shows what the average multi-asset fund with comparable equity content achieved. In other words, the red line would show the extra performance added by just the asset mix of my portfolio (where I was invested i.e European equities etc) over picking a typical multi-asset fund (the blue line). While the green line (which is my actual performance) shows the impact of being in the right funds at the right time, as identified by the 80-20 Investor algorithm.
Taming the Bear
If you look at the right-hand side of the chart above you can see how my portfolio outperformed its benchmarks after the initial leg down at the start of October. Of course going into that initial sell-off my portfolio was riding momentum higher and so it underperformed its benchmarks during the initial drop as discussed at the time.
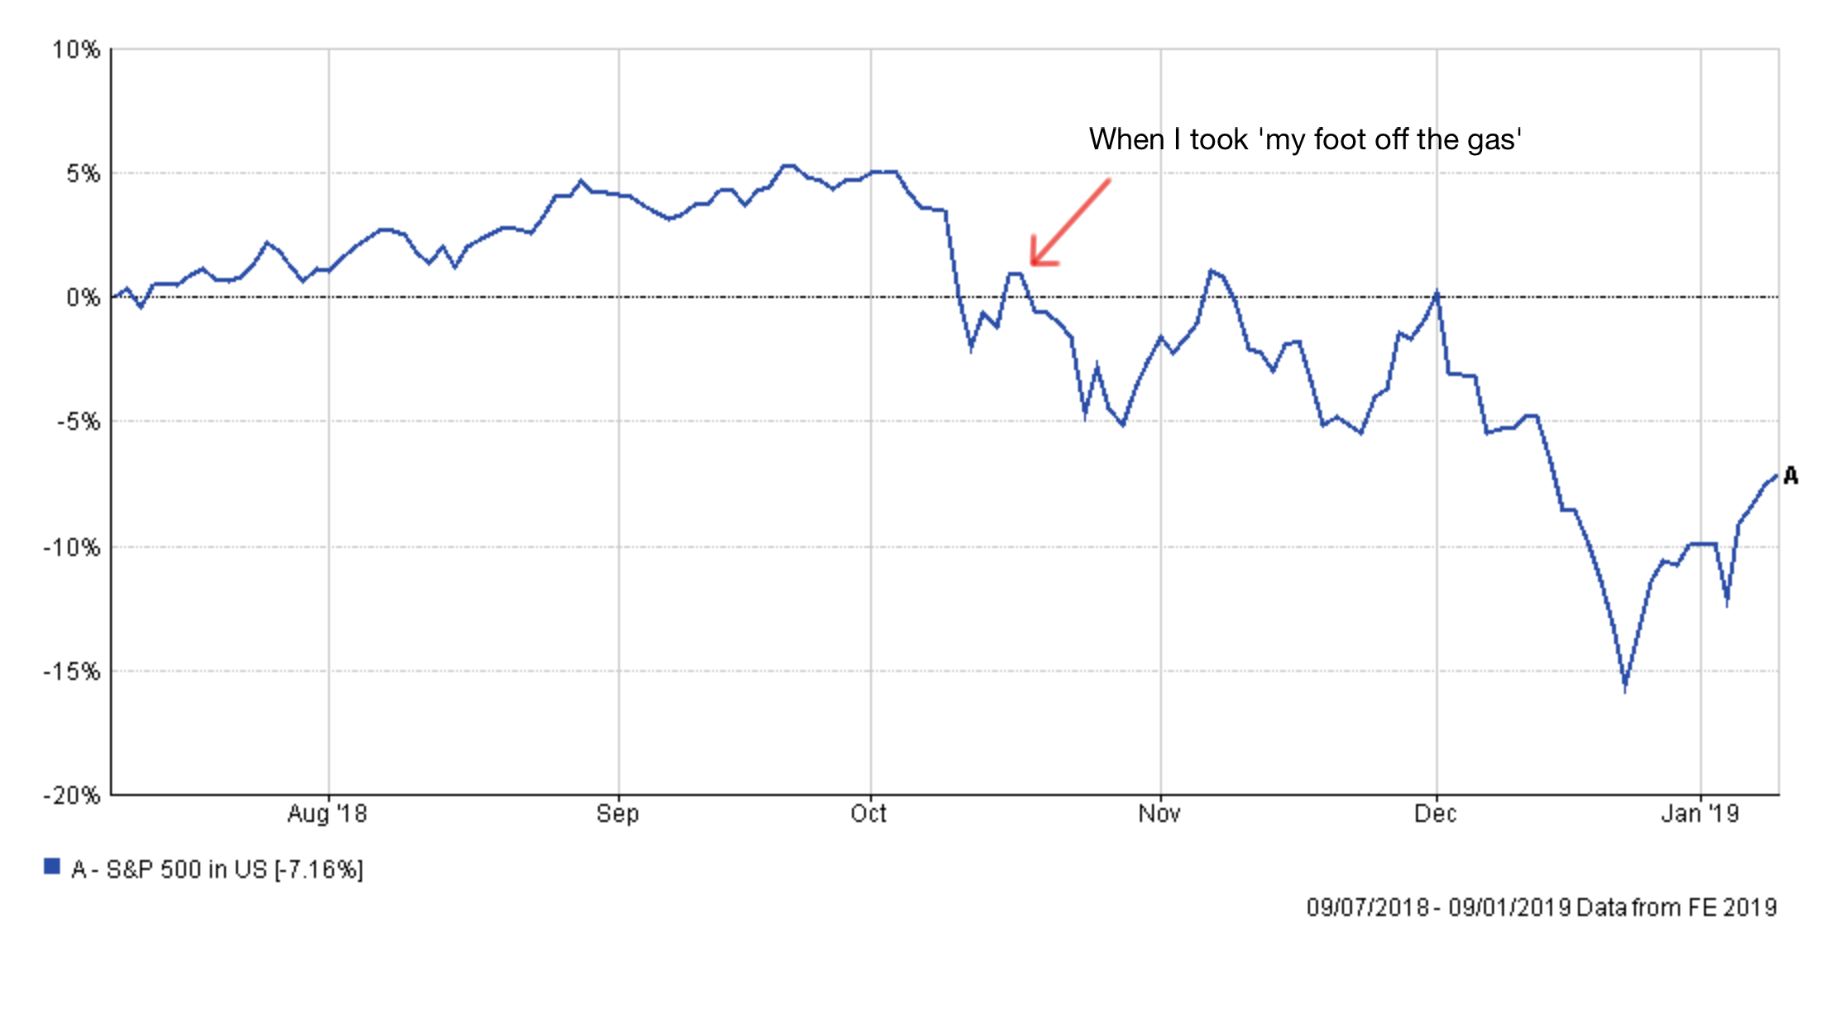
As the market attempted to rebound I then 'took my foot off the gas' and dramatically reduced my equity exposure, increased my cash position and bond exposure and took a short position on European equities. The chart below shows exactly when I did that. The blue line is the S&P 500 and shows how the market sell-off unfolded. After I made the change you can see there were two attempts at a stock market rebound later at which point commentators claimed that the sell-off was over and the market would head higher. With the benefit of hindisght, we now know that didn't happen and the market collapsed just before Christmas to hit a new low on Christmas Eve (the lowest point on the graph)
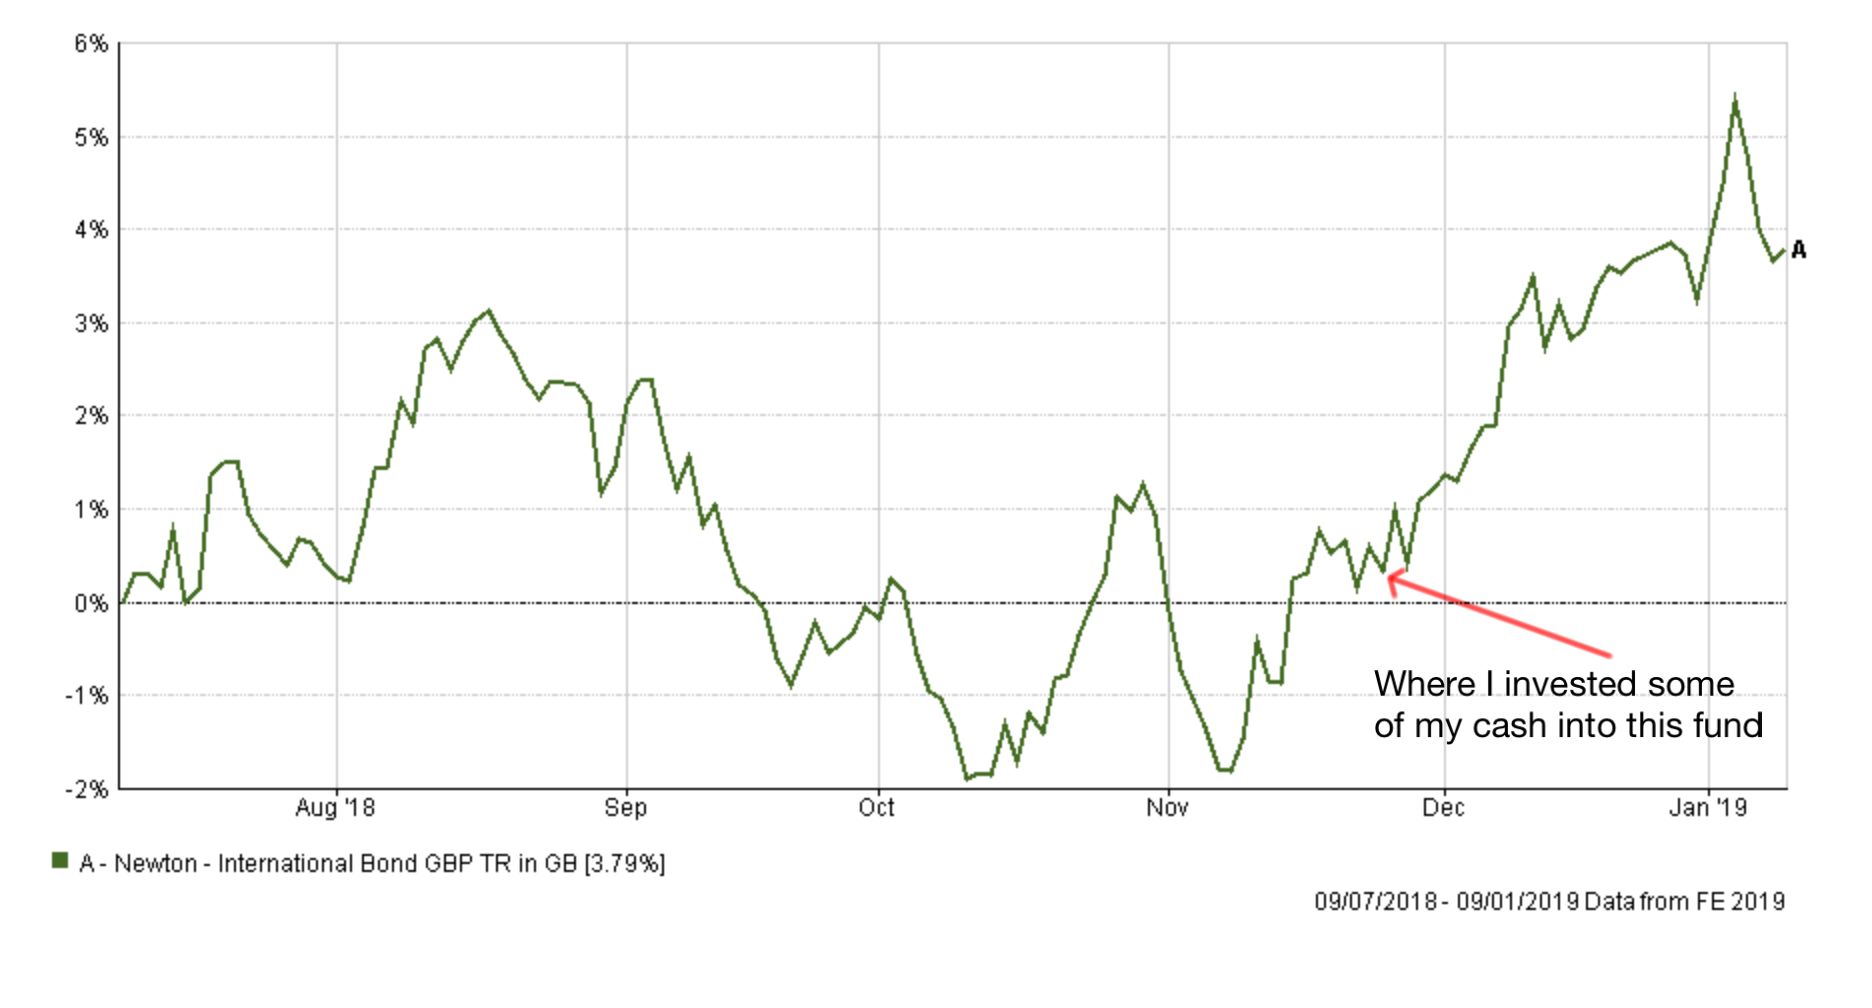
In November you will recall that I also put a little cash to work and bought into the Newton International Bond fund, in line with the BOTB. The chart below shows the performance of the fund after I made that trade. It was great timing.
While my portfolio is net long in stocks the chart shows how my portfolio fared against the average professionally managed Multi-Asset fund right up until the market low on Christmas Eve.
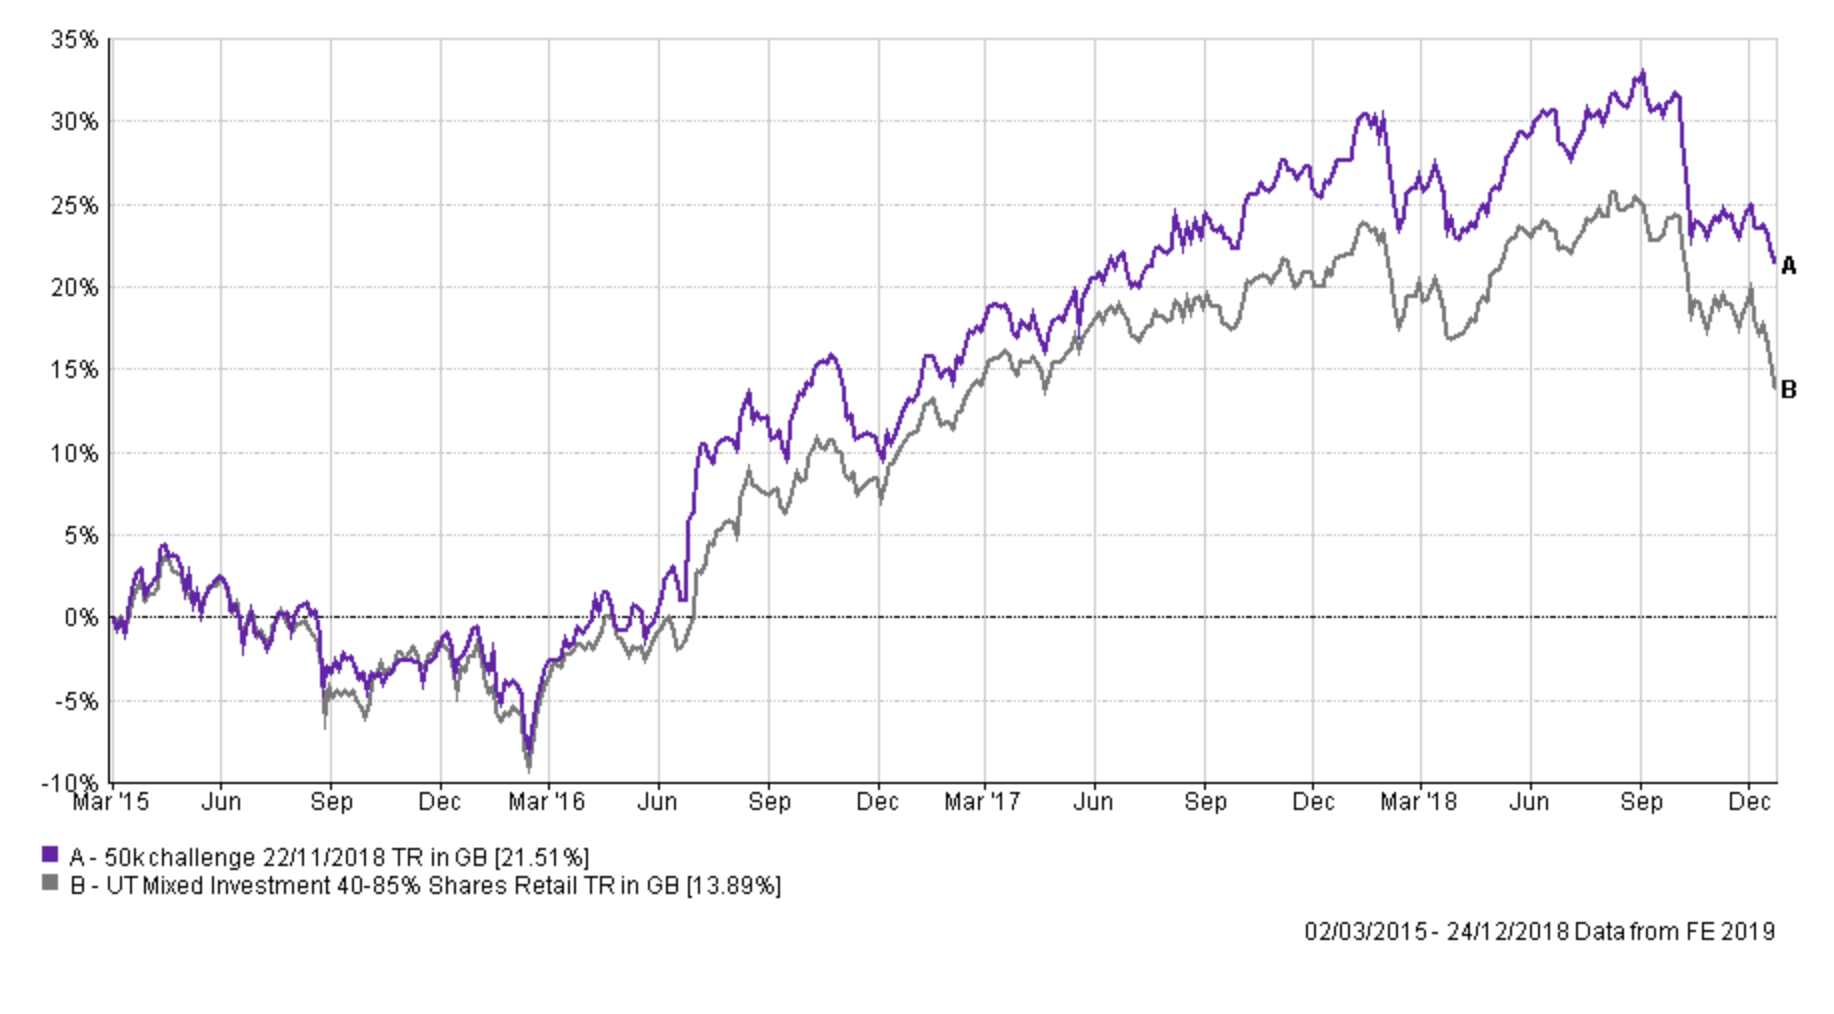
You can see how my portfolio held up much better during the second leg down in equity markets. The reason that I am highlighting this is to show how well the 80-20 Investor process has fared during what many are calling an unfolding bear market. I had no powers of foresight of how the market would move but simply followed the trend, which was out of equities. Of course, as equity markets fell my portfolio lost value as I still have some equity exposure. However, relative to the aforementioned professionally managed multi-asset funds, the fall in my portfolio was much smaller and I began to outperform them simply by preserving capital. At the market low on Christmas Eve my portfolio performance meant that I was outperforming almost 90% of those professionally managed funds. Don't forget that most of those funds have had up to 85% equity exposure over the last 3 and a half years whereas my portfolio typically only has between 50-65% (although currently, it's nearer 40%). So I made greater returns while taking less risk.
Of course, if markets had rallied rather than collapse then I would have lagged other funds. In fact as shown in the earlier chart, stock markets have had the best start to a new year for nearly a decade which means that my portfolio has not rallied as much in the first week of 2019. However, many professionally managed funds continue to play catchup hoping that the market rallies higher from here in order to recoup December's loses. If equity markets go higher then my portfolio will rise too, but will lag those funds with greater equity exposure. Conversely, if the market collapses further then my portfolio will preserve capital better. I wanted to highlight this outperformance during this market downturn for historical record as it will serve as a good reference point in the future for how 80-20 Investor helped my portfolio performance during a severe sell-off. So far so good.
What is interesting is that the strong market rally since the New Year leaves equity markets at a critical juncture again. The VIX (a measure of the market fear) has plummetted back under the historical average. Traders are now turning decidedly bullish and are starting to buy the dips again. However, much still depends on economic data (to allay growth concerns), the Fed and the China trade deal.
In this environment, it is tempting to follow your emotions and the headlines, which is why I am sticking to the process and will look to reduce my equity exposure, in the same way as the BOTB has. Despite the short term new year rally, the medium term downtrend in stocks is still intact for now. If the market stages a recovery and pushes to new highs then this will eventually show up in the 80-20 Investor momentum algorithm at which point I will alter my portfolio accordingly. I am happy to miss the early stages of any bounce if it means avoiding a potential bear market trap (assuming we are in a bear market of course).
Usually, I present a colour coded table detailing which funds within my portfolio are in the BOTB and which are still in the BFBS. However, this time I will instead run through each fund holding to discuss its inclusion in my portfolio.
Man GLG Corporate Bond & Newton International Bond
Both bond funds have been strong performers and remain in the BOTB and the BFBS tables. At the moment the 80-20 Investor algorithm is identifying few equity investment opportunities but global bonds have presented an opportunity. US Treasuries enjoyed an eye-watering rally during the equity sell-off in December. Global bonds funds (such as the two I invest in) with significant exposure to US Treasuries performed strongly. That is despite the pound finding some support and moving higher against the dollar. It currently sits around $1.275. If the pound weakens it tends to give these funds a performance boost due to the currency exposure. For now, I see no reason to remove these funds from my portfolio given their strong performance
BlackRock European Absolute Alpha & Newton Real Return
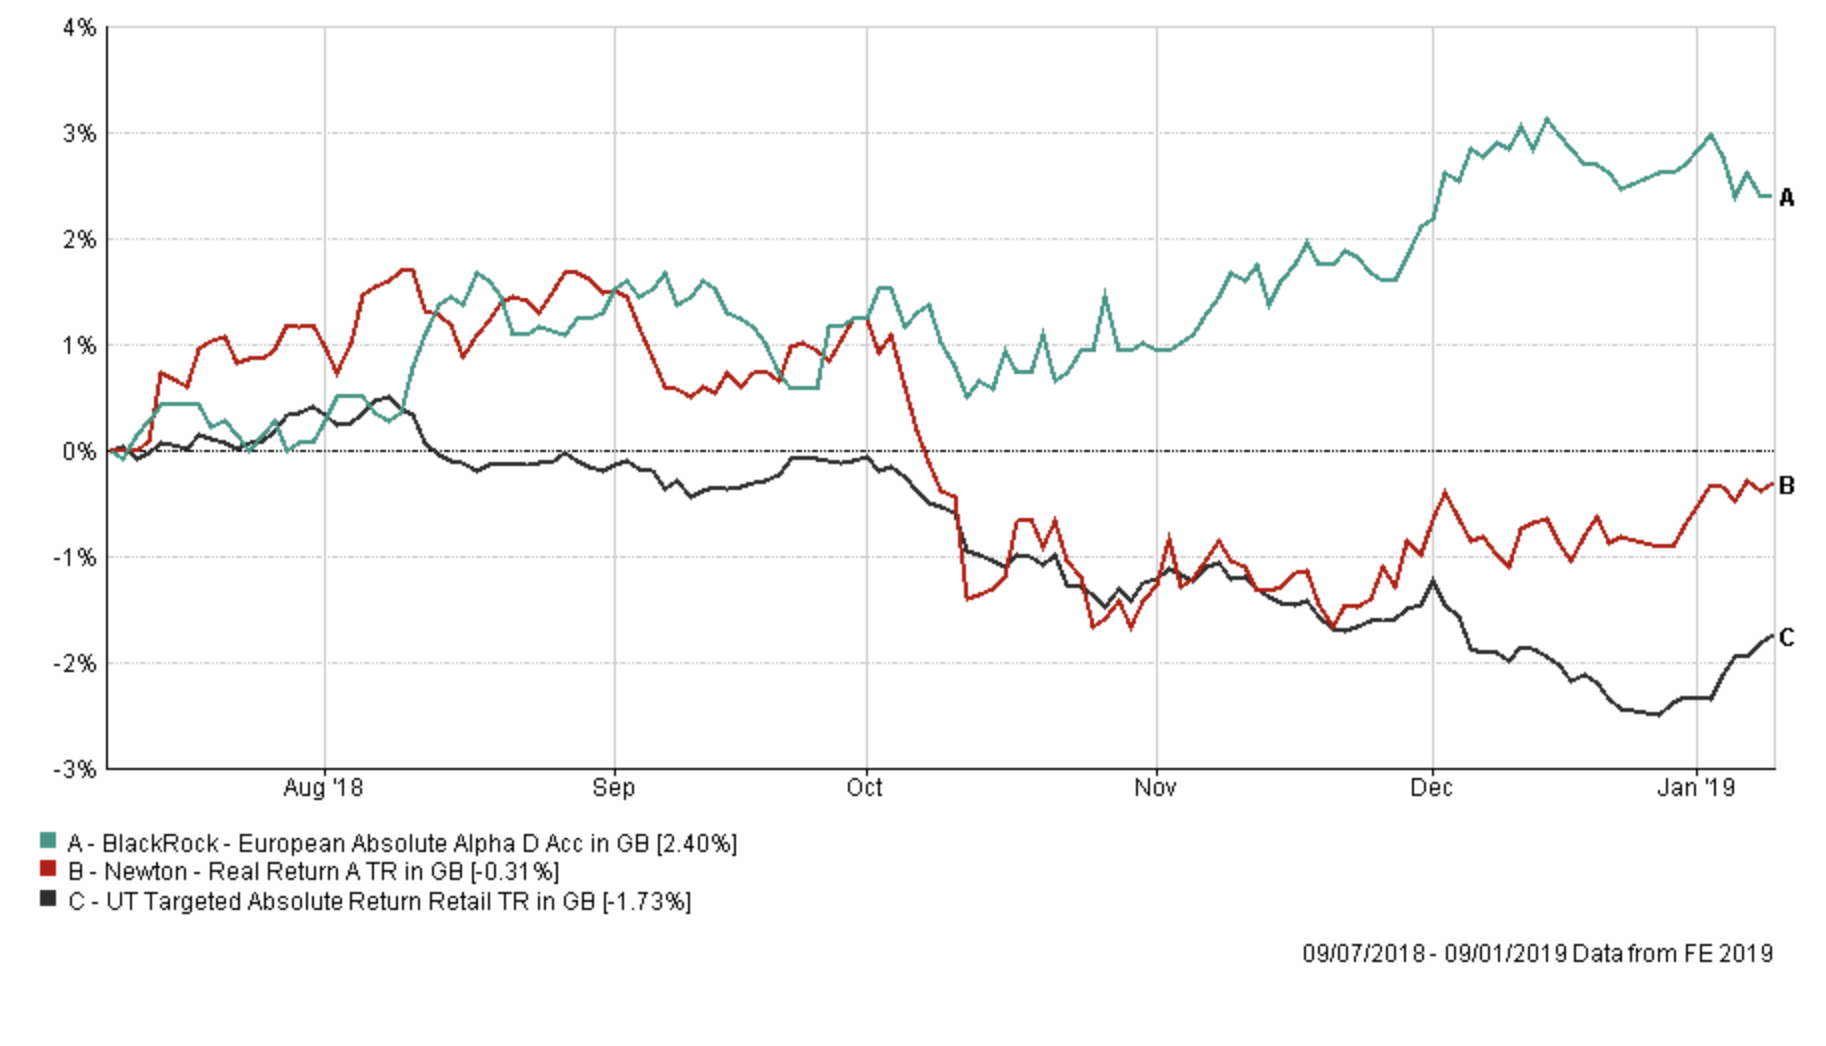
The Blackrock fund remains in the BOTB while Newton Real Return sits in the BFBS tables. The chart below shows how both funds have performed in my portfolio over the last 6 months versus their sector average. The Blackrock fund has performed fantastically well in the face of equity market weakness. The Newton fund's performance is clearly influenced by equity market returns and its strong performance in December (when equity markets tumbled) turned its fortunes around. Again I see no need to change either holding at present.
LF Canlife North American
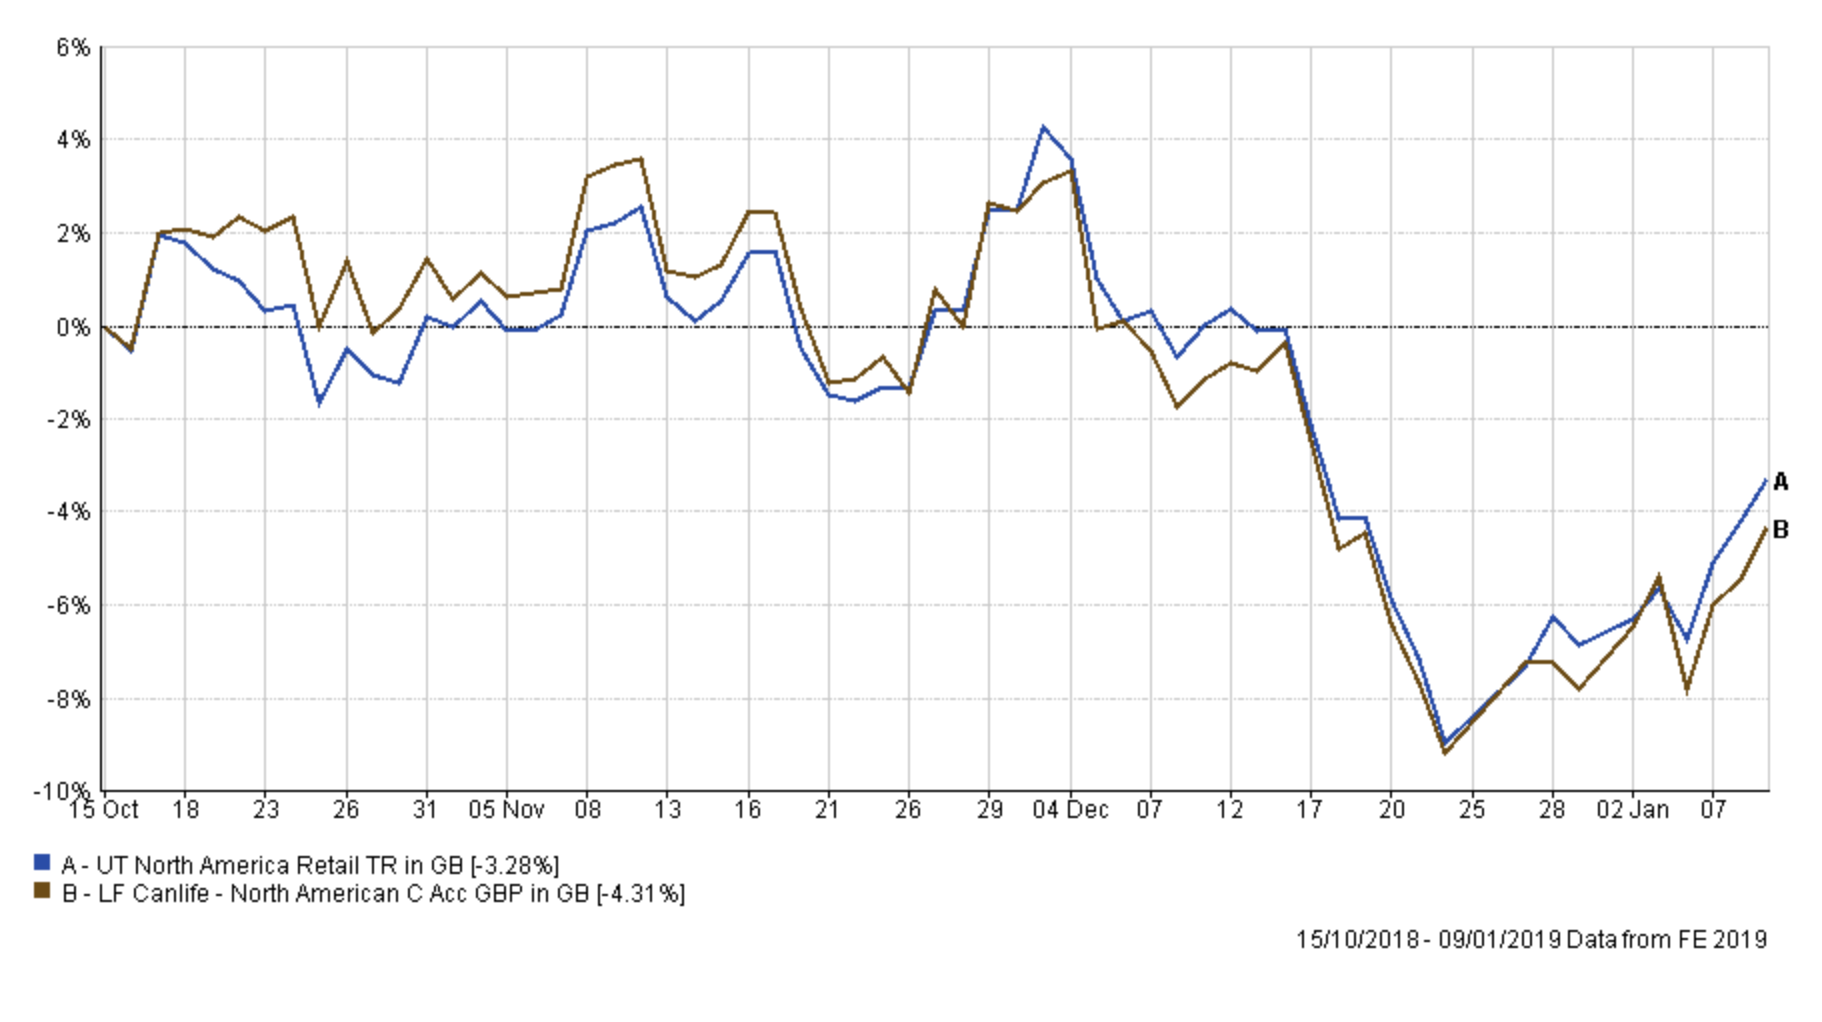
As the chart below shows this fund has not set the world alight since I've held it. It's mostly tracked the sector average over the last 3 months but ultimately lags it. The fund is no longer in the BFBS or BOTB tables, unsurprisingly. That doesn't automatically make it a bad fund (as the algorithm factors in holding funds for up to six months at a time) but I would ordinarily be inclined to consider making changes. I previously reduced my US equity exposure back in October and the current BOTB portfolio has fallen in line with that since. As US equities were one of the worst performing equity markets in December my underweight exposure (versus multi-asset funds) benefited my performance. While I would normally look to change my US equity fund there are a no suitable alternatives (at the time of writing there are none in the BFBS) and selling out of the fund completely would mean I had no US equity exposure, which isn't ideal. So, for now, I will put this fund on my watchlist with a plan to review its inclusion next time and make changes if necessary.
FP - Octopus UK Micro Cap Growth
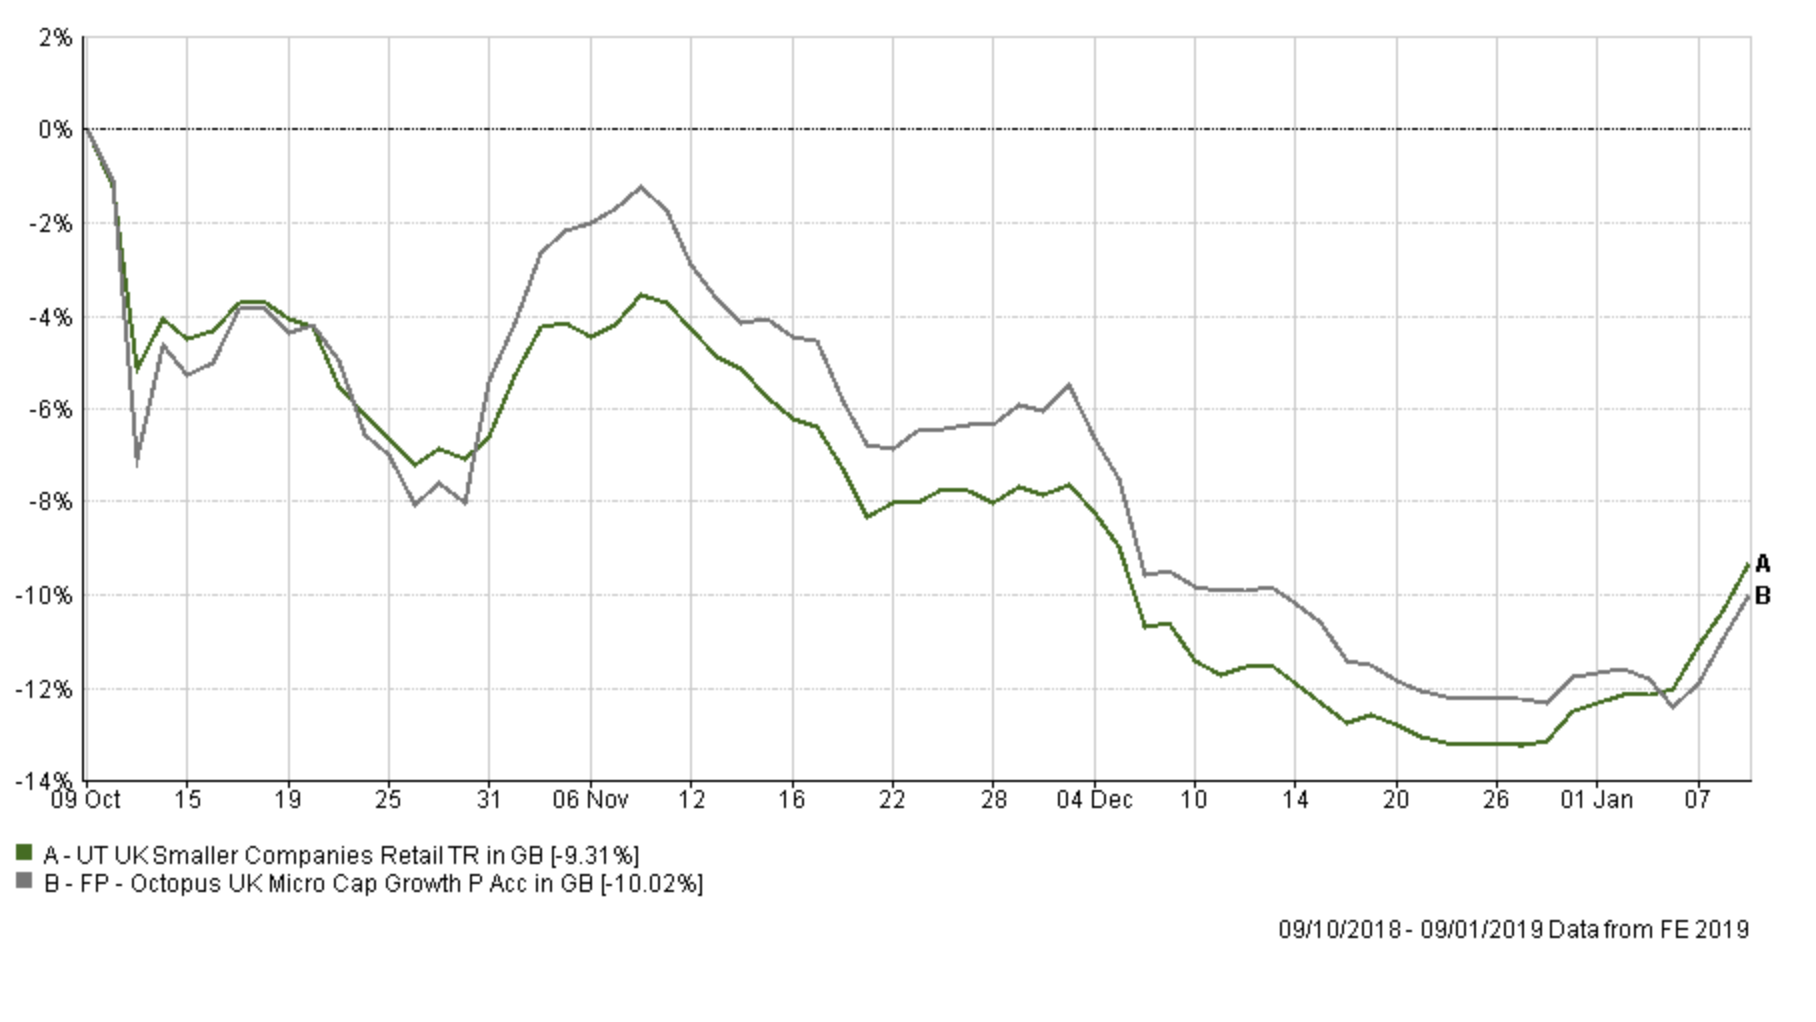
Earlier on I talked about how my portfolio tweaks worked well as equity markets collapsed in December. However, here is an example of when something didn't work out. The chart below shows the performance of this fund, which I bought just as the stock market weakened in October. The fund is down 10% which is indicative of the sector itself and smaller companies generally. During the equity market sell-off smaller companies stocks around the globe were hit the hardest as concerns over global growth increased. With the benefit of hindsight I could have avoided the pain if I had moved out of the fund earlier, but such is life. As I have said before, the aim is to get more right than you do wrong which is why my portfolio held up well in December nonetheless. It was also helped by the fact that this fund only accounted for 5% of my portfolio so the 10% loss on the fund only equates to a 0.5% fall for my overall portfolio. Not a lot but a loss nonetheless. Unsurprisingly I plan to switch out of this fund (which isn't in the BOTB or BFBS tables) and the sector as a whole. No one wants to crystalise a loss, but hope of a rebound isn't a profitable investment strategy.
CFP SDL UK Buffettology
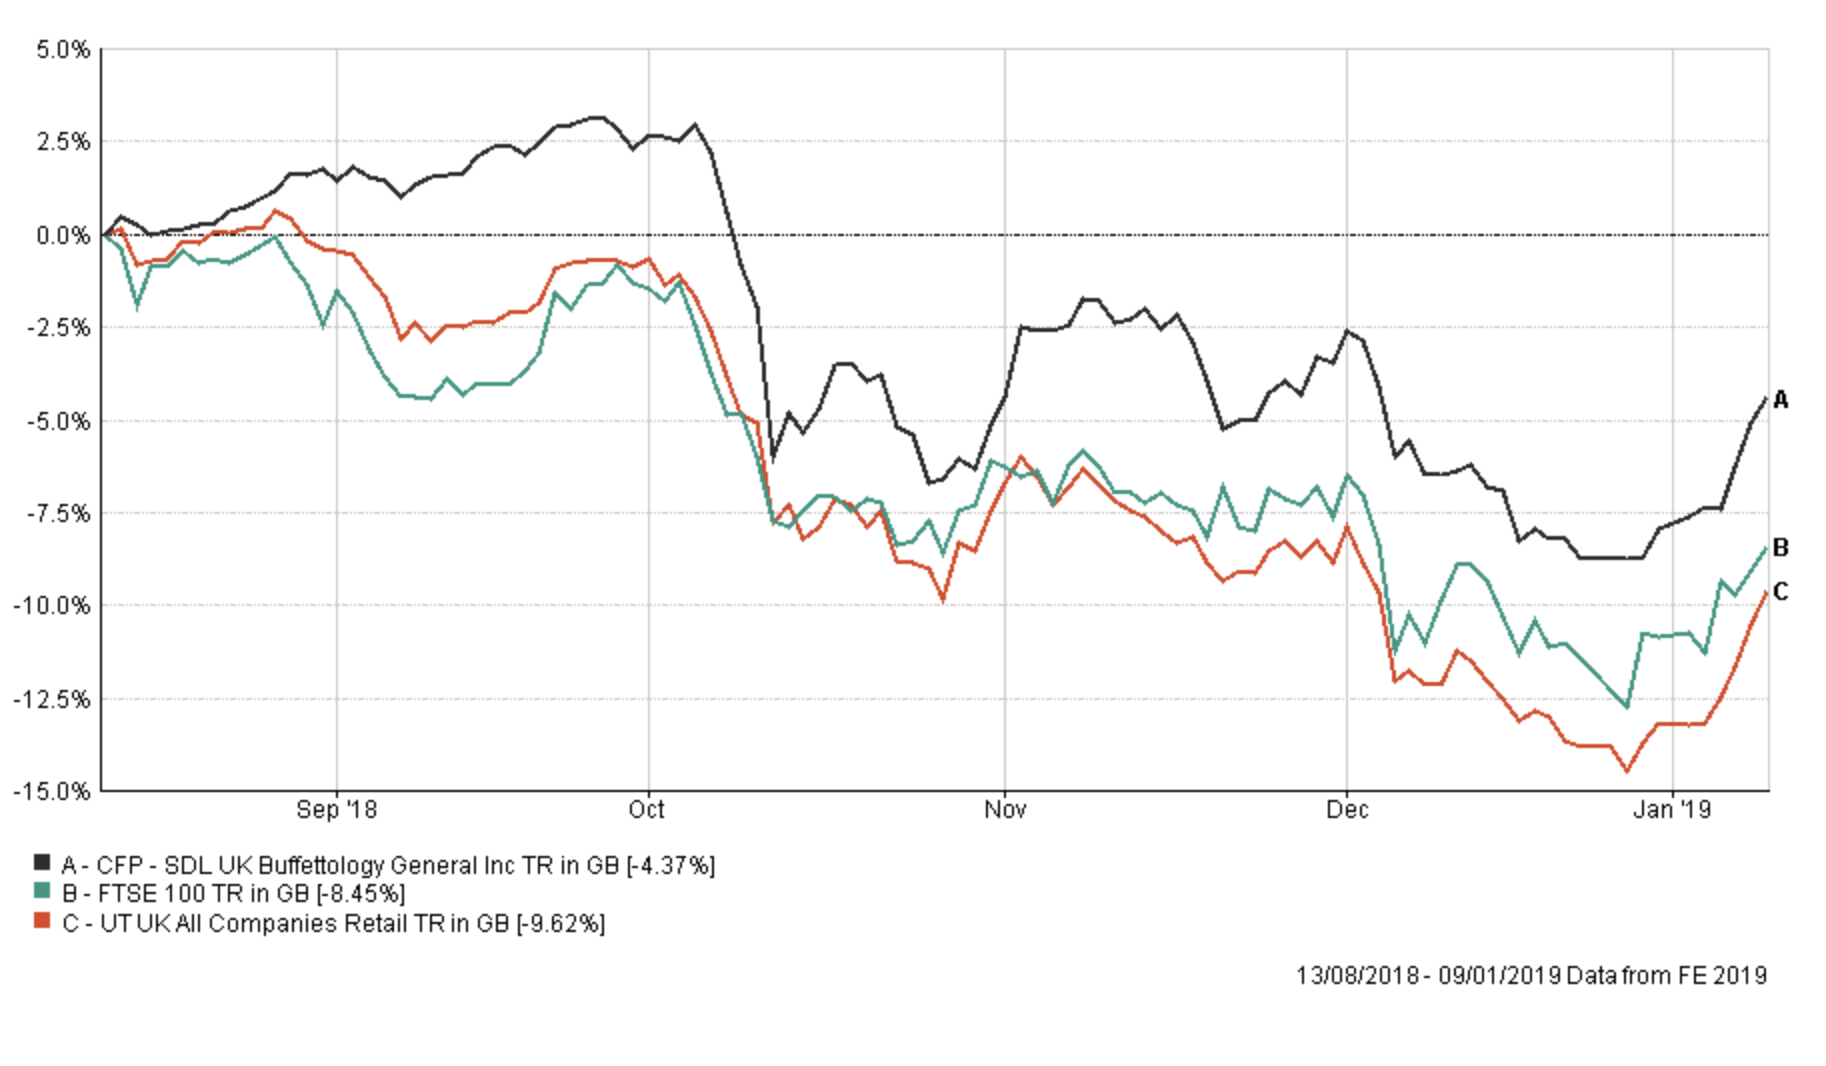
This fund has significantly outperformed its peer group. In fact out of the 232 funds within its sector it ranks 5th for performance over the period since I've held it. Part of that has to do with its value approach which has been a benefit during a period where high valued growth stocks have capitulated. Of course, the fund has still lost money, but the chart below gives its performance some context. The fund is no longer in the BOTB or BFBS having only recently dropped out, but no UK equity fund is the 80-20 Investor shortlists given the market backdrop. Having already decided to reduce my UK equity exposure by switching out of FP Octopus UK Micro Cap Growth I will hold on to this fund for now and will review the situation next time. Given the volatility in markets right now I am opting to drip out (reduce UK exposure gradually). If there was a UK equity fund to still hold right now this remains one of the strongest contenders.
JPM Japan
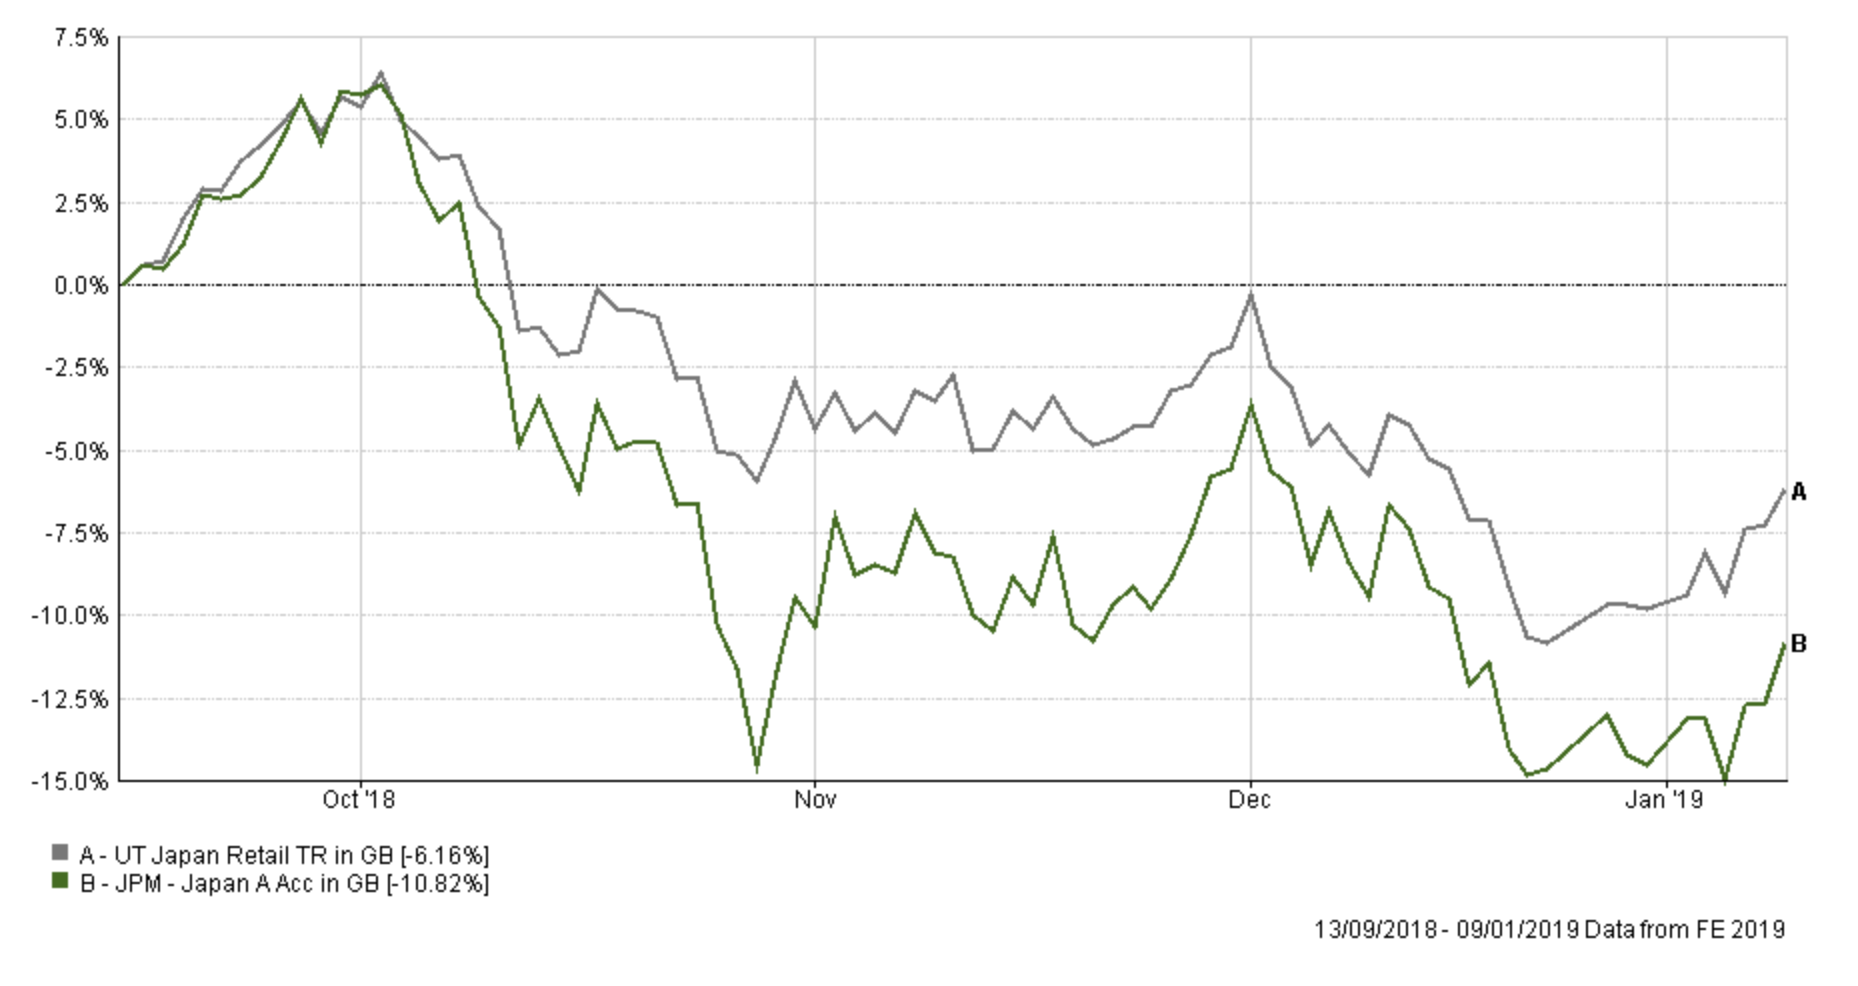
The chart below shows the performance of the JPM Japan fund since I've held it versus the sector average. At the time of buying the fund I halved my portfolio's Japanese equity exposure as momentum faded from the sector as a whole. But as the chart shows the performance of the fund has been poor (and more than 7% below the Japanese fund it replaced in my portfolio). Again it's a good example of how you can't win them all and the key is to try and get more right than you do wrong. If you get it wrong, learn from it, dust yourself down and move on. As such I am selling out of the fund as Japanese equities continue to struggle as evidenced by their omission from the BOTB and BFBS.
Thesis TM Sanditon European Select & LF Miton European Opportunities
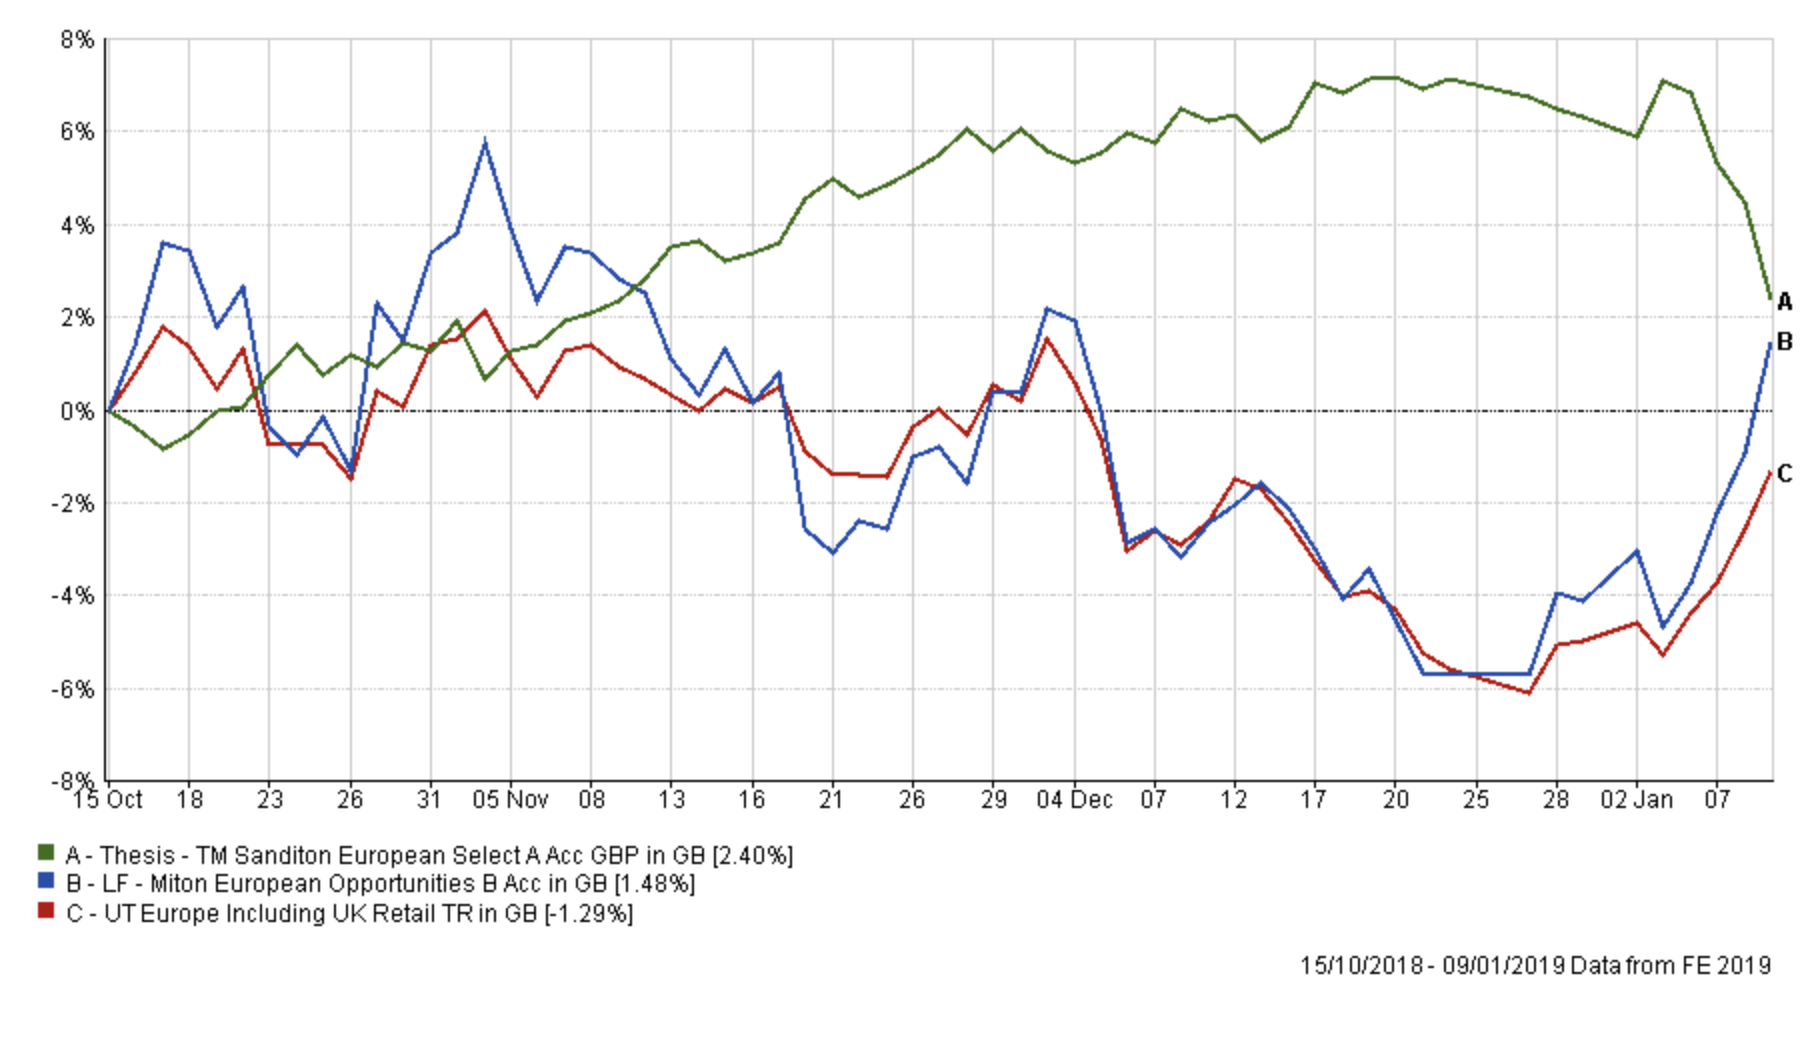
These two funds have provided my exposure to European equities. The chart below shows how they have performed, since I invested in the Thesis fund, versus the average European equity fund. The Thesis fund effectively shorts the European stock market while the LF Miton fund is a standard European equity fund. While the LF Miton fund has fallen out of the BOTB and BFBS tables it has managed to outperform its sector average over the period shown. Generally speaking, its performance has been reflective of the performance of European equities, but with a higher level of volatility. If you look back at December's portfolio review I had earmarked the LF Miton fund as a possible fund to remove.
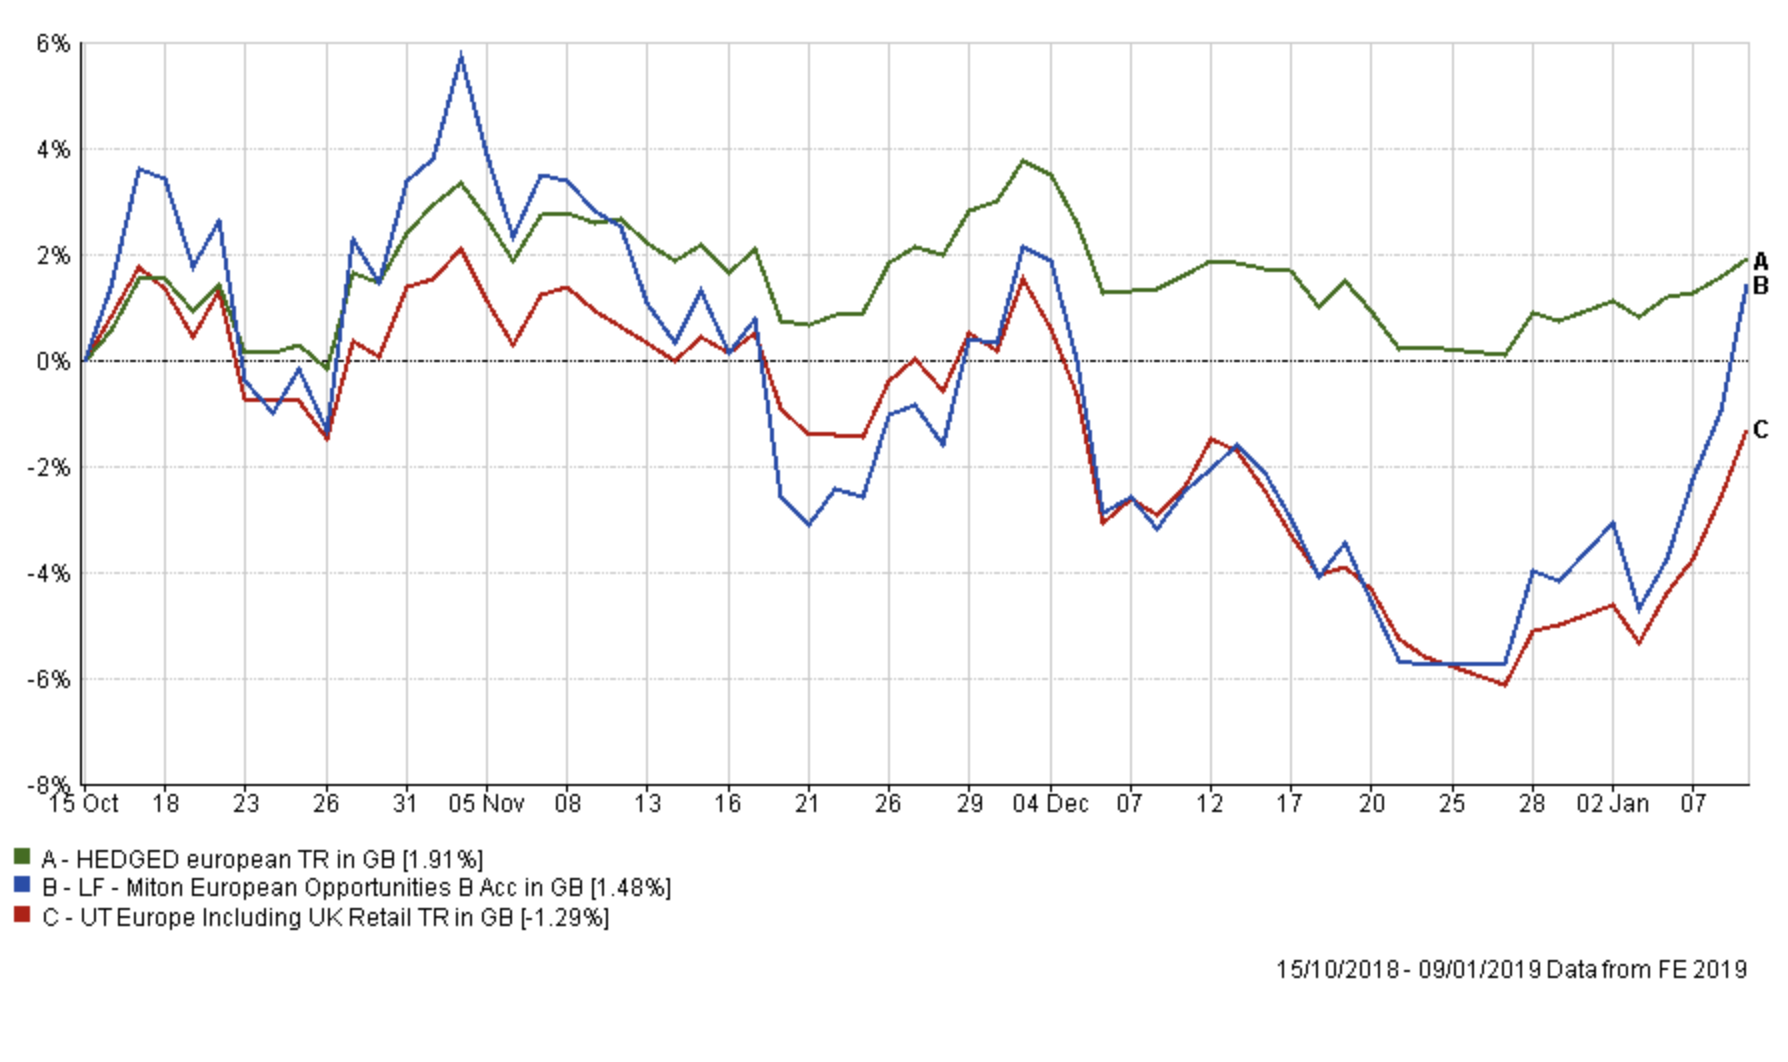
However, if you consider the chart below it shows an interesting and deliberate dynamic. When I invested in the Thesis fund back in October it was a result of selling 60% of my LF Miton holding at the time. The chart below shows how my current European Equity exposure (called the hedged fund) via a combination of the LF Miton funds and the Thesis fund compares to the European equity sector average and the scenario had I just remained 100% invested in the LF Miton fund. The outperformance and lack of volatility are stark. For now, with markets at a critical juncture, I see no reason to change this tactic.
Cash
My cash holding is at around 20% and remains available to invest should we get confirmation that the equity market has regained upwards momentum. If the upward momentum we've seen at the start of the year can continue then I will look to put this money to work via opportunities identified by the 80-20 Investor algorithm. The fact that the current BOTB only has 24 funds shows that cash is a viable destination and has been one of the only assets classes to make money since the market wobble in October.
Fund switches
The portfolio changes this time are again minor. My portfolio has performed well as the equity market sell-off accelerated towards Christmas. The market is now making an attempt to break higher, but still has work to do if it is to avoid another rollover. I plan to sell out of the two funds I highlighted that have been poor performers and move the proceeds into the global bond funds which have performed well. This will reduce my equity exposure to the lowest level it has ever been at 28%. I run the risk that the market will suddenly break higher but the fear of missing out is not a profitable investment process. I am happy to stick to a non-emotional process as I can not predict the future path of investment markets and the possibility of a more severe market crash still remains on the table. As ever my asset mix is led by that of the BOTB.
The switches I am carrying out are:
- 100% out of FP Octopus UK Micro Cap Growth and 100% into Newton International Bond
- 100% out of JPM Japan and 100% into Man GLG Corporate Bond
I was torn between putting the proceeds into Emerging Market Bond funds in line with the BOTB but for simplicity I thought I'd consolidate into existing winning positions, bringing my overall bond exposure still in line with that of the BOTB. I am still loathed to invest in property unit trusts for fear of a repeat of the suspensions and exit penalties that investors faced when Brexit angst rose in 2016. Brexit itself is now supposedly less than two months away.
My portfolio
My portfolio now looks like this:
| Fund | Allocation % | Risk | Sector | ISIN Code | SEDOL Code | Citicode / TIDM |
| BlackRock European Absolute Alpha | 8 | Low | Targeted Absolute Return | GB00B4Y62W78 | B4Y62W7 | EYN0 |
| CFP SDL UK Buffettology | 12.8 | Medium | UK All Companies | GB00B3QQFJ66 | B3QQFJ6 | MJZ1 |
| LF Miton European Opportunities | 4 | High | Europe Excluding UK | GB00BZ2K2M84 | BZ2K2M8 | MSED |
| Newton Real Return | 6.9 | Low | Targeted Absolute Return | GB0001642635 | 164263 | BS97 |
| Thesis TM Sanditon European Select | 6 | Medium | Targeted Absolute Return | GB00BNY7Y722 | BNY7Y72 | KMPQ |
| Man GLG Corporate Bond | 15.6 | Low | Global Bonds | GB00B0118B85 | B0118B8 | AX76 |
| LF Canlife North American | 12.2 | High | North America | GB00B73N3278 | B73N327 | 0YMD |
| Newton International Bond | 15 | Low | Global Bonds | GB0006779655 | 677965 | RZ04 |
| Cash | 19.5 | Low | N/A | N/A | N/A | N/A |
My asset mix
This means my asset mix is as follows (previous asset mix is in brackets):
-
- UK Equities 11% (17%)
- North American Equities 13% (14%)
- Global Fixed Interest 29% (22%)
- Japanese Equities 0% (3%)
- Other International Equities 0% (0%)
- Asian equities 0% (1%)
- European Equities 5% (5%)
- UK Fixed Interest 2% (0%)
- Cash 24% (23%)
- Alternative Investment Strategies 15% (15%)
- Emerging Asia equities 0% (0%)
- Emerging Market Fixed Interest 1% (0%)
- Property 0% (0%)
If you are looking for the notional high and low-risk versions of my £50k portfolio which are often published with these updates then see the question and answer (regarding their omission) in October's Chatterbox.

£200 Pension Cashback Offer
Make a qualifying deposit or transfer a pension to our partner Interactive Investor.
- Deposit or transfer a pension of at least £20k and you could earn £200 cashback
- Terms and Fees apply, Capital at risk
- New & Existing customers opening a SIPP
- Offer ends 31st July 2026
Before starting your transfer, check you won't lose any valuable benefits (such as guaranteed annuity rates or a lower protected pension age) and find out what exit fees you might have to pay
