

The background to my portfolio
Back in March 2015 I decided to invest £50,000 of my own money using 80-20 Investor. The purpose was twofold, firstly to show how you can use 80-20 Investor to invest and outperform the market with only a few minutes effort every now and then. Secondly, no other investment commentator, journalist or research provider invests their own money for fear of failing. This is a sorry state of affairs and is precisely why I committed to openly running my own portfolio for 80-20 Investor members to see.
Since then I have periodically changed my portfolio using the fund suggestions provided by the 80-20 Investor algorithm and associated research. I always disclose the changes at the time they are made.
Performance update
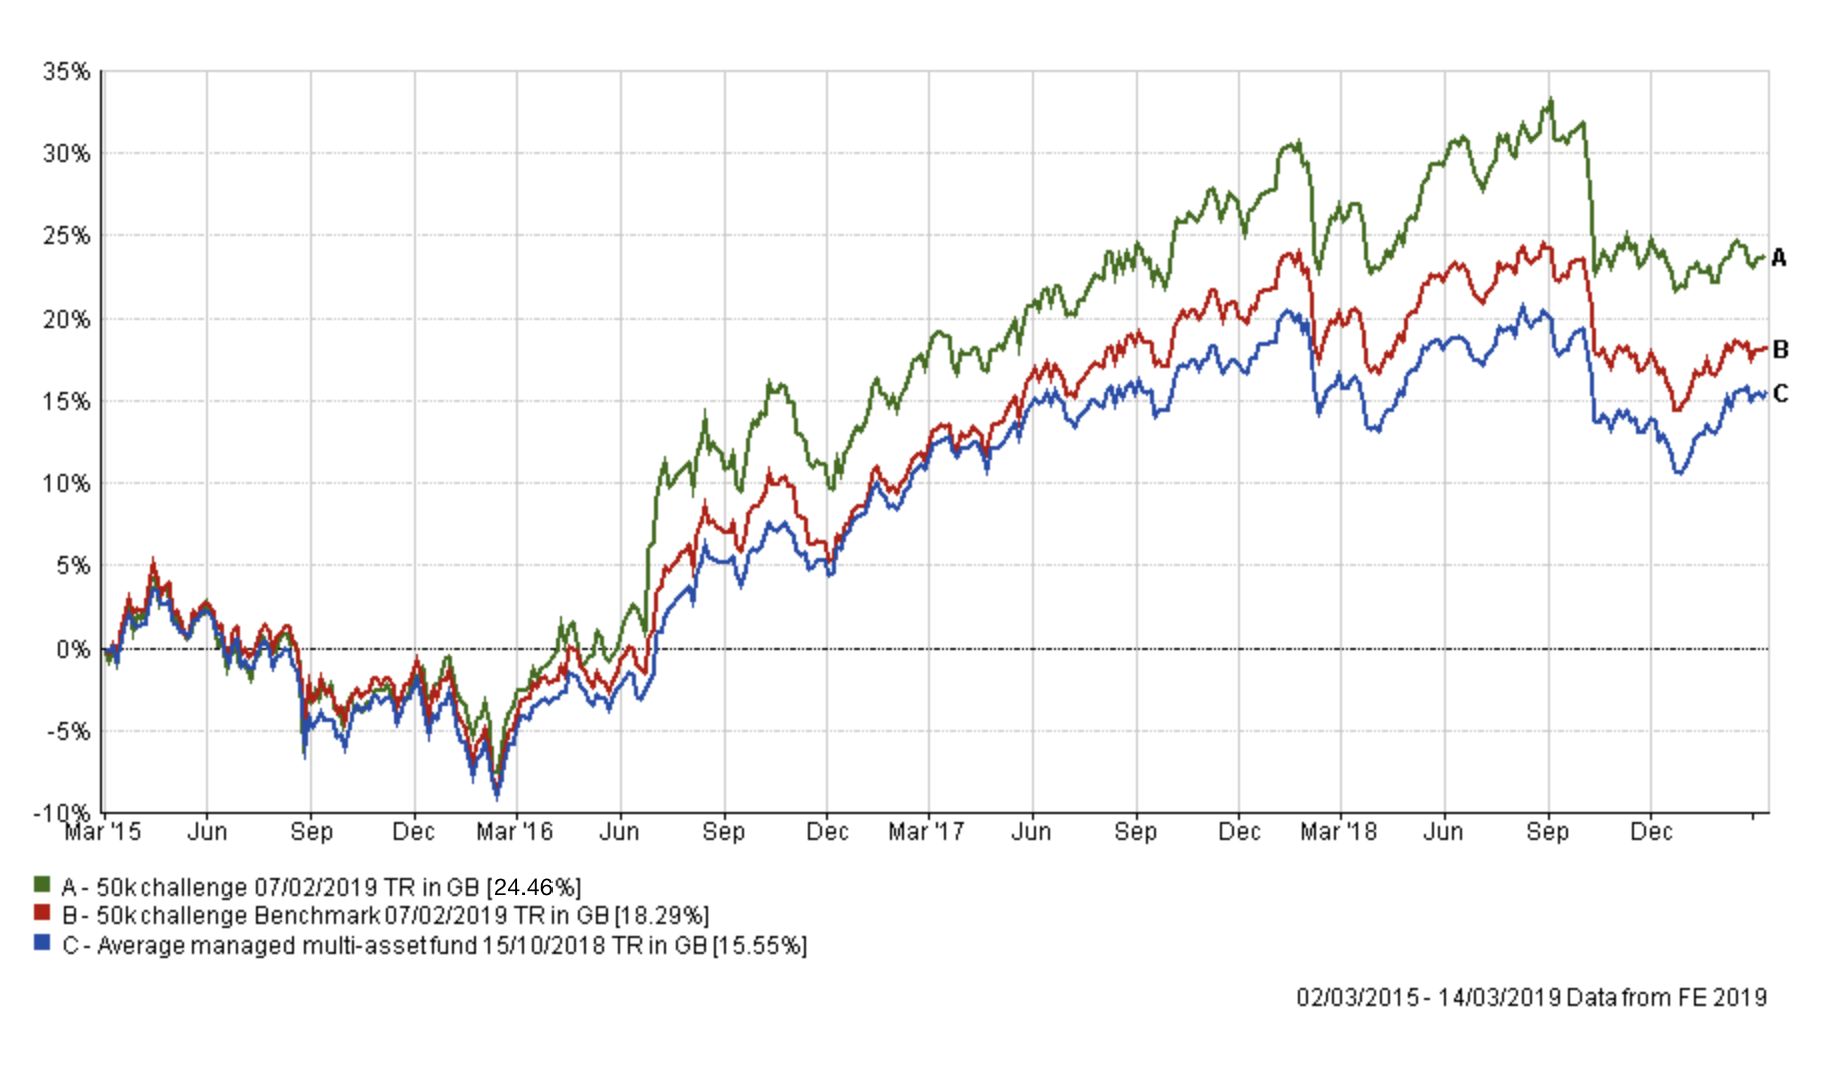
As is usual in my portfolio reviews, the chart below shows how my portfolio has outperformed since I started the challenge in March 2015, four years ago. The green line is the performance of my portfolio while the red line is the benchmark showing the average return achieved by professional fund managers given the same asset mix. To accurately calculate this I have used the average return for each sector in which my portfolio invested. The blue line shows what the average multi-asset fund with comparable equity content achieved. In other words, the red line would show the extra performance added by just the asset mix of my portfolio (where I was invested i.e European equities etc) over picking a typical multi-asset fund (the blue line). While the green line (which is my actual performance) shows the impact of being in the right funds at the right time, as identified by the 80-20 Investor algorithm.
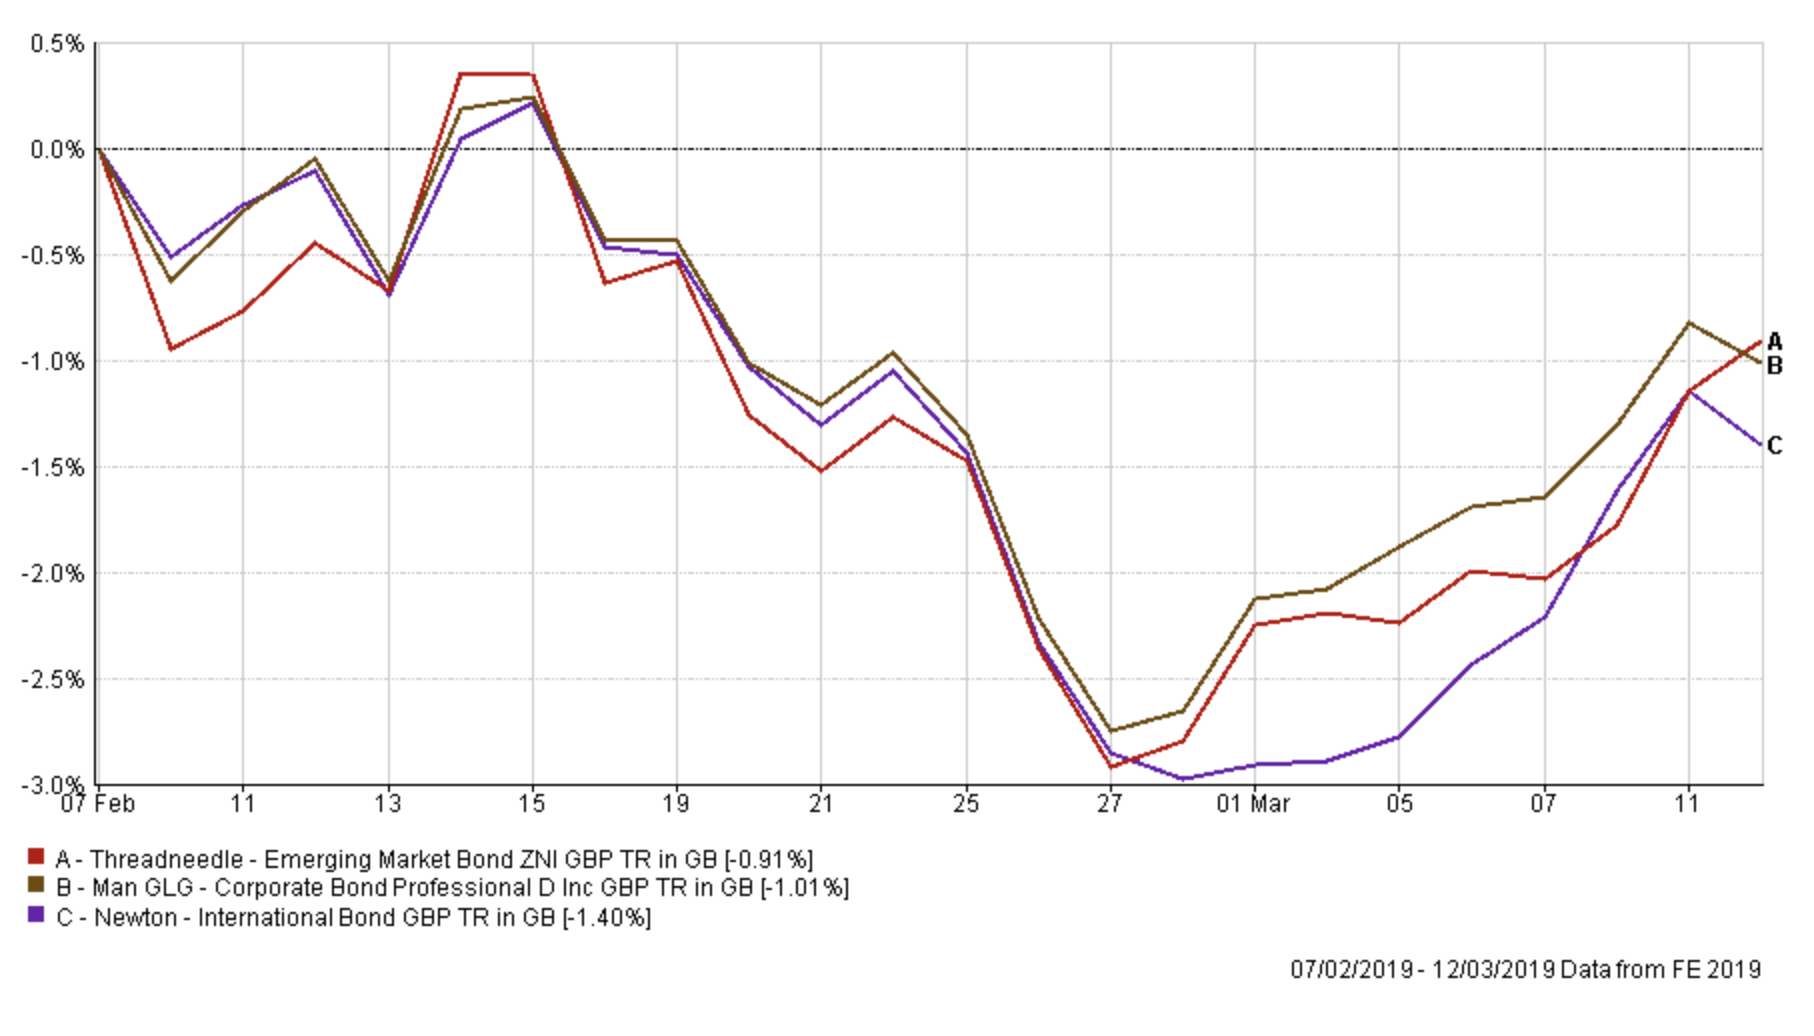
The performance of each fund within my portfolio, since the last update, is shown in the chart below. The chart is a little messy but below it is a list of each fund's performance for the period, from best performer to worst performer.
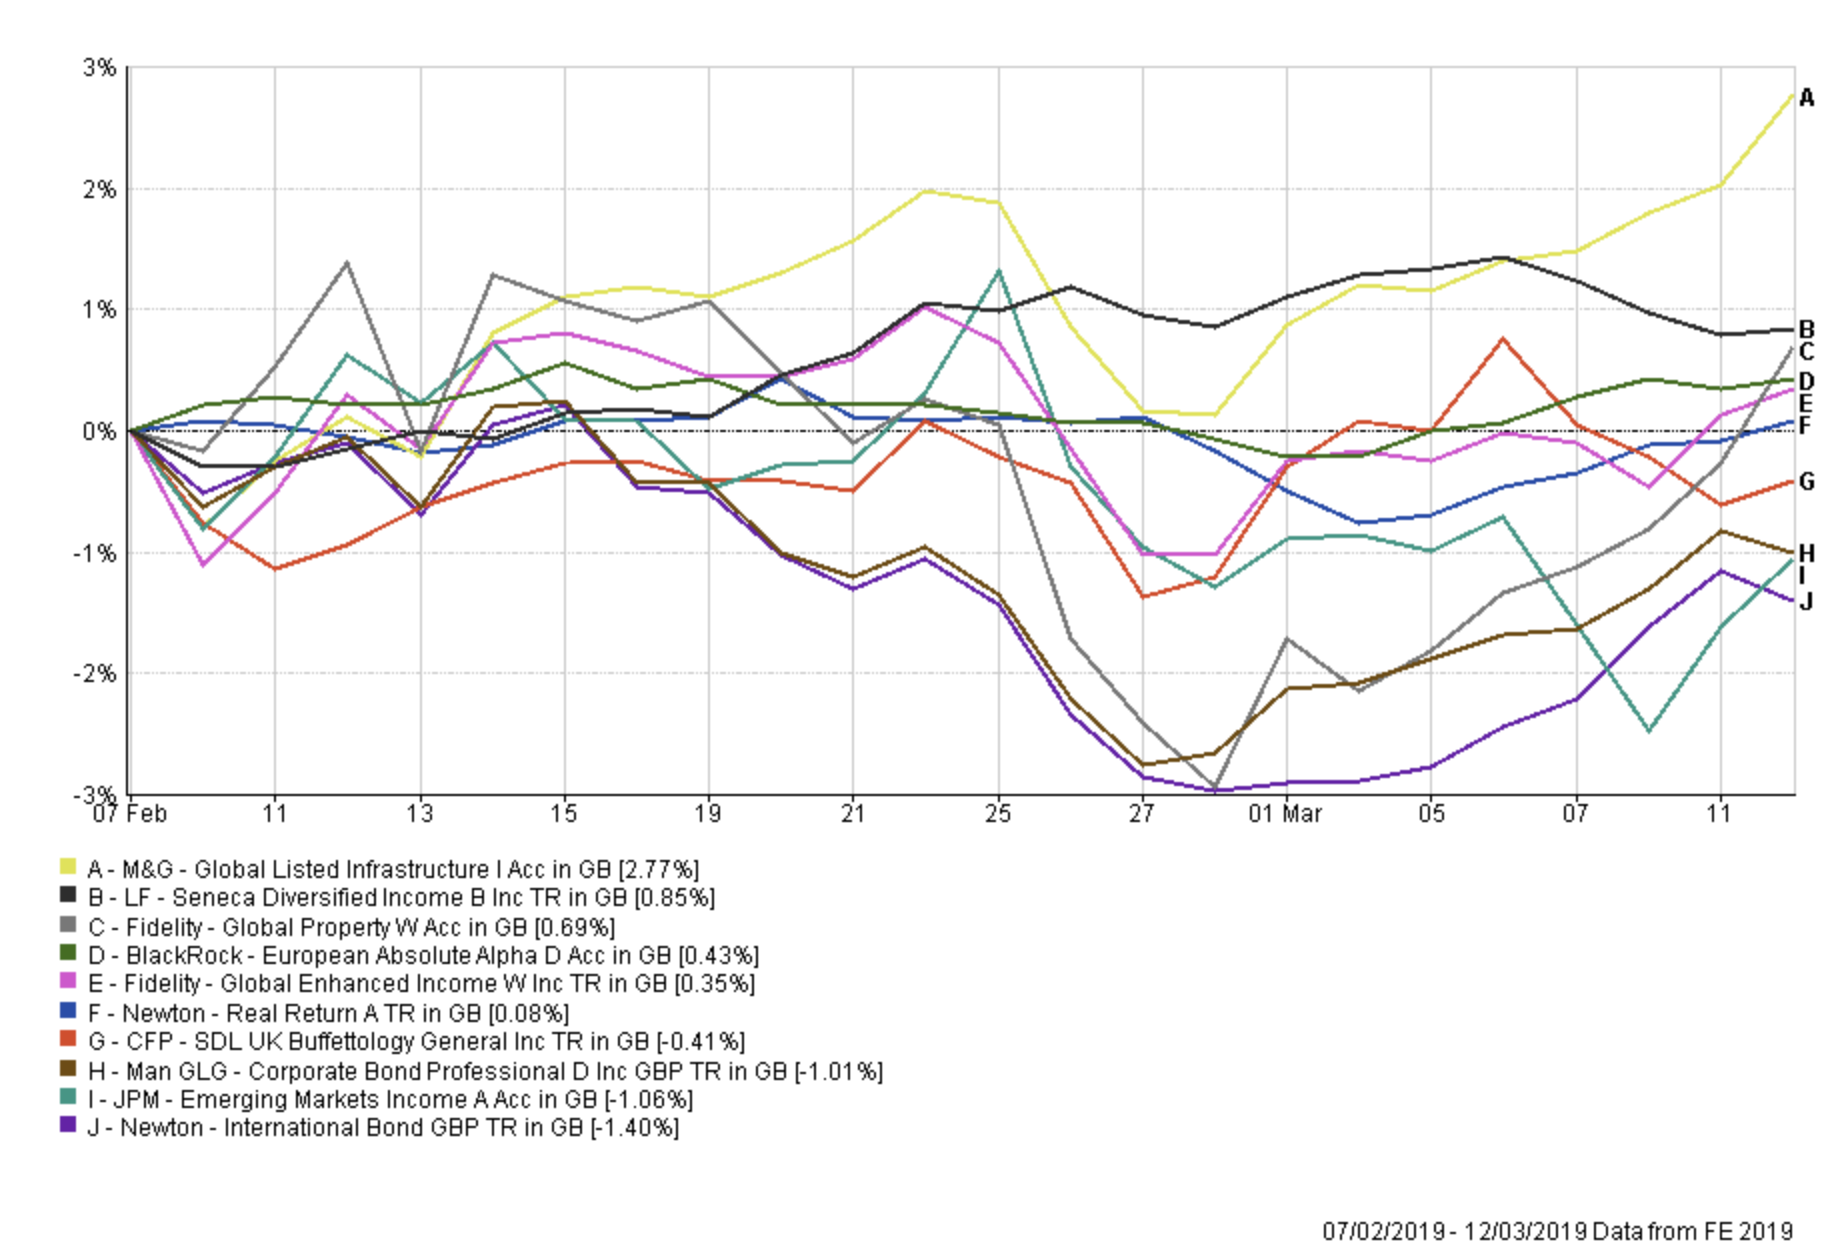
It's good to see the strong performance from recent new inclusions such as M&G Global Listed Infrastructure, LF Seneca Diversified Income, Fidelity Global Enhanced Income and Fidelity Global Property, although the latter endured a torrid February before turning things around in March.
The performance of the JPM Emerging Market fund had been strong but has tailed off somewhat. While the Newton International Bond fund has struggled in the face of currency volatility, as has the Man GLG Corporate Bond fund. From mid-February to the start of March the pound rallied against the dollar, as shown in the chart below. This is bad news for any fund with overseas holdings denominated in dollars for example. It explains why both global bond funds I hold performed poorly during the second half of February before their performance picked up in March (as the pound weakened against the dollar). Both these funds are heavily influenced by bond yields (especially on US Treasuries) but also the strength of the pound.
Right now there are a number of uncertainties troubling investors. None more so than the ongoing Brexit saga, which is responsible for the pound's volatility. The chart below shows the value of the pound versus the dollar since last time. As you can see there's been an incredible amount of volatility as currency markets try and second guess the fate of the UK's relationship with the EU.
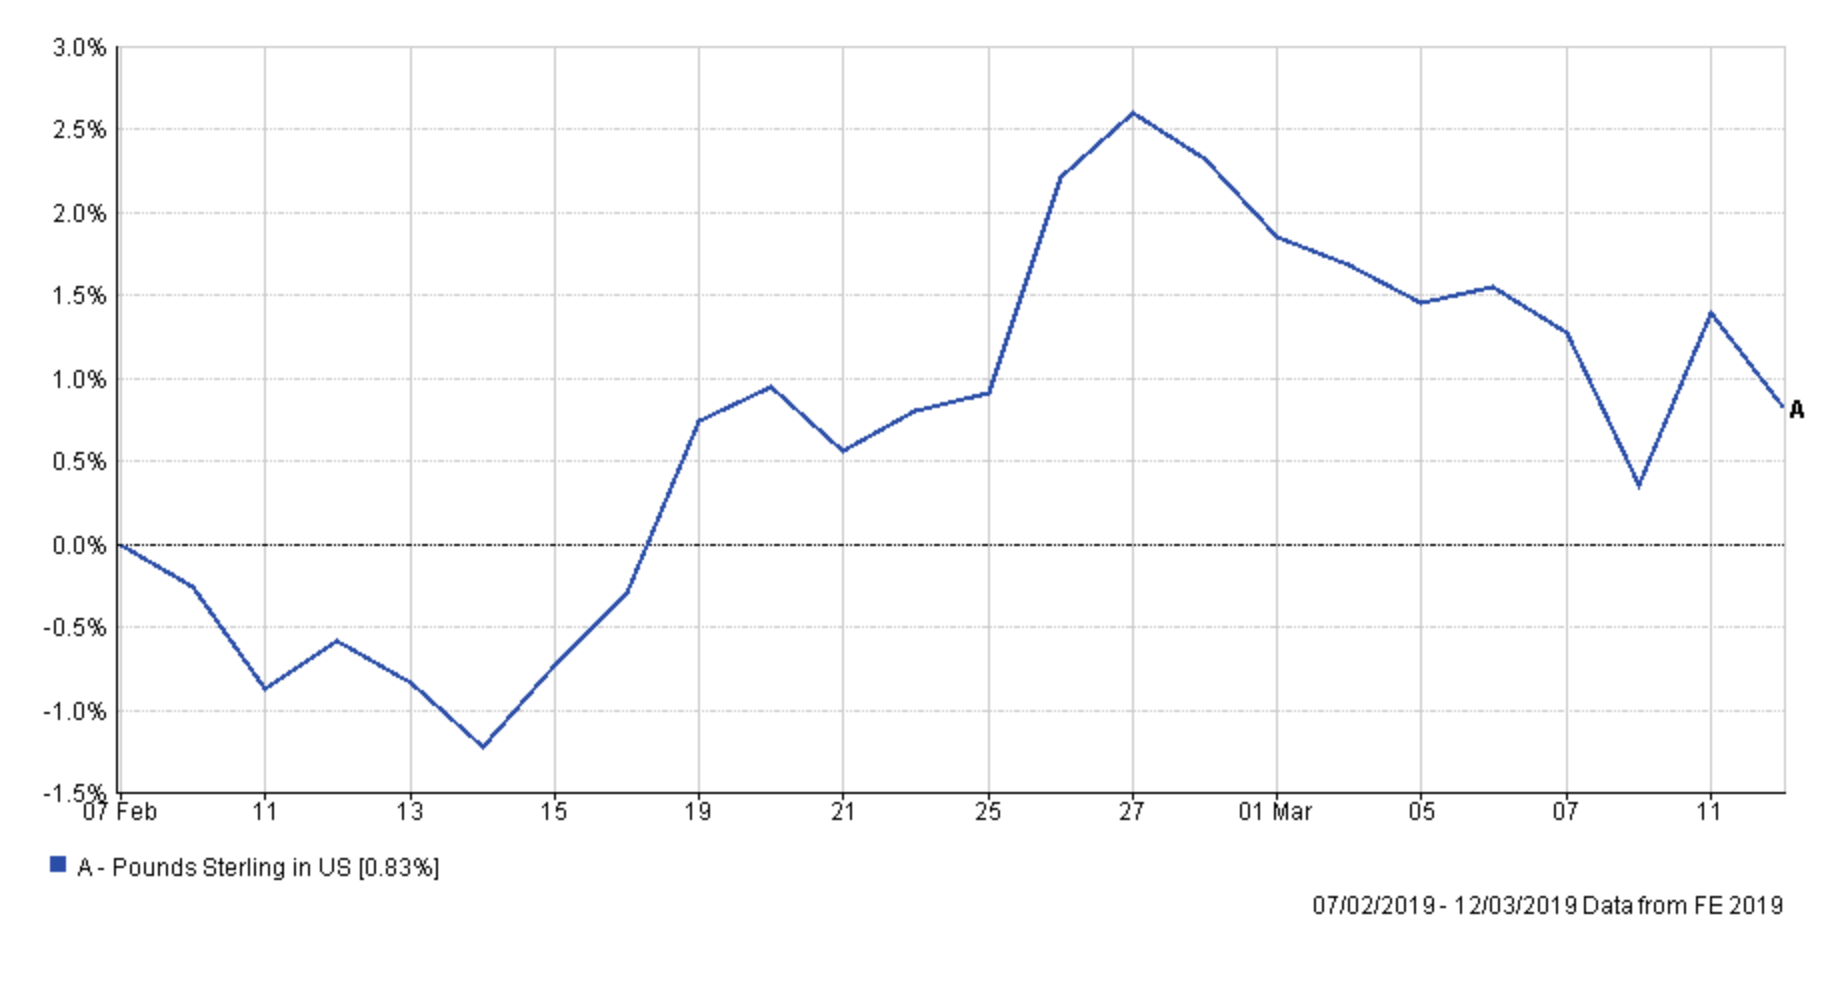
As a UK investor right now this is having a huge impact on your portfolio. It means that on a given day no matter what investment or bond markets have done, the performance of your portfolio will look very different once currency moves are factored in. It also means that markets (in particular) currency markets can move against you rapidly. In the past few days we've seen the pound move up or down by as much as 2% in a given day. The trouble is that with so much uncertainty over market direction (and also currency market direction) making portfolio changes is fraught with risk.
The table below shows my portfolio's current allocation, with those funds in green still in the BOTB while those in yellow are not in the BOTB but remain in the BFBS list. Meanwhile, any funds in red have dropped out of both shortlists.
| Fund | Allocation % | Risk | Sector | ISIN Code |
| BlackRock European Absolute Alpha | 8 | Low | Targeted Absolute Return | GB00B4Y62W78 |
| CFP SDL UK Buffettology General | 6 | Medium | UK All Companies | GB00B3QQFJ66 |
| Fidelity Global Enhanced Income | 5 | Medium | Global Equity Income | GB00BD1NLJ41 |
| Fidelity Global Property | 12 | High | Property Other | GB00B7K2NZ09 |
| JPM Emerging Markets Income | 11 | High | Global Emerging Markets | GB00B56DF680 |
| LF Seneca Diversified Income | 10 | Low | Mixed Investment 20-60% Shares R | GB00B7JTF560 |
| M&G Global Listed Infrastructure | 6 | Medium | Global | GB00BF00R928 |
| Man GLG Corporate Bond | 10 | Low | Global Bonds | GB00B0118B85 |
| Newton International Bond | 15 | Low | Global Bonds | GB0006779655 |
| Newton Real Return | 7 | Low | Targeted Absolute Return | GB0001642635 |
| Cash | 10 | Low | N/A | N/A |
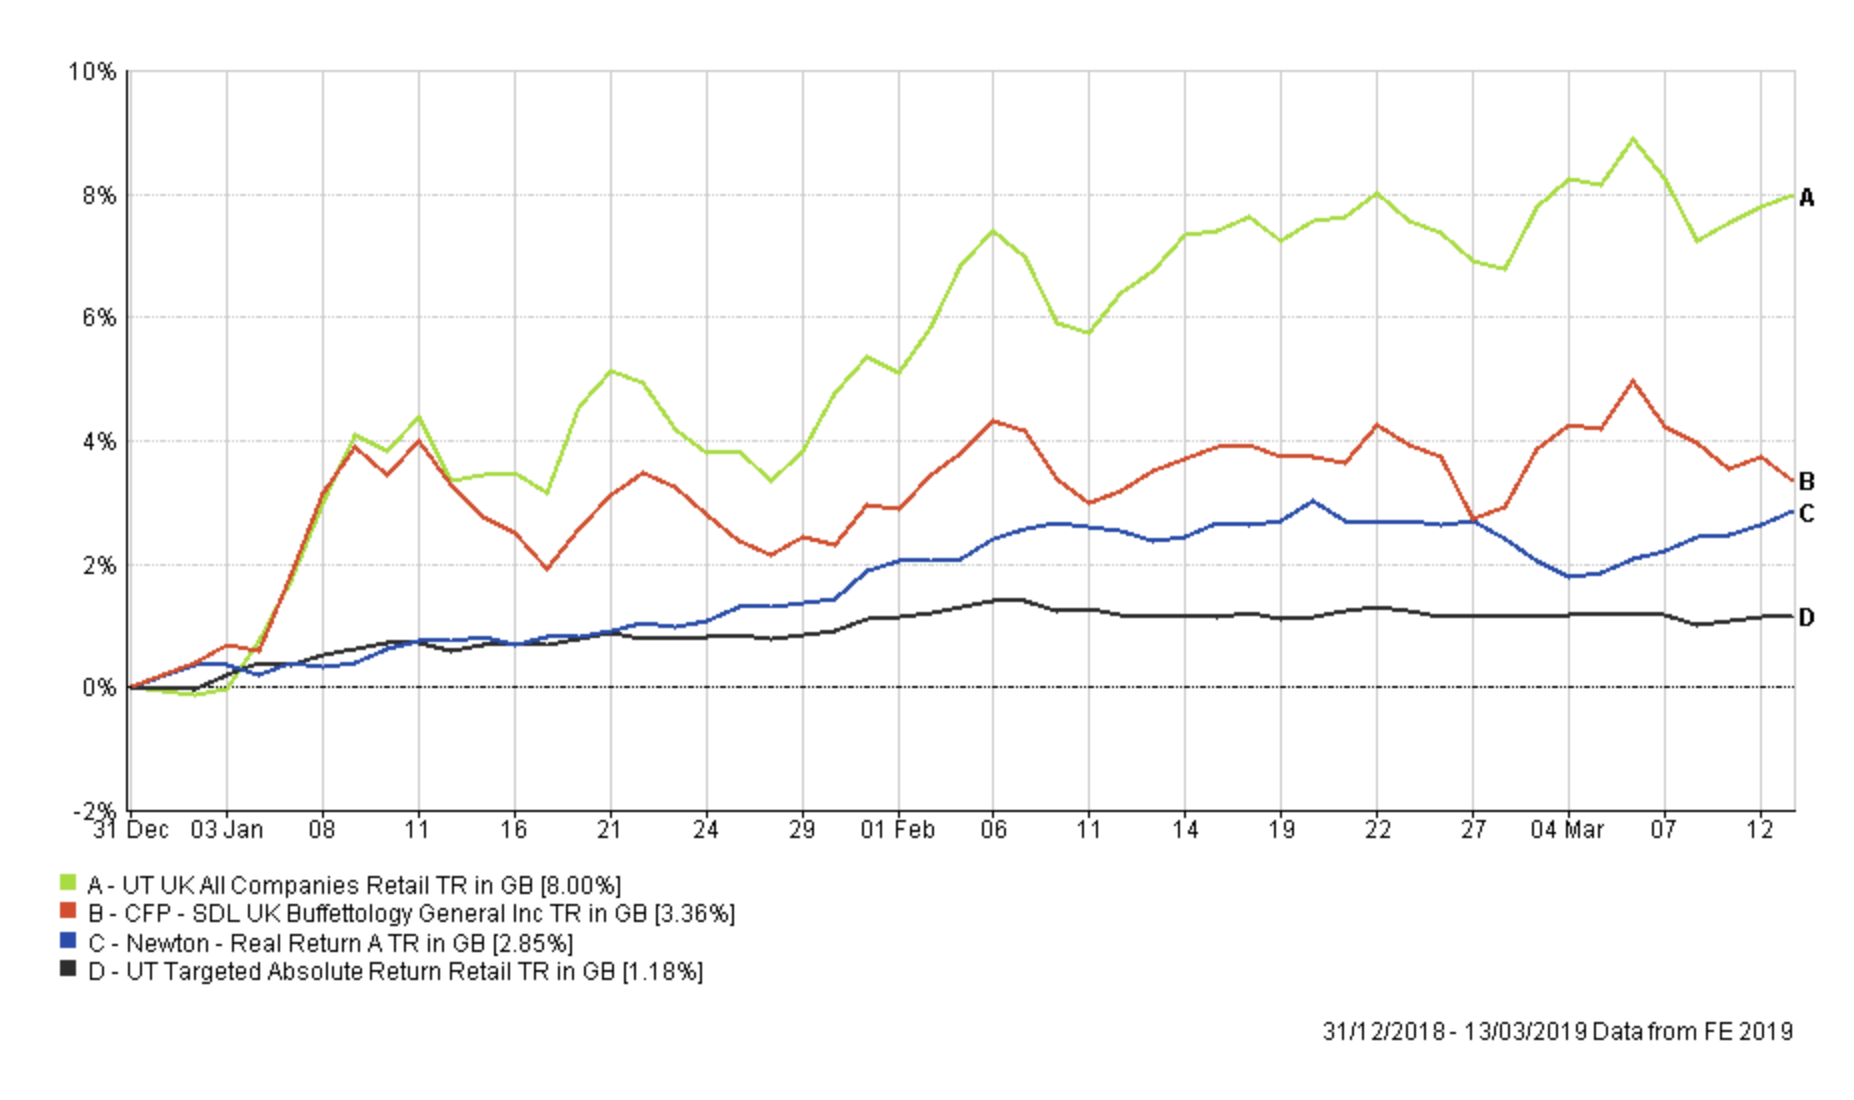
Of the 10 funds I hold only four are coloured red. These include the two bond funds, which have been buffeted by the moves in sterling, but also CFP SDL UK Buffettology General and Newton Real Return.
If we look at the performance of the Newton Real Return fund year to date versus the average of its peer group (Targeted Absolute Return) it has been very good (see chart below). So there's no reason to hit the panic button yet. However, the CFP SDL UK Buffettology fund has lagged its peer group since the start of the year. It had outperformed when the market fell but has since lagged. This is partly because the Buffettology fund favours value stocks over growth stocks, and the latter have rallied the most in 2019. Also the fund doesn't have much exposure to oil stocks, something which most UK funds and the FTSE 100 do, which has hindered the fund because the price of oil has rallied since the start of the year. So I will keep an eye on this fund for now.
If you compare the asset mix of my portfolio to that of the current BOTB the biggest differences are that I have a higher cash position (13% versus 4% in the BOTB) and a higher global bond exposure (25& versus 9%) and a lower emerging market bond exposure (0% versus 16%). However, as the chart below shows most of the emerging market funds in the BOTB have performed in line with the global bond funds which I hold. So, for now, I think there is more risk from markets moving against me, should I switch, than holding global bonds over EM bonds.
I am also happy with my cash position still as it reduces my exposure to the currency moves in sterling. At a time of heightened volatility, I am happy to sit on the fence with regard to the pound with around half my portfolio benefiting from a weakening pound while the other half, on a relative basis, not being hampered if the pound suddenly rallies.
We should have increased clarity over Brexit by the start of April, which is little more than two weeks away, by which time, hopefully, the market will have also broken out of its range-bound trading pattern. Furthermore, we will also have a new BOTB. Therefore I plan to sit on my hands until then before making any changes to my portfolio. I'd prefer to see what ultimate trend develops, if any, with the hope of then following it.
My portfolio
My portfolio remains:
| Fund | Allocation % | Risk | Sector | ISIN Code |
| BlackRock European Absolute Alpha | 8 | Low | Targeted Absolute Return | GB00B4Y62W78 |
| CFP SDL UK Buffettology General | 6 | Medium | UK All Companies | GB00B3QQFJ66 |
| Fidelity Global Enhanced Income | 5 | Medium | Global Equity Income | GB00BD1NLJ41 |
| Fidelity Global Property | 12 | High | Property Other | GB00B7K2NZ09 |
| JPM Emerging Markets Income | 11 | High | Global Emerging Markets | GB00B56DF680 |
| LF Seneca Diversified Income | 10 | Low | Mixed Investment 20-60% Shares R | GB00B7JTF560 |
| M&G Global Listed Infrastructure | 6 | Medium | Global | GB00BF00R928 |
| Man GLG Corporate Bond | 10 | Low | Global Bonds | GB00B0118B85 |
| Newton International Bond | 15 | Low | Global Bonds | GB0006779655 |
| Newton Real Return | 7 | Low | Targeted Absolute Return | GB0001642635 |
| Cash | 10 | Low | N/A | N/A |
My asset mix
This means my asset mix is as follows (previous asset mix is in brackets):
-
- UK Equities 9% (9%)
- North American Equities 6% (6%)
- Global Fixed Interest 25% (25%)
- Japanese Equities 0% (0%)
- Other International Equities 2% (2%)
- Emerging market equities 11% (11%)
- European Equities 3% (3%)
- UK Fixed Interest 0% (0%)
- Cash 13% (13%)
- Alternative Investment Strategies 20% (20%) (including absolute return)
- Emerging Market Fixed Interest 0% (0%)
- Property 11% (11%) - most of which is equities in the US.
If you are looking for the notional high and low-risk versions of my £50k portfolio which are often published with these updates then see the question and answer (regarding their omission) in October's Chatterbox.

£200 Pension Cashback Offer
Make a qualifying deposit or transfer a pension to our partner Interactive Investor.
- Deposit or transfer a pension of at least £20k and you could earn £200 cashback
- Terms and Fees apply, Capital at risk
- New & Existing customers opening a SIPP
- Offer ends 31st July 2026
Before starting your transfer, check you won't lose any valuable benefits (such as guaranteed annuity rates or a lower protected pension age) and find out what exit fees you might have to pay
