

The background to my portfolio
Back in March 2015 I decided to invest £50,000 of my own money using 80-20 Investor. The purpose was two-fold, firstly to show how you can use 80-20 Investor to invest and outperform the market with only a few minutes effort every now and then. Secondly, no other investment commentator, journalist or research provider invests their own money for fear of failing. This is a sorry state of affairs and is precisely why I committed to openly running my own portfolio for 80-20 Investor members to see.
Since then I have periodically changed my portfolio using the fund suggestions provided by the 80-20 Investor algorithm and associated research. I always disclose the changes at the time they are made.
Performance roundup: Still well ahead
My portfolio has continued to perform extremely well while not taking excessive risks, as currently only between 50-60% of the portfolio is invested in equities. I have produced a double-digit profit despite the various crises we have experienced including a Greek crisis, a Chinese economic slowdown, a commodity crisis, Brexit vote and Donald Trump's surprise election win.
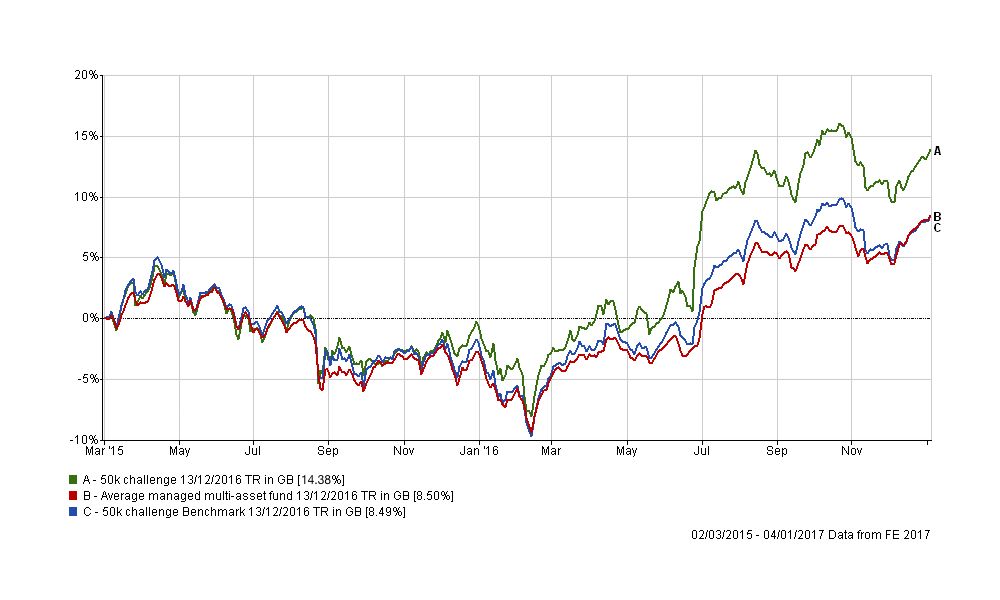
The chart below shows how my portfolio has outperformed since I started the challenge in March 2015. The green line is the performance of my portfolio while the blue line is the benchmark showing the average return achieved by professional fund managers given the same asset mix. To accurately calculate this I have used the average return for each sector in which my portfolio invested. The red line shows what the average multi-asset fund with comparable equity content achieved. In other words the blue line would show the extra performance added by just the asset mix of my portfolio (where I was invested i.e European equities etc) over picking a typical multi-asset fund (the red line). While the green line (which is my actual performance) shows the impact of being in the right funds at the right time, as identified by the 80-20 Investor algorithm.
The chart demonstrates that asset allocation (where you invest) is important, however of greater importance is the actual funds you chose.
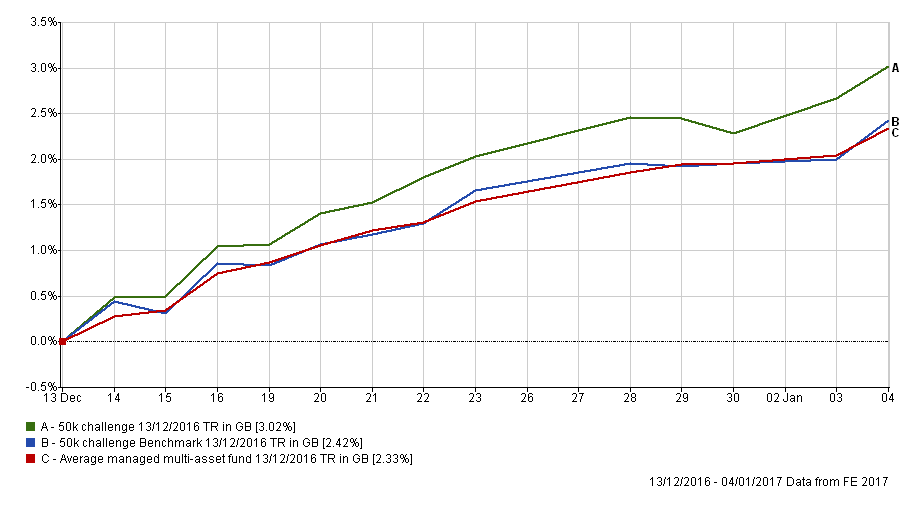
You may recall that in mid-December I made a minor asset allocation tweak which reduced my bond exposure, in light of the Trump trade, and increased my US equity allocation. The chart below shows that the decision paid off, even during the limited time the market was open over the festive season, which is pleasing.
Portfolio review
Just before the festive season I also produced my technical analysis of where markets might be headed. I’m always at pains to explain that technical analysis only gives a guide to the possible future path of markets and is not a crystal ball. Yet much of what I talked about either came to fruition or remains a possibility. So when making my latest portfolio changes I have been mindful of those over-riding market trends, but not obsessed by them.
As you know I tend to track my £50,000 portfolio's asset allocation alongside that of the Best of the Best Selection (BOTB). Again, as I’ve explained in my replies to your questions in Chatterbox I don’t obsess with matching the BOTB allocation exactly but it gives a good steer of where my portfolio should be more focused.
At the end of 2016 my Asian equity (excluding Japan) and emerging market exposure (particularly China) was a drag on the outperformance of my portfolio. This was largely due to the surge in strength of the dollar following Donald Trump’s election win and the ensuing ‘Trump trade’. Typically a strong US dollar is bad for emerging market assets. This is because the risk/return trade-off for dollar denominated assets improves relative to riskier emerging market assets. When the dollar strengthens investors tend to repatriate money that they had invested in emerging market assets, in pursuit of higher returns, back to the US. It makes sense when you think about it, if you don’t have to take excessive risk to get a decent return then why would you? These capital outflows are damaging for emerging market currencies and assets and explains why their governments employ capital controls when the trend becomes entrenched. In plain english that means that countries impose limits on the amount of money that can be taken outside of the country. In fact, China has just imposed new controls as I write. Certainly the consensus, which is always a concern in itself, is for the dollar to continue to strengthen in 2017 which wouldn’t bode well for emerging markets. I may well cover this in more detail in the future.
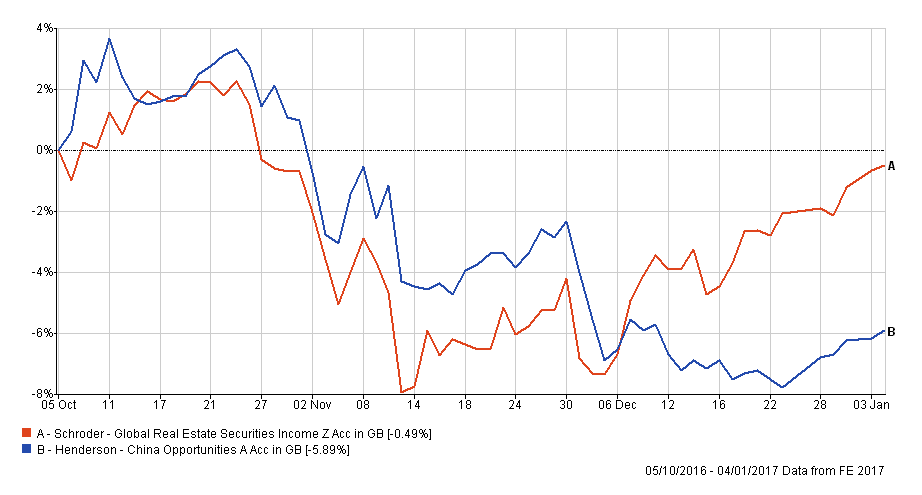
It’s therefore unsurprising that January’s BOTB completely removed any allocation to Chinese equities, Asian equities (excluding Japan) and emerging market assets. If we look back at the performance of my holdings within these categories in recent months you can see the slight drag they’ve had on my portfolio’s outperformance. The first chart below shows the performance of the Schroders Global Real Estate fund (in red) which I switched out of in October in favour of Henderson China (in blue). The trade was performing better relatively until the Italian referendum and a Chinese clampdown on insurance company share purchases at the start of December caused the Chinese market to fall 4% in a matter of days. It’s only now just recovering.
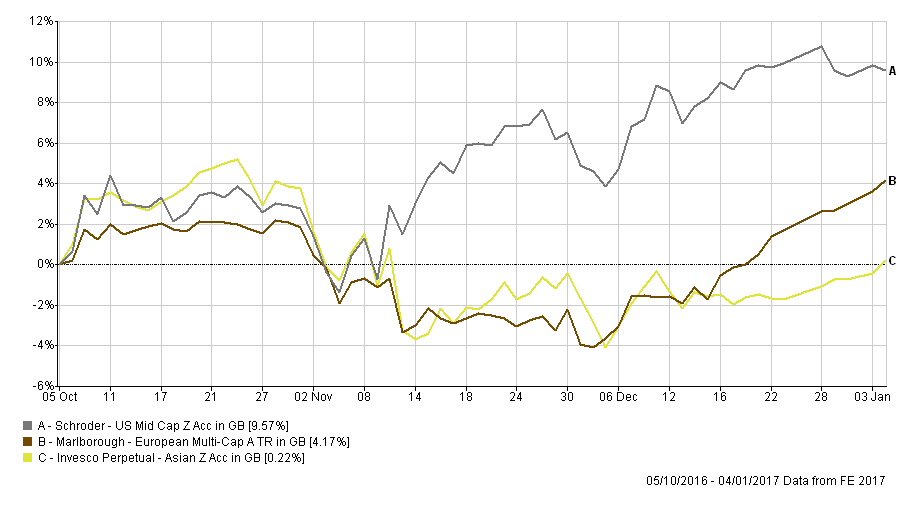
Similarly the switch from Schroder US Mid Cap into Marlborough European Multi-Cap and Invesco Perpetual Asian in equal measure didn't perform as well as I'd liked. The Invesco Perpetual Asian fund is now broadly back where it was when I originally invested while the European equity fund is starting to perform well and remains a key holding in my portfolio.
What the above illustrates is that:
- you can’t get every trade right
- I know when to admit when I’m wrong and sell
- sometimes events and the ensuing market reaction changes swiftly and you can be forced to adapt (Trump’s victory being just one example)
Most importantly it reaffirms that successful investing is all about getting more right than you get wrong. Here are three other trades I made on the same day back in October. In each instance the fund I switched into is in green while the old fund is in red. The charts show that the trades worked out well. Also, bear in mind that the two disappointments above accounted for only 12.8% of my portfolio while the three successes below accounted for nearly 22.8% of my portfolio. That’s why my portfolio has continued to outperform.
After considering the latest BOTB update and recent research pieces I am removing my Asian (ex Japan) equity exposure along with my Chinese equity exposure. That’s not to say that they won’t pick up in the coming months (the latter often does around Chinese New Year which is at the end of January) but hope is not a good investment strategy and right now there are more attractive high risk funds. In addition, I am also reducing the number of funds from 11 back down to 10. Furthermore a number of funds in my £50,000 portfolio have dropped out of the BOTB and BFBS (Best funds by Sector) tables completely so I will replace them with alternatives. These funds are shown in red in the table below, which represents my portfolio before today.
| Name | % Allocation | Sector | ISIN Code |
| AXA - Framlington Managed Income | 9.1 | Sterling Strategic Bond | GB00B6RPX228 |
| Baillie Gifford - Japanese | 8.5 | Japan | GB0006010838 |
| BlackRock - Overseas Corporate Bond Tracker | 10.1 | Global Bonds | GB00B58YKH53 |
| Franklin - UK Equity Income | 8.9 | UK Equity Income | GB00B7DRD638 |
| Henderson - China Opportunities | 7.6 | China/Greater China | GB0031860934 |
| IFSL - Brooks Macdonald Defensive Capital | 8.7 | Targeted Absolute Return | GB00B61MR835 |
| Invesco Perpetual - Asian | 4.4 | Asia Pacific Excluding Japan | GB00B8N44Q86 |
| Marlborough - European Multi-Cap | 14.2 | Europe Excluding UK | GB0001719730 |
| Threadneedle - Dynamic Real Return | 5.9 | Targeted Absolute Return | GB00BWWC6P48 |
| Vanguard - LifeStrategy 80% Equity | 13.4 | Mixed Investment 40%-85% Shares | GB00B4PQW151 |
| Blackrock - US Dynamic | 9.3 | North America | GB00B87XJQ69 |
Portfolio fund switches
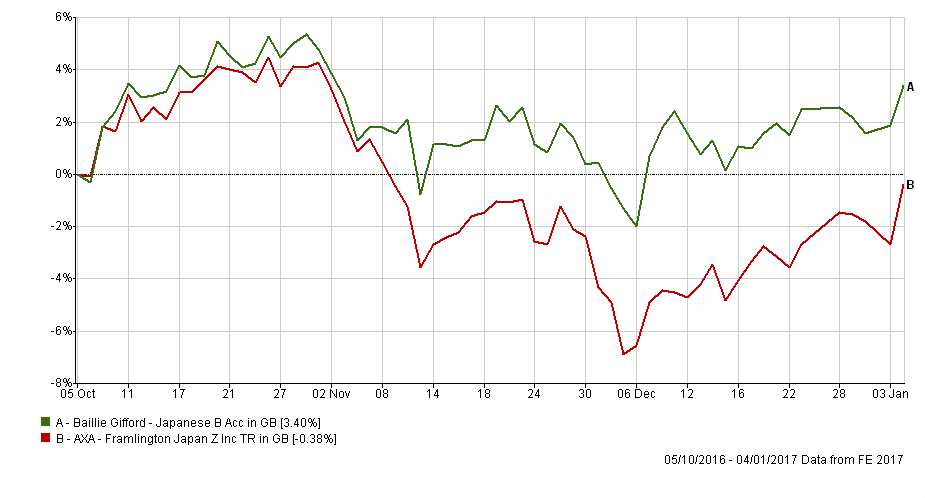
100% out of Baillie Gifford Japanese and into Man GLG Japan Core Alpha
Japanese equities have been on an incredible rally since the US election but to make the most of it you either had to have hedged your currency exposure or been invested in the unloved Japanese companies (referred to as ‘value’ stocks). Since the US election the dollar has rallied hard and when the dollar rises against the yen the Japanese stock market tends to rally too. A weak yen is good for Japanese exporters. However, much of the recent rally has not been led by exporters but those stocks most exposed to the health of the Japanese economy (known as cyclicals). This explains why Man GLG Japan Core Alpha has rocketed in recent months (up 16.26%) when compared to the Baillie Gifford fund (up 3.88%). Unsurprisingly Man GLG Japan Core Alpha fund has been in the BOTB for some time now (and it has a lower max weekly fall figure than the alternative Japanese equity fund in the BOTB list) which is why I’m switching into it it in a like-for-like swap at the expense of Baillie Gifford.
100% out of Blackrock Overseas Corporate Bond Tracker and into Fidelity Global High Yield bond
The Blackrock fund has finally dropped out of the BOTB and BFBS tables while the Fidelity fund has been in the BOTB for a while now, especially since the bond market sell-off got into full swing. The Fidelity fund has continued to make money throughout this period so I’m simply replacing my existing globally diversified bond fund with another. (UPDATE: A few of you have got in touch to say that Hargreaves Lansdown does not have this fund on their platform which is surprising. My portfolio is currently on Fidelity's platform for legacy reasons. If I had been using Hargreaves I would have invested in an alternative from the BOTB list within the same sector, namely AXA Global High Income. You can see here that the two funds' returns have mirrored each other)
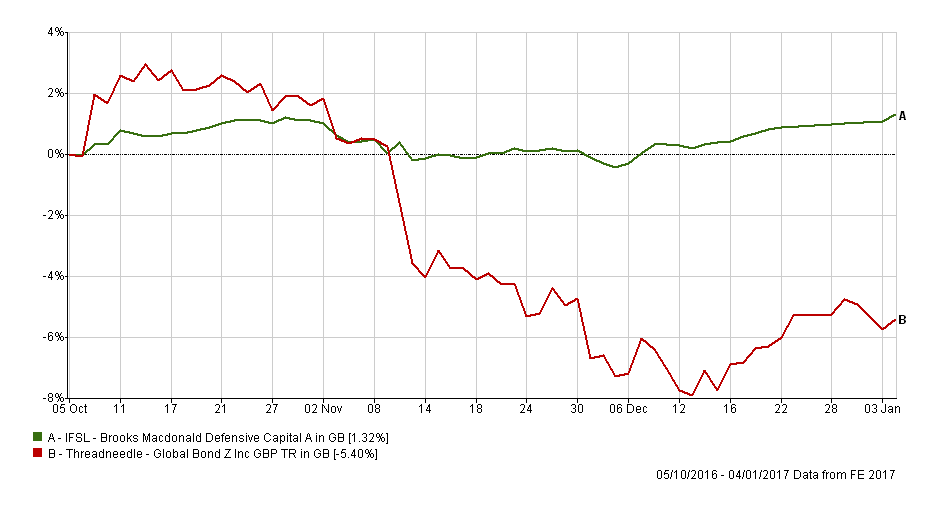
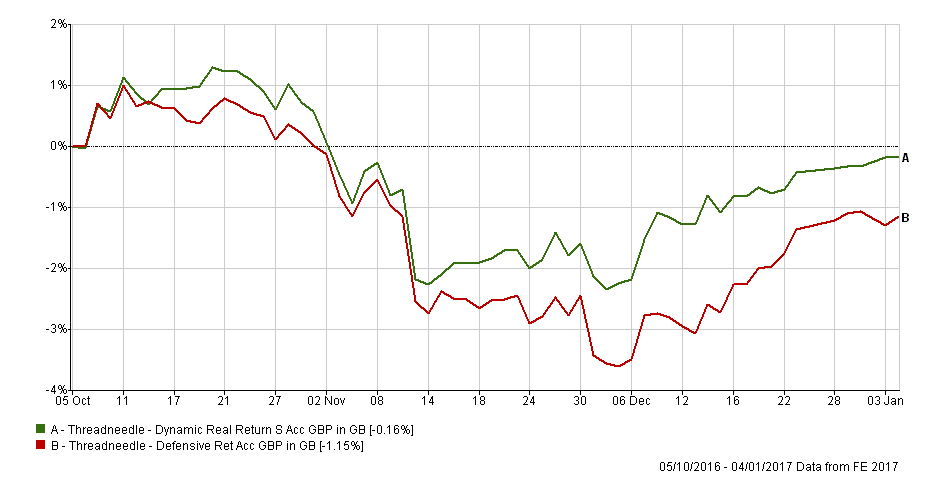
100% out of Threadneedle Dynamic Real Return and into IFSL Brooks MacDonald Defensive Capital
While the Threadneedle fund has performed well versus its predecessor, as shown above, the Brooks MacDonald fund has been the star of my low risk holdings during the last few volatile months. This month the Threadneedle fund has dropped out of the BOTB and the BFBS while the Brooks MacDonald fund continues to remain in both. So I’ve taken this opportunity to consolidate the number of funds in my portfolio from 11 down to 10 and boost my low risk exposure in the Brooks MacDonald fund, so as to avoid investing in another bond fund in the current environment.
100% out of Franklin UK Equity Income into JOHCM UK Equity Income
This is another example of a fund that has slowly drifted out of the BOTB table and eventually out of the BFBS. It’s another like-for-like swap (i.e. both are equity income funds) into the JOHCM fund that features in this month’s BOTB and has been on a stellar run.
100% out of Henderson China Opportunities Fund into Cavendish Aim
My reasons for exiting Chinese equities were explained earlier. As an alternative the UK smaller companies have performed strongly since the summer as the UK economy continues to confound concerns surrounding a possible Brexit slowdown. As a high risk play the max weekly fall figure in the BOTB table is surprisingly low plus it has shown a level of consistency in performance (shown by the bar charts) than the alternatives. It also nudges up my UK equity exposure more in line with that of the BOTB.
100% out of Invesco Perp Asian and into GAM North American Growth Institutional
Again my reasoning for exiting this fund have been stated earlier. The GAM fund has remained in the BOTB and it nudges up my exposure to US equities more in line with the BOTB. I toyed with just switching the money into the Blackrock US Dynamic fund which I already hold as it is still in the BOTB . However I decided to place this small amount into the GAM fund to diversify my US exposure and to take a bit more risk with this portion, which is evident from the max weekly fall figures in the BOTB table. In addition, the GAM fund doesn't have a bid/offer spread while the Blackrock US Dynamic fund has a small one.
100% out of Vanguard LifeStrategy 80% Equity and into Schroder Global Equity income
As I mentioned in my recent piece The lessons of 2016 global passive funds had a good year because one of their biggest limitations (they mostly invest in US assets with limited UK exposure and certainly no UK small cap exposure) became their biggest strength in the second half of the year. However the recent weak bond market (that’s where the other 20% of the Vanguard fund is invested) and the rise of areas of the equity market (value shares, small caps, Japanese equities to name a few) where Vanguard's passive fund doesn't invest has seen the fund drop out of the BOTB and BFBS. So I’ve looked to replace it with another globally diversified fund (equity only) and chose the Schroder Global Equity fund. The 80-20 Investor algorithm classes the fund as medium risk (as opposed to high risk like the other global funds that make this month's BOTB) which is good as I always try to maintain a fairly equal spread of low, medium and high risk funds in my portfolio.
Switch timings
In recent weeks markets becalmed and volatility reduced. So it is not a bad time to make fund switches, although equity markets have been on the rise. Ideally it would be good if the markets fell while any switches took place as it would mean that you'd have avoided the drop whilst out of the market. But of course you can't market time and whether the market moves for or against you during a trade is pure luck. That is the occupational hazard of investing via unit trusts (rather than investment trusts and ETFs). As I would be switching 60% of my portfolio at once if I actioned all the trades on the same day, I would be quite exposed to any sudden market moves. So to mitigate that I will stagger the switches. I will transfer 50% of each holding suggested into the new funds and then do the remainder in a few days time once the first wave has completed. That way I will only ever have 30% of my portfolio out of the market and over that time will hopefully minimise the chances of missing out in the event of a sudden market rally. The plus point of investing via unit trusts is that I won't be penalised for staggering the trade, unlike when investing in investment trusts or ETFs where platforms normally apply charges per trade made.
My new portfolio
So my new portfolio looks like this (new funds are in green):
| Fund name | Allocation % | Risk | Sector | ISIN Code | SEDOL Code | Citicode / TIDM |
| AXA Framlington Managed Income | 9.1% | Low | Sterling Strategic Bond | GB00B6RPX228 | B6RPX22 | 11VN |
| Man GLG - Japan Core Alpha | 8.5% | High | Japan | GB00B3F46Y30 | B3F46Y3 | DWE6 |
| Fidelity Global High Yield | 10.1% | Low | Sterling High Yield | GB00B7K7SQ18 | B7K7SQ1 | 0Z51 |
| BlackRock US Dynamic | 9.3% | High | North America | GB00B87XJQ69 | B87XJQ6 | GTZX |
| IFSL Brooks MacDonald Defensive Capital | 14.6% | Low | Targeted Absolute Return | GB00B61MR835 | B61MR83 | IIP5 |
| JOHCM UK Equity Income | 8.9% | Medium | UK Equity Income | GB00B03KR831 | B03KR83 | JO98 |
| Cavendish Aim | 7.6% | High | UK Smaller Companies | GB00B0JX3X39 | B0JX3X3 | TM91 |
| GAM North American Growth | 4.4% | High | North America | GB0002423852 | 242385 | GE05 |
| Marlborough European Multi-Cap | 14.2% | Medium | Europe Excluding UK | GB0001719730 | 171973 | CA33 |
| Schroder Global Equity income | 13.4% | Medium | Global | GB00B76V7M69 | B76V7M6 | 0HCZ |
My new asset allocation
My new asset allocation is shown below with my previous allocation in brackets
• Global fixed interest - 19% (16%)
• US equities -17% (13%)
• European equities - 11% (13%)
• UK equities - 19% (11%)
• Japanese equities - 9% (10%)
• Other international equities - 3% (0%)
• Cash - 8% (5%)
• Property - 0% (0%)
• UK Gilts - 0% (0%)
• UK Fixed Interest - 3% (9%)
• Alternative assets/strategies - 11% (11%)
• Asia Emerging Equities - 0% (9%)
• Asia Equities ex Japan - 0% (3%)

£200 Pension Cashback Offer
Make a qualifying deposit or transfer a pension to our partner Interactive Investor.
- Deposit or transfer a pension of at least £20k and you could earn £200 cashback
- Terms and Fees apply, Capital at risk
- New & Existing customers opening a SIPP
- Offer ends 31st July 2026
Before starting your transfer, check you won't lose any valuable benefits (such as guaranteed annuity rates or a lower protected pension age) and find out what exit fees you might have to pay
