

Welcome to the 80-20 Investor Heatmap!
The idea for this feature was sparked by a conversation with an 80-20 Investor member. DIY investors regularly tell me that they struggle with choosing which sectors (types of funds) to invest in. This is called asset allocation.
We currently help solve this problem by identifying the best opportunities on a fund by fund basis. So, for example, you can look at my portfolio to see which funds (and therefore sectors) I am investing in. Or you can use the Best of the Best selection to see the current shortlist chosen by the 80-20 Investor algorithm. You can then see which sectors these funds belong to. However, just because one fund in a sector may have momentum it doesn't mean others in the same sector do.
But the 80-20 Investor Heatmap helps you quickly answer the 'which sector to buy?' question by looking at momentum at a sector level, rather than at a fund level.
The purpose of this Heatmap is to complement the other resources mentioned above. The Heatmap shows variations in the short term momentum from month to month of a given sector.
How to use the Heatmap
The table is ranked from the riskiest sectors at the top to the least risky at the bottom, based on recent history. This is based on the average level of risk/volatility of funds within each sector. This itself will prove useful in choosing sectors to look at within our Best funds by sector section.
Then for each sector we show the historic short-term momentum for each of the last 6 months. This gives you an idea of how the momentum has moved over time. So if for example you look at the Technology & Technology Innovation sector you will see that it is at the top of the chart, which means that the typical Technology & Technology Innovation fund has a higher risk profile, in recent months, when compared to funds from other sectors below it in the table. If you now look across the Technology & Technology Innovation row, you will see its momentum dramatically improved in April.
I have also included cash in the table which unsurprisingly is the lowest risk asset class, so sits at the bottom of the table.
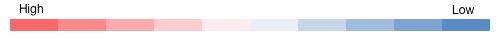
MOMENTUM KEY:


The material in any email, the MonetotheMasses.com website, associated pages / channels / accounts and any other correspondence are for general information only and do not constitute investment, tax, legal or other form of advice. You should not rely on this information to make (or refrain from making) any decisions. Always obtain independent, professional advice for your own particular situation. See full Terms & Conditions and Privacy Policy.
Neither MoneytotheMasses.com/80-20 Investor nor its content providers are responsible for any damages or losses arising from any use of this information. Past performance is no guarantee of future results.
Funds invest in shares, bonds, and other financial instruments and are by their nature speculative and can be volatile. You should never invest more than you can safely afford to lose. The value of your investment can go down as well as up so you may get back less than you originally invested.
Information provided by MoneytotheMasses.com/80-20 Investor is for general information only and not intended to be relied upon by readers in making (or not making) specific investment decisions.
Appropriate independent advice should be obtained before making any such decisions. Leadenhall Learning (owner of MoneytotheMasses.com/80-20 Investor) and its staff do not accept liability for any loss suffered by readers as a result of any such decisions.
The tables and graphs are derived from data supplied by Trustnet. All rights Reserved.

£200 Pension Cashback Offer
Make a qualifying deposit or transfer a pension to our partner Interactive Investor.
- Deposit or transfer a pension of at least £20k and you could earn £200 cashback
- Terms and Fees apply, Capital at risk
- New & Existing customers opening a SIPP
- Offer ends 31st July 2026
Before starting your transfer, check you won't lose any valuable benefits (such as guaranteed annuity rates or a lower protected pension age) and find out what exit fees you might have to pay
