

One of the pieces of research that I've wanted to carry out on 80 20 Investor is to look at how the high, medium or low risk selections from historic Best of the Best Selections would have fared in isolation. For want of better words how would a notional high, medium or a low risk 80 20 Investor portfolio have fared.
Interestingly this is also something 80 20 Investor members have asked about. As you know I chart the performance of the overall Best of the Best Selection on this page. The aim is not to suggest that people buy all the funds but simply to give a graphical representation of how the 80 20 Investor algorithm is faring as a whole from a fund picking perspective. I can then benchmark the performance for users to see. However, 80 20 Investor is not prescriptive or dictatorial. It is about trying to enhance the decisions that subscribers make. So if they want to take more investment risk they can. If they want to take less risk then they can. Passive investment strategies and active funds don't in themselves allow this level of personalisation. They are simply the lego bricks to help you build the portfolio you want. 80-20 Investor helps you with the design and implementation.
So I have spent a lot of time recently recreating how the low, medium and high 80 20 Investor portfolios would have fared. This article is the fruit of that research. The three portfolios are only indicative as I've not invested money into them. To build the low risk portfolio I tracked the performance of the funds earmarked as low risk in each month's BOTB since launch in August 2014. I also created the medium and high risk portfolios in a similar way but by using the relevant funds.
In addition, I also produced an accurate benchmark for each. This benchmark provides the return from a portfolio with the same asset mix but assuming you achieved the average fund performance for the relevant sectors. So if, for example, one of the 80 20 Investor risk portfolios had 10% in a specific UK All Companies fund then 10% of the corresponding benchmark would have achieved the average return for the UK All Companies sector. This shows the added value that the 80 20 Investor algorithm provides by picking the right funds.
What I expected to see
The reason why I regularly return to using a surfing analogy when talking about momentum is that it is particularly apt. As investment trend-surfers we try to ride as many waves as we can for as long as we can. We also try to minimise the wipeouts. Like the best surfers, the best momentum investors spend more time riding waves than getting wet.
It follows that we need volatility (waves) in markets in order to surf. Calm markets are far from ideal for momentum investing. The research that laid the foundation for the 80 20 Investor algorithm showed that momentum works best when there are waves. Yet just like surfing there are more ideal conditions than others. You can't surf on a still lake but at the same time surfing a tidal wave is only for life's risk takers because the wipeouts are more severe. Momentum investing is usually more successful and more volatile the more investment risk you take. Equally the opposite is true. The best conditions are somewhere in the middle (which is akin to the medium risk portfolio).
So ahead of this research I expected to see a more exaggerated return wave for the high risk portfolio and a much flatter trend for the low risk portfolio. Or put it another way I expected to see the high risk portfolio have huge upside and downside moves while the low risk moves were minimal. The medium risk portfolio will likely lie between them with a nice risk/return trade off. I'd also expect the outperformance over the benchmark to be most prevalent in the medium risk portfolio, then the high risk portfolio and then the low risk portfolio.
Low risk 80 20 Portfolio
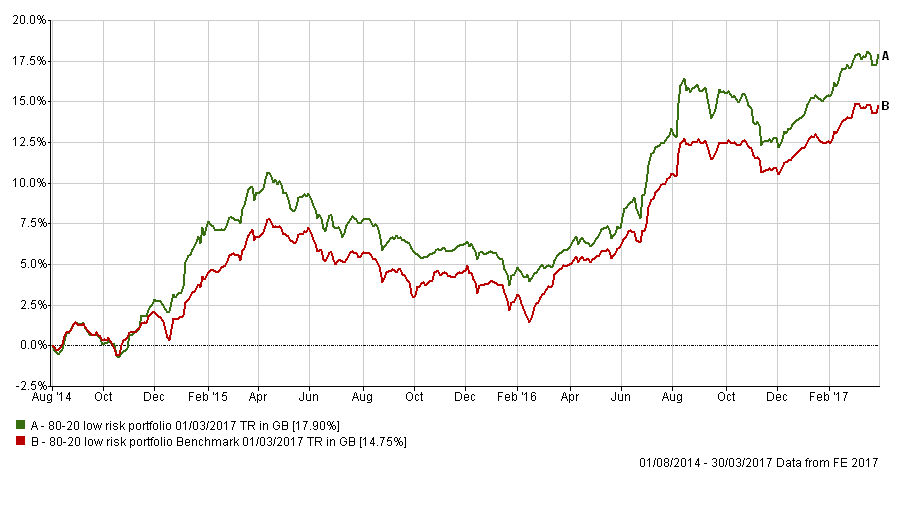
Looking at the results I'm pleasantly surprised that the low risk portfolio managed to outperform throughout the last two years. To squeeze that extra couple of percent from the most lost risk investments is a big win. Obviously I tend to focus on the outperformance while 80 20 Investor members focus on the absolute return, after all almost 18% return for a low risk portfolio that is mostly invested in bonds and absolute return funds is fantastic.
Since the launch of 80 20 Investor (August 2014) various types of low risk funds have had their periods of outperformance, be they absolute return funds, high yield bonds, strategic bonds, corporate bonds or even property funds. The trouble is that at the start of the exercise in August 2014 there was no telling which would outperform. What 80 20 Investor does is to keep the portfolio nimble and move from one asset type to another. The table below shows how a typical fund from each of the traditional low risk sectors would have fared since August 2014.
| Name | % return since launch (August 2014) |
| 80-20 low risk portfolio | 17.9 |
| Sterling Corporate Bond | 15.24 |
| Global Bonds | 14.94 |
| Sterling Strategic Bond | 10.13 |
| Sterling high yield | 9.11 |
| Targeted Absolute Return | 6.09 |
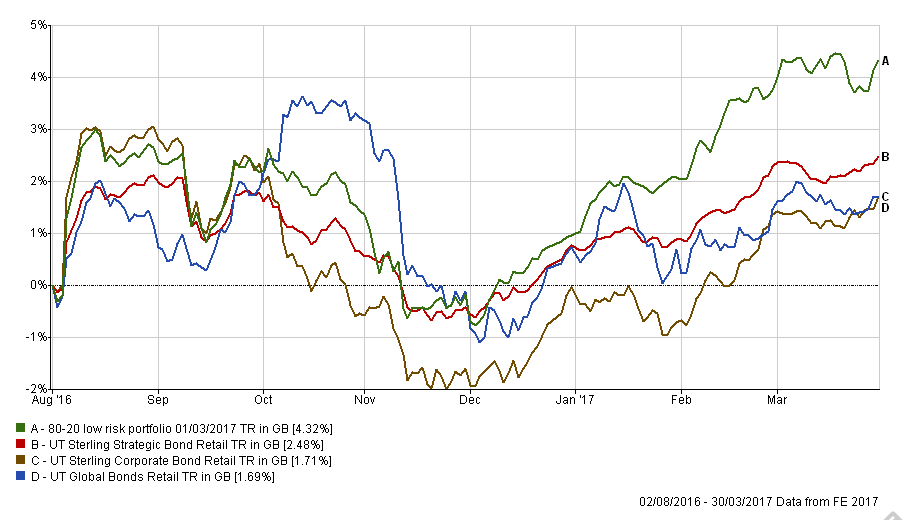
The Sterling Corporate Bond sector performed spectacularly after the Brexit vote, a wave that the 80 20 Investor low risk portfolio also rode by focusing on this sector. However what is interesting is what happened after the bond market peaked in August last year and following the US election when fears of a bond bear market erupted. The key takeaway from the chart below (click to enlarge) is that the low risk portfolio is back well above where it was before the bond market sell-off while bond sectors generally are still in recovery mode. The reason for the outperformance of the 80 20 Investor portfolio is that it has since switched to having more high yield exposure (which is not shown in the chart but is up 5.5% as a sector). This nimbleness is how the portfolio has managed to squeeze additional performance from these low risk assets. At some point the fortunes for high yield will change and so will the make up of the 80 20 Investor low risk portfolio. Hopefully this bodes well for when the bond market bubble finally pops.
Medium risk 80 20 Portfolio
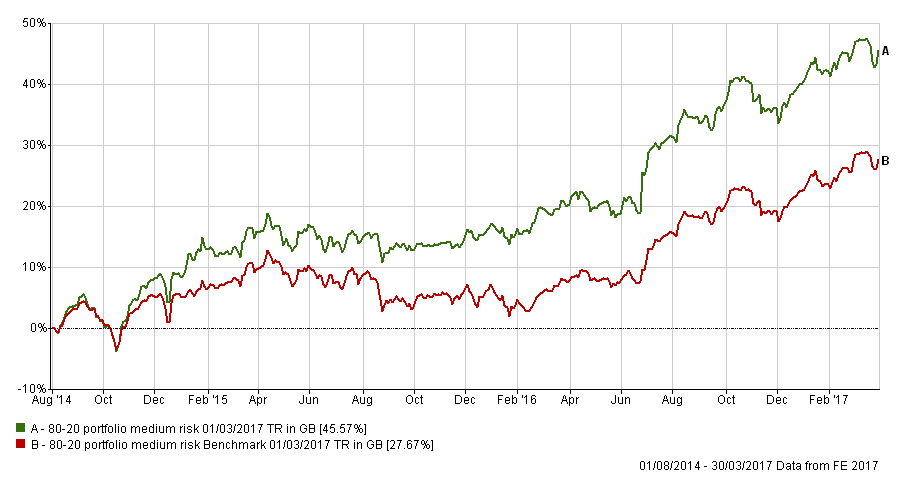
The chart below shows the performance of the medium risk funds from the BOTB versus a benchmark with exactly the same asset mix but taking the average return achieved by professional fund managers in the represented medium risk sectors.
The return of 45.57% is quite staggering especially when compared to the benchmark return of 27.67%.
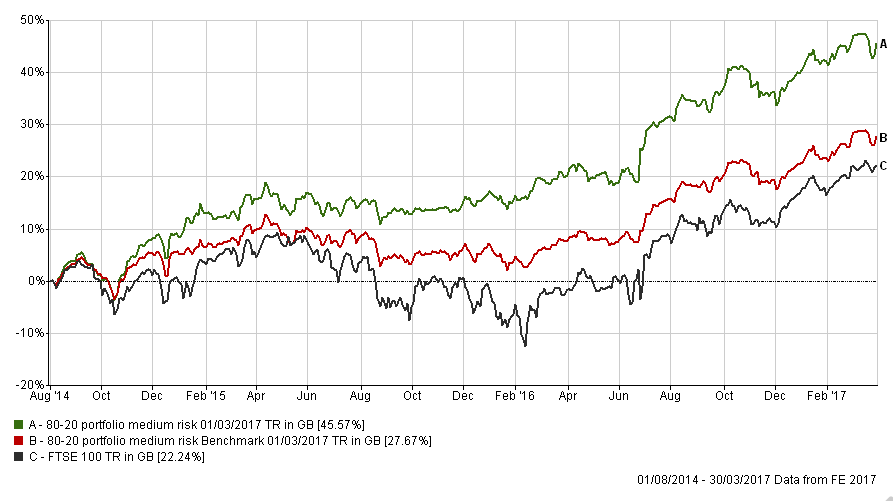
However, what I am most pleased about is how the medium part of the portfolio performed during the summer of 2015. In the chart below I overlay the FTSE 100 return. You can see (click to enlarge) that in the summer of 2015 and into September equity markets tumbled (which was the result of concerns for the health of the Chinese economy). The 11% fall on the FTSE 100 was matched by only a 4% fall for the Medium risk portfolio. The portfolio managed this by sheltering in smaller companies funds in the UK, which are not as buffeted by the macro economic winds.
The medium risk portfolio is perhaps the most dynamic of the three risk portfolios because it can vary the range of investments which it invests in. It can theoretically have a 100% equity exposure while on other occasions it invests in managed funds as well as global bond funds. By way of example back in autumn 2016 the medium risk portfolio only had a 60% equity exposure. By contrast the low risk portfolio has historically been centred around bonds while the high risk portfolio is predominantly equity based.
High risk 80 20 Portfolio
The chart below shows how the high risk portfolio fared against its benchmark. Again total return is significant as is the outperformance. As I anticipated the level of outperformance was marginally smaller than for the medium risk profile.
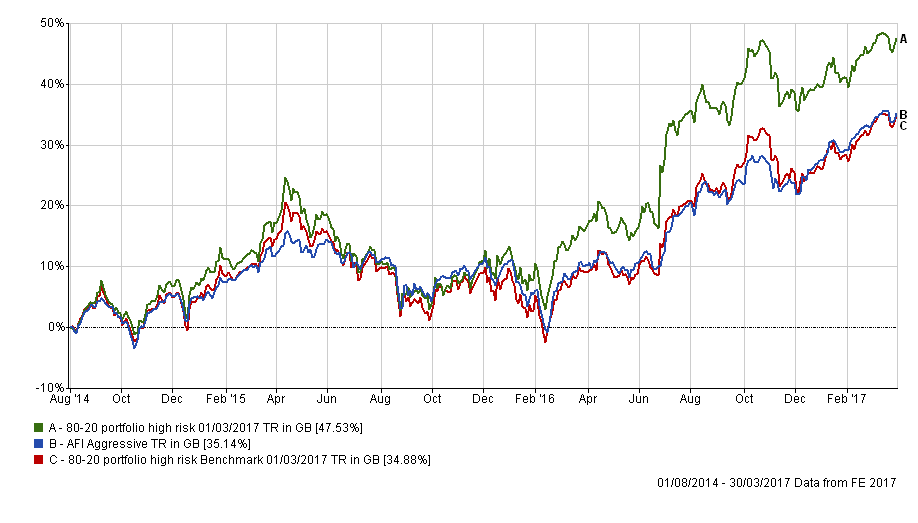
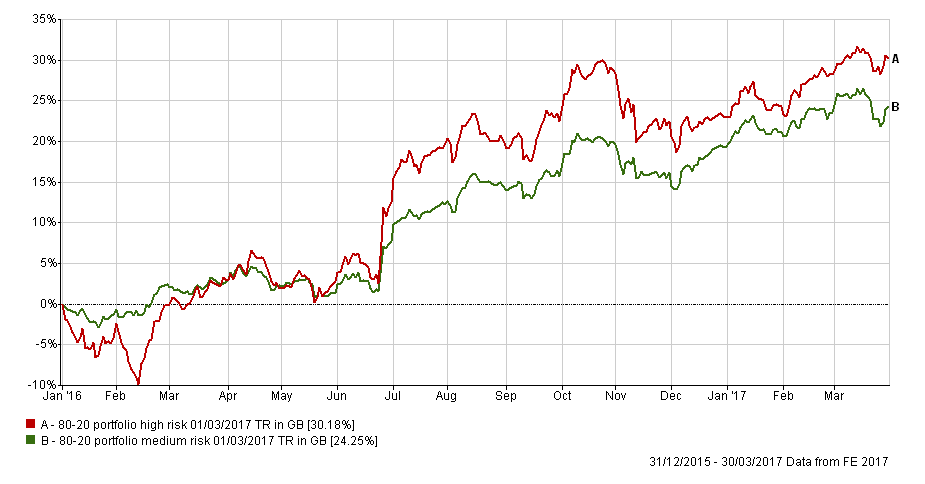
One thing that is interesting is that the high risk portfolio only marginally outperformed the 80 20 Investor medium risk portfolio. As you'd expect when comparing the two charts, the high risk portfolio is much more volatile rallying strongly when risk is rewarded and falling when it isn't. The summer of 2015 was a tough one for emerging markets (a typical high risk play) as the Chinese equity market collapsed amid concerns over the health of the Chinese economy. We saw a repeat of this at the start of 2016. However if we compare the performance of the high risk 80-20 portfolio against the medium risk portfolio since the start of 2016 the outperformance of the former is quite astonishing, particularly from the February low from which the high risk portfolio rallied 40%.
Risk/return profile
You will notice that I've also mapped the AFI equivalent high risk portfolio onto the earlier chart. This is the 'portfolio based funds index chosen by the UK's leading financial advisers'. You can view the panelists here but in short they are the people who you see quoted in the national press at the weekend. What is interesting is that they only perform on a par with the 80-20 Investor high risk benchmark, and lag the 80 20 Investor medium risk portfolio. There are in fact three AFI indices produced namely Cautious, Balanced and Aggressive.
The table below summarises their annualised performance, volatility and Sharpe ratio. Volatility is the variability in the returns (so how wiggly the line is in the charts above) and Sharpe is a measure of how the risk being taken is being rewarded. So the higher the Sharpe ratio the better.
| Name | Annualised Return | Sharpe | Volatility |
| 80-20 high risk portfolio | 15.99 | 0.89 | 14.06 |
| 80-20 medium risk portfolio | 15.21 | 1.17 | 10.03 |
| AFI Aggressive Index | 12.29 | 0.81 | 10.89 |
| AFI Balanced Index | 9.1 | 0.71 | 7.9 |
| AFI Cautious Index | 6.89 | 0.58 | 5.84 |
| 80-20 low risk portfolio | 6.47 | 0.73 | 4.09 |
The key takeaways are that the medium risk portfolio outperforms both the 'experts' cautious and balanced portfolios. It is also interesting to take a closer look at the Sharpe ratio numbers. In each instance when you compare like for like portfolios (i.e AFI balanced with 80 20 medium risk) the 80 20 portfolios' ratios are always higher. What this means is that any extra risk taken is rewarded. The other key points are:
- the expert IFAs try and boost returns by simply taking more risk but it isn't rewarded (are they gambling with your money?)
- their returns are hugely inferior with the exception of the low risk portfolio where they have marginally outperformed
- however to do so they took more risk (reflected by the higher volatility number) but often unwarranted and unrewarded (as shown by the Sharpe ratio). They invest in assets such as gold which is a very volatile and risky asset, certainly not low risk.
What are the takeaway's
I am pleased with the results although this is only a two and a half year timeframe. The returns pattern is in line with what I had anticipated. However, the medium risk portfolios outperformance even surprised me. The high risk portfolio did exactly as it should, rally very strongly when high risk strategies are en vogue. I will be excited to see how it fares in a future environment where emerging markets generally outperform.
The most pleasing aspect for me is that the algorithm improved the risk/return metric in all instances (reflected in the above Sharpe figures). As such the algorithm outperforms the so called experts who simply take risks (often unwarranted) to try and improve returns. The clearest indication of that is in the low risk portfolio. The 80-20 low risk portfolio stuck with true low risk options and so was less volatile yet matched the return from the AFI Cautious portfolio where they were investing in higher risk strategies. Also bear in mind that the 'experts' would charge typically a 3% initial fee for implementing their tips along with up to a 1% annual charge. This isn't reflected in the return figures above, and neither is the cost of 80 20 Investor but that is minimal by comparison.
There are plenty of interesting angles which I could explore in future around this piece of research. One question it might raise among you is that should you just shun the high and low risk funds and just buy the medium risk funds? Of course I know some people do and to good effect. The idea behind 80-20 Investor is that it is flexible and allows people to use it how they choose. However bear in mind that the medium risk portfolio can vary is asset mix quite considerably. In the last 6 months alone its equity content has varied from 60% to 90%. That means that the risk profile of a portfolio based solely on those funds would change significantly. I'd argue that it's not all about performance figures it's also about matching your risk profile. That's why I use the medium risk funds as a core for my £50,000 portfolio but still invest in high and low risk funds to give control over the risk and asset mix.

£200 Pension Cashback Offer
Make a qualifying deposit or transfer a pension to our partner Interactive Investor.
- Deposit or transfer a pension of at least £20k and you could earn £200 cashback
- Terms and Fees apply, Capital at risk
- New & Existing customers opening a SIPP
- Offer ends 31st July 2026
Before starting your transfer, check you won't lose any valuable benefits (such as guaranteed annuity rates or a lower protected pension age) and find out what exit fees you might have to pay
