

This time last year I carried out some bold research and picked the Funds to 'buy & forget' in 2015 & the Perfect Portfolio. I realise that some people may choose funds within the core of their portfolio to hold for the long term while applying 80-20 Investor's algorithm elsewhere in their portfolio. The original piece of research identified those funds that would be able to grow your portfolio but withstand market crashes. So how did my selection get on? What was the best buy and hold strategy in 2015? What about buy and hold funds for 2016?
2015's Buy and hold selection
You may recall that rather than just look at the best and worst performers over 2014, I analysed the performance and behaviour of funds during the 2 market sell-offs in 2014. I analysed every unit trust out there in the key buy and hold sectors. Those investors most likely to buy and hold tend to stick to unit trusts, rather than ETFs or investment trusts. So I analysed over 1,100 funds in the following sectors:
- Flexible Investment
- Global Retail
- Mixed Investment 0%-35%
- Mixed Investment 20%-60%
- Mixed Investment 40%-85%
- Targeted Absolute Return
- UK All Companies
- UK Equity Income
Then I determined the funds that not only outperformed significantly in both market sell-offs but also outperformed over the entire period. After analysing all the funds there were 4 funds that stood out as strong contenders for investors worried about a future market sell-off, yet wanting to remain invested. The funds were:
Fidelity Multi Asset Defensive & Vanguard - LifeStrategy 20% Equity which are members of the Mixed Investment 0%-35% Shares sector. Also Kames UK Equity Absolute Return and Old Mutual UK Opportunities which are members of the Targeted Absolute Return sector.
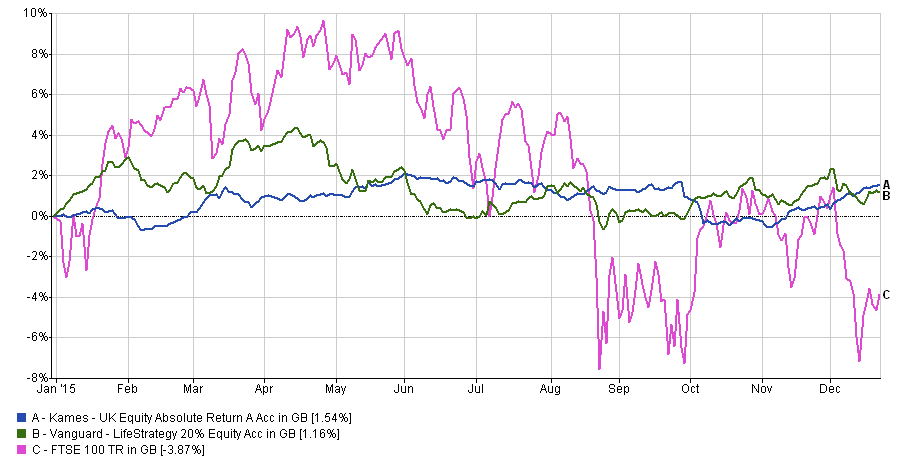
The chart below shows how they fared over the year versus the managed sector averages and the FTSE 100.
| Fund/Sector | Year to date return % |
| Kames - UK Equity Absolute Return | 1.54 |
| Vanguard - LifeStrategy 20% Equity | 1.16 |
| Mixed Investment 40%-85% Shares sector average | 0.76 |
| Mixed Investment 20%-60% Shares sector average | 0.16 |
| Fidelity - Multi Asset Defensive | -0.25 |
| Mixed Investment 0%-35% Shares sector average | -0.31 |
| Old Mutual - UK Opportunities | -0.78 |
| FTSE 100 | -3.87 |
Two of the funds in particular performed well, namely Kames UK Equity Absolute Return & Vanguard LifeStrategy 20% Equity. Not only that, but as the chart below shows both barely dipped during the biggest market sell-offs (the pink line) in 2015 which is just as important as the final return figure. That is an amazing result given how difficult 2015 was for investors.
The robustness of the original research is highlighted by the fact that the Vanguard LifeStrategy 20% Equity has been selected in December's Best of the Best Selection by our algorithm. You'd almost think I had a crystal ball, but I don't I just have a robust investment process.
The best buy and hold strategy of 2015
As highlighted in my article 2015 review & 2016 outlook the 80-20 Investor algorithm outperformed the market and an equivalent passive investment approach (even when taking charges into account), returning over 4% at the time of writing. That would have been achieved if someone had tweaked their portfolio each month in line with the monthly Best of the Best Selection changes.
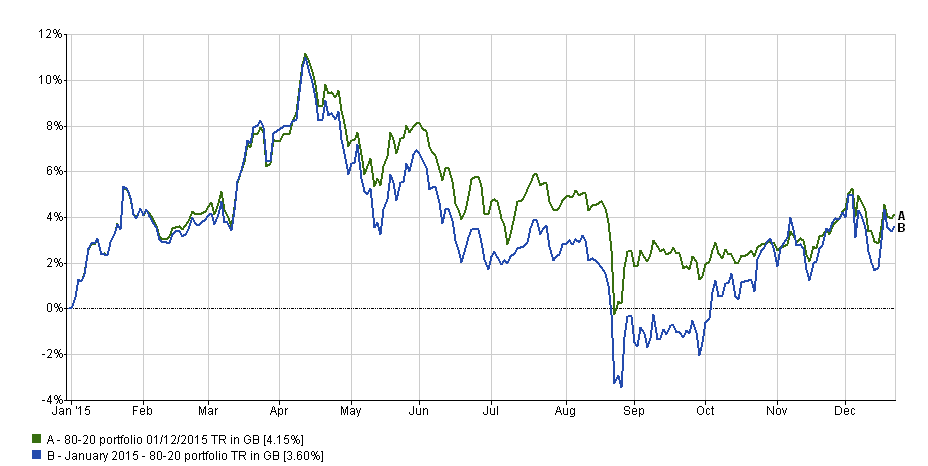
However what would have happened if someone had bought January 2015's Best of the Best Selection and then just held on to them for the rest of the year, making no fund switches? The chart below shows what would have happened (blue line) versus the monthly switching of the 80-20 Investor algorithm.
One year is a short period of time in momentum based investing. Yet you can see that after 5-6 months the regularly reviewed portfolio starts to significantly outperform, in part because it reacted to falling markets and reduced the portfolio's risk level. The market bounce in October (the biggest in over 4 years) helped the January portfolio catch up.
At the end of the year the January portfolio made 3.6%, while the regularly reviewed portfolio made 4.15% but more importantly spent the entire year (except 1 day in positive territory). As an aside the research behind the 80-20 Investor algorithm allows for funds to be held for as long as 6 months. So it is interesting that for the first 4-5 months the two portfolios closely tracked each other before diverging, as would be expected.
80-20 Investor was designed so that it would help boost members' returns no matter when they were able to take the time to review their portfolio. The table below shows that it achieves that aim, even in a year like 2015 which was a difficult one for investors to make money.
| Portfolio | 2015 Return % |
| 80-20 Investor (regularly reviewed) | 4.15 |
| 80-20 Investor (January) | 3.6 |
| Passive tracker portfolio | 0.96 - 1.13 |
| Average fund manager | 0.37 - 1.02 |
| FTSE 100 | -4.35 |
The buy and forget funds for 2016
I have performed the same analysis as I did last year but focusing on the market sell-offs in August 2015 and December 2015 (as can be seen in the chart of the FTSE 100 below):
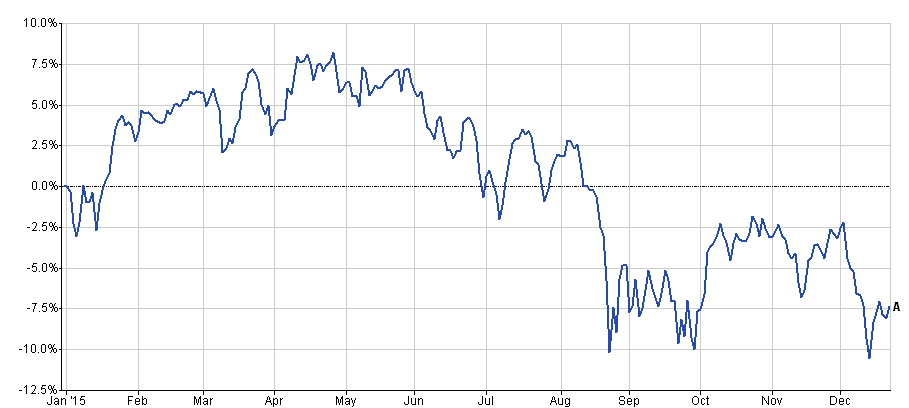
This yielded five funds with buy and forget potential for 2016:
- Artemis - US Absolute Return (from the Targeted Absolute Return sector)
- BlackRock European Absolute Alpha (from the Targeted Absolute Return sector)
- JPM - Global Macro Opportunities (from the Targeted Absolute Return sector)
- Jupiter - Absolute Return (from the Targeted Absolute Return sector)
- Kames - UK Equity Absolute Return (from the Targeted Absolute Return sector)
It's interesting to see that Kames - UK Equity Absolute Return once again makes the grade this year. If you are looking for a passive solution then the Vanguard LifeStrategy 20% Equity remains the best bet.
The premise is that the big themes in 2015 will still dictate the path of markets in 2016.
(image by Stuart Miles, freedigitalphotos.net)
The material in any email, the MonetotheMasses.com website, associated pages / channels / accounts and any other correspondence are for general information only and do not constitute investment, tax, legal or other form of advice. You should not rely on this information to make (or refrain from making) any decisions. Always obtain independent, professional advice for your own particular situation. See full Terms & Conditions and Privacy Policy
Neither MoneytotheMasses.com/80-20 Investor nor its content providers are responsible for any damages or losses arising from any use of this information. Past performance is no guarantee of future results.
Funds invest in shares, bonds, and other financial instruments and are by their nature speculative and can be volatile. You should never invest more than you can safely afford to lose. The value of your investment can go down as well as up so you may get back less than you originally invested.
Information provided by MoneytotheMasses.com/80-20 Investor is for general information only and not intended to be relied upon by readers in making (or not making) specific investment decisions.
Appropriate independent advice should be obtained before making any such decisions. Leadenhall Learning (owner of MoneytotheMasses.com/80-20 Investor) and its staff do not accept liability for any loss suffered by readers as a result of any such decisions.
The tables and graphs are derived from data supplied by Trustnet. All rights Reserved.

£200 Pension Cashback Offer
Make a qualifying deposit or transfer a pension to our partner Interactive Investor.
- Deposit or transfer a pension of at least £20k and you could earn £200 cashback
- Terms and Fees apply, Capital at risk
- New & Existing customers opening a SIPP
- Offer ends 31st July 2026
Before starting your transfer, check you won't lose any valuable benefits (such as guaranteed annuity rates or a lower protected pension age) and find out what exit fees you might have to pay
