

Last week I published the research article "Investing in my portfolio’s high-risk funds only – Part 1" which explored what an investor would have achieved had they solely invested in the high-risk funds within my £50k portfolio.
The article was inspired by a request from an 80-20 Investor via Chatterbox. However, a secondary part of the request centred upon what would happen if you applied market-timing to the new high risk only portfolio using the indicator first discussed in another 80-20 Investor article titled 'Navigating market tops and bottoms'.
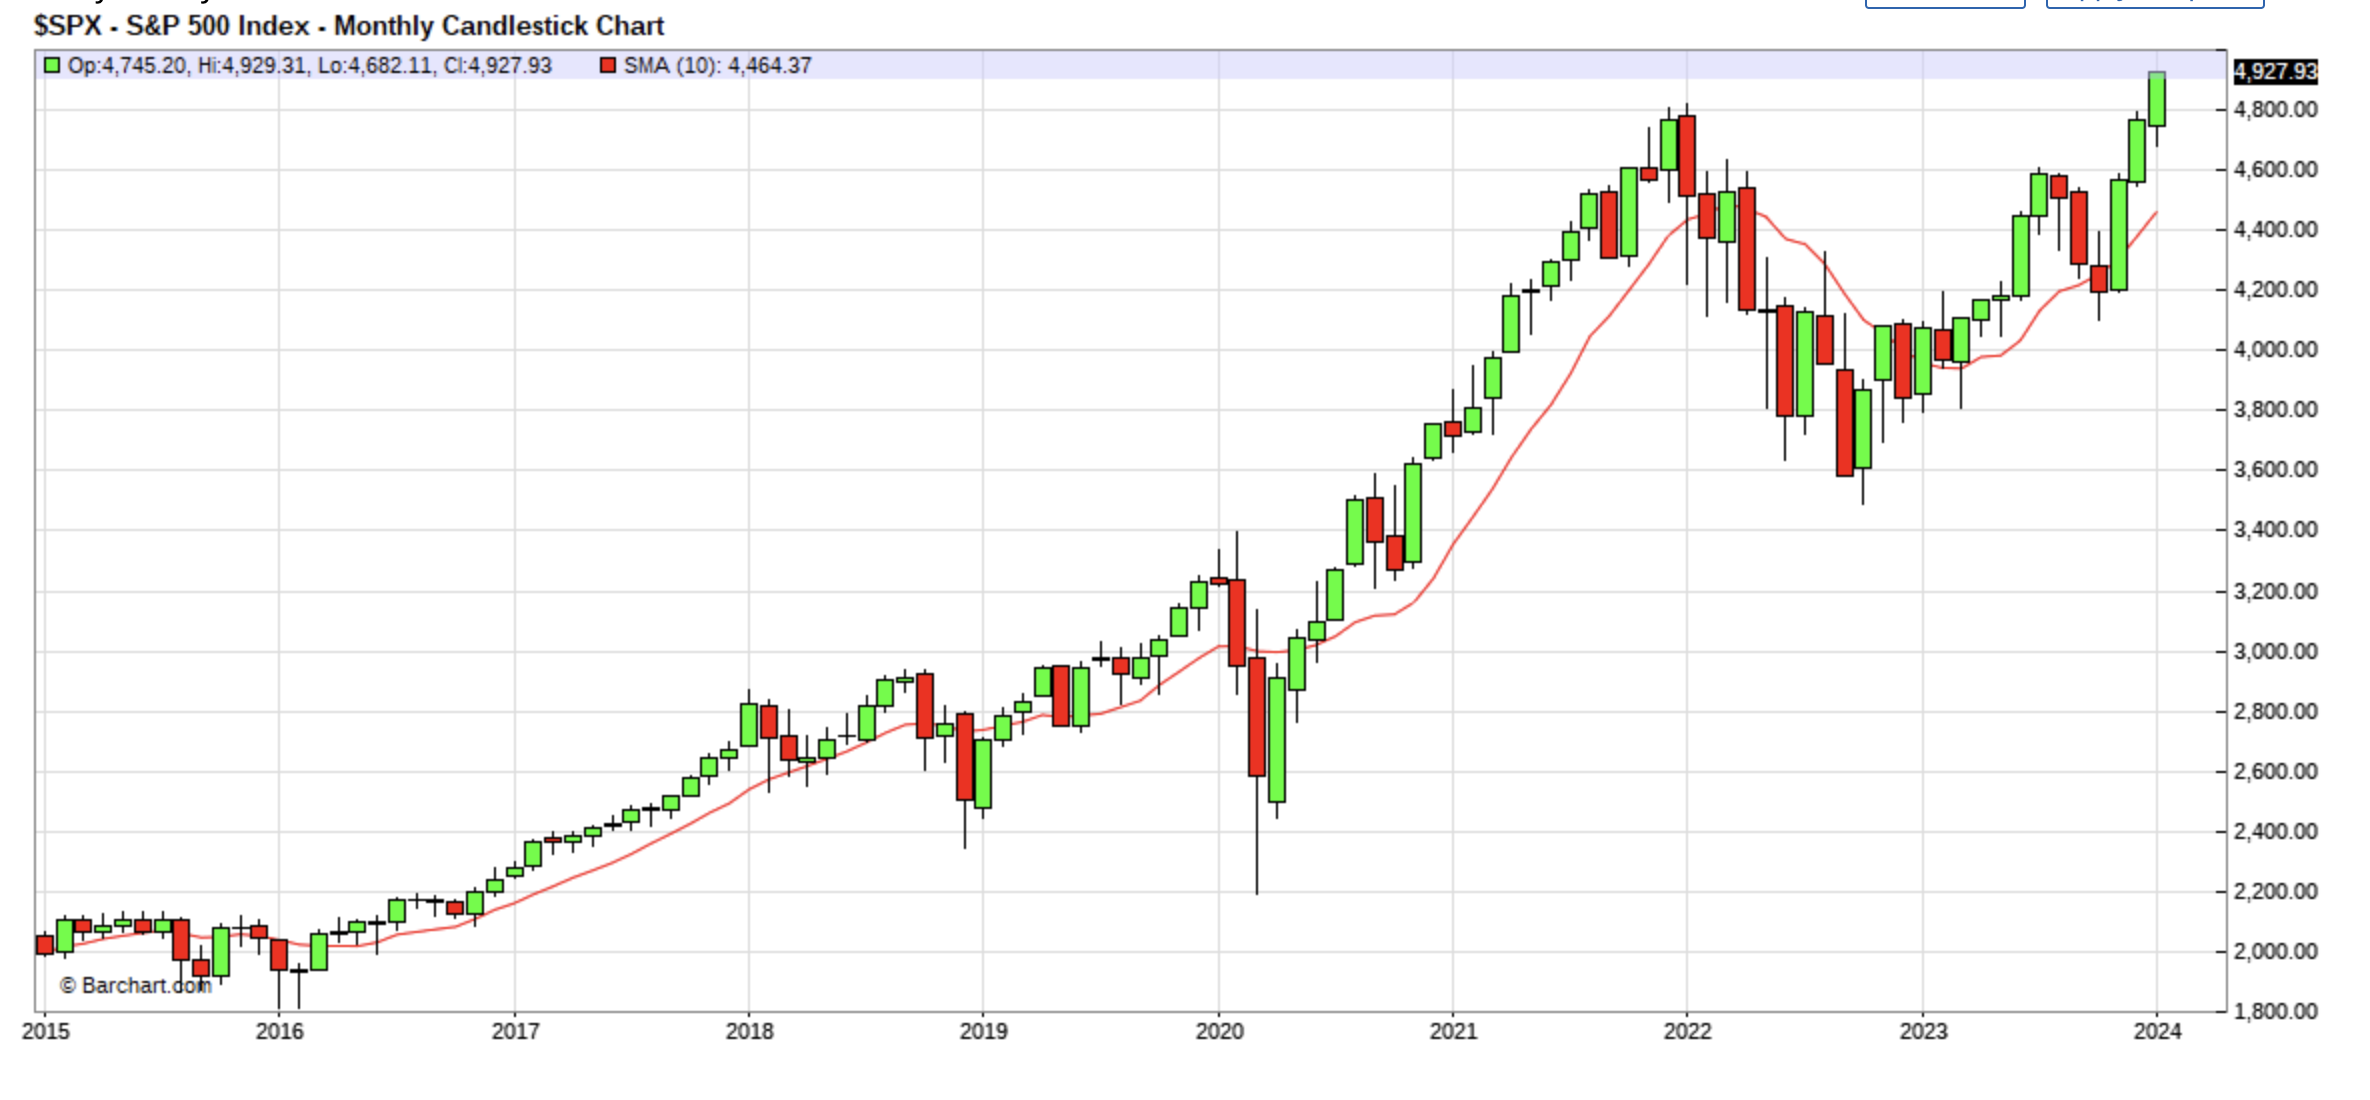
If you read the original 'Navigating market tops and bottoms' article it explains how the 10-month moving average (10MMA) indicator can be applied. In summary, if on a monthly basis an index closes above its 10-month moving average line then it suggests that you should remain invested in the market. If however, it closes below the 10-month moving average line then it's a sign to reduce risk and or move into cash. The index used in the original analysis is the S&P 500 and the chart below shows the path of this indicator going back to March 2015, when I started my £50k portfolio.
Methodology
In part 1 of this research I created two version of the new high risk only £50k portfolio:
- Version 1 - the Equal high risk portfolio. Under this option I assumed an investor looked at my standard £50k portfolio reviews each month and built a portfolio where they split their money equally across the higher risk funds only.
- Version 2 - Weighted high risk portfolio. This alternative option weights the holdings within the high risker funds to reflect my convictions at the time.
Ultimately there was little difference between the performance of the two portfolios, with the equal-weighted portfolio marginally outperforming. So when looking at the impact of market-timing it makes sense just to apply it to version 1 where the high risk funds are held equally.
Looking at the S&P 500 and its 10MMA, here is a list of when an investor would have entered and exited the market since I've been running my £50k portfolio.
| Date switched out of the market | Date switched back into the market |
| 1-9-2015 | 1-11-2015 |
| 1-1-2016 | 1-4-2016 |
| 1-11-2018 | 1-12-2018 |
| 1-1-2019 | 1-3-2019 |
| 1-6-2019 | 1-7-2019 |
| 1-3-2020 | 1-6-2020 |
| 1-3-2022 | 1-4-2022 |
| 1-5-2022 | 1-12-2022 |
| 1-1-2023 | 1-2-2023 |
| 1-11-2023 | 1-12-2023 |
Using these dates I created a market-timed version of the original higher risk version of my portfolio (which invests in the high and medium risk funds in my standard £50k portfolio) as well as a market-timed version of the new high risk only fund portfolio (equally weighted).
The chart below shows the performance of each of the following:
- Original 50k higher risk portfolio which I publish at the bottom of my portfolio reviews each month (purple line)
- Original 50 higher risk portfolio with market timing (red line)
- New higher risk funds only portfolio (blue line)
- New higher risk funds only portfolio with market timing (green line)
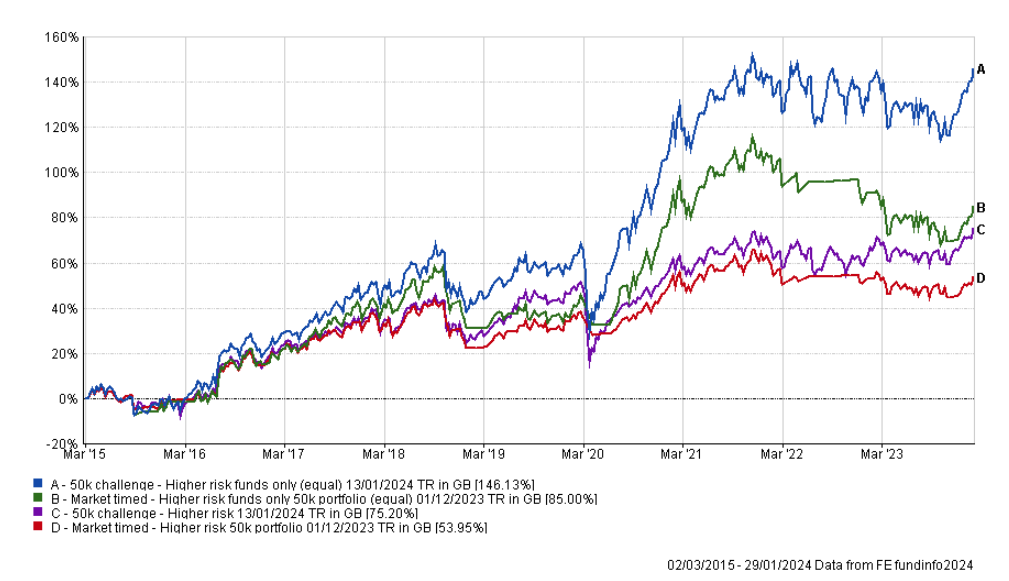
In 2021 I applied market timing to the normal higher risk £50k portfolio (that I publish each month at the bottom of my portfolio reviews). That portfolio is the purple line in the chart above. Back in 2021 I found that using the 10MMA impaired performance the more risk you took. But it did protect you from serious market implosions (bear markets) such as in 2020. However, the greater the risk profile the greater the negative impact on long term performance. Think of it like an insurance policy, the greater the risk of a claim the greater the cost.
This observation still holds true when applying the 10MMA indicator to the new Market timed Higher risk funds only £50k portfolio. The cost of downside protection is the 61% difference in performance between the blue line and the green line in the chart above.
But it's not just about performance, we can also compare the key statistical metrics, which I referred to in part 1 of this research, namely alpha, beta, maximum drawdown, Sharpe ratio, Sortino ratio and volatility. For a full explanation of each statistic scroll to the bottom of the first part of this research.
I have colour coded each column so that blue indicates the best portfolio for the given metric, green is the 2nd, yellow is 3rd while red is last.
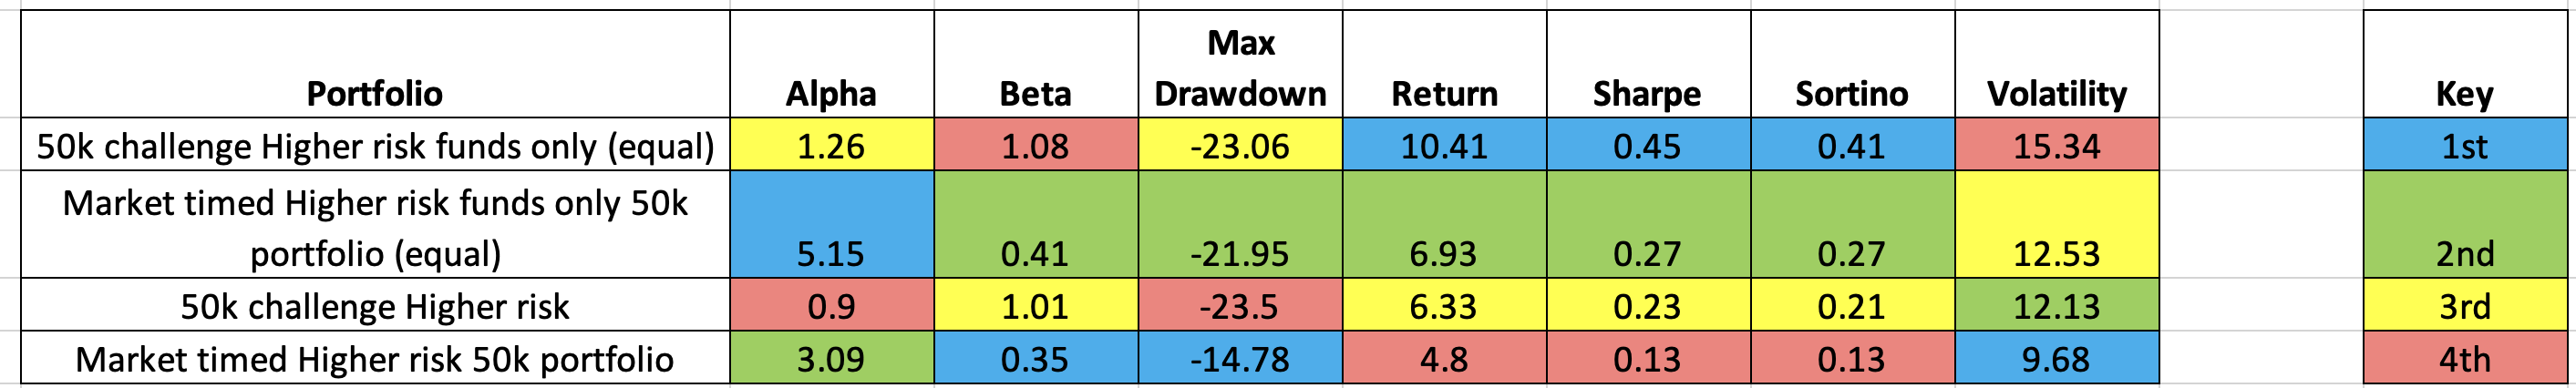
As you can see the new market-timed portfolio which is built from the higher risk funds only has the highest alpha (and one of the lowest betas), but lags the non-market timed version for annualised return, Sharpe ratio and Sortino ratio. Or in other words the market timing means that the portfolio behaves differently to the wider market, usually to the benefit of the portfolio's performance. But the lag in Sharpe and Sortino as well as the annualised return shows that the market-timing approach doesn't squeeze as much performance from the risk it does take, when compared to the non-market timed portfolio of higher risk funds.
This is the dilemma of using something like the 10MMA indicator. The chart below shows the performance of the four portfolios during 2020 when the pandemic struck. The level of outperformance generated by market timing during the worst of the market slump can be seen in the chart below. If you focus on the green and blue lines you can see that by market-timing you avoided the market drawdown and ended the year in almost the same place as the non-market timed portfolio. Or in other words, you would have captured the upside but avoided most of the downside.

I have also included the Global sector average (the orange line) in the chart to show the outperformance over 100% global equity funds. The 10MMA clearly works in extreme situations. Where the 10MMA falls down is when it pulls you in and out of the market in quick succession (i.e when it triggers false alarms). This happened in 2022 and 2023.
In summary while market-timing can reduce drawdowns you can also miss out on a significant amount of upside over the long term. In fact, if you refer back to part 1 of this research you will notice that the performance figure for the average global equity fund across the full time period is actually higher than that of the new market-timed high risk only portfolio.
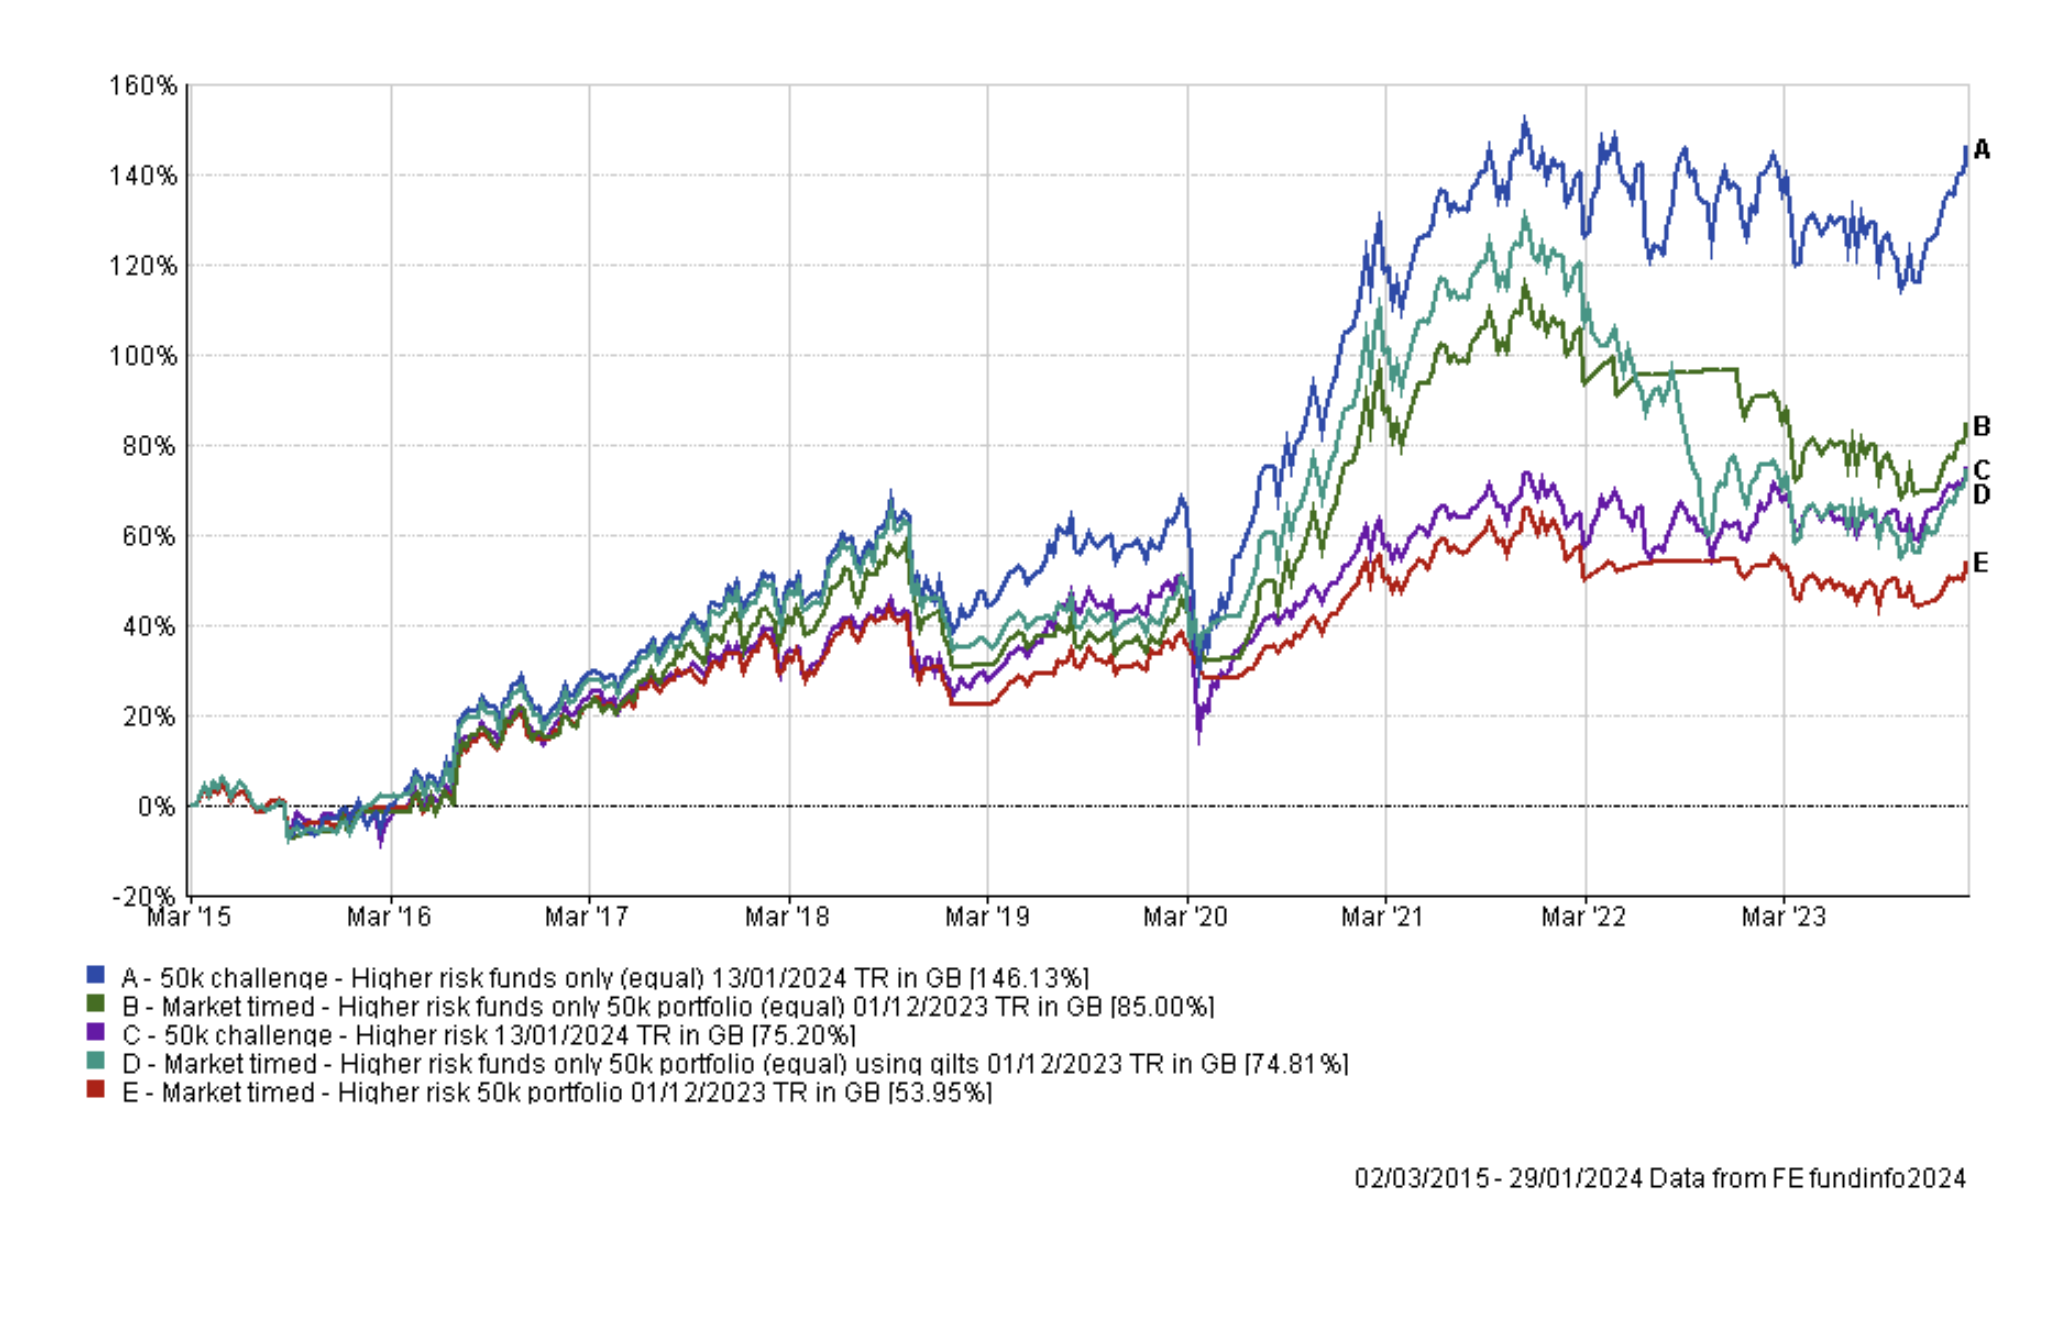
The one final thing to mention is that in a previous market timing research article I looked at what would have happened if instead of switching into cash I assumed I switched into a UK Gilt fund. At the time of the original research this boosted performance massively. So, I applied the same principle to the new market-timed portfolio of high risk funds but as you can see (from the light green line labelled 'D') on the chart below the outcome was worse, thanks to the collapse in bond markets in 2022. You would have ended up with little more than someone who'd invested in the standard higher risk version of my portfolio which invests in both medium and high risk funds.
So the message is... if you want to take risk... then take risk... but if you want to manage risk then diversify rather than market-time.

£200 Pension Cashback Offer
Make a qualifying deposit or transfer a pension to our partner Interactive Investor.
- Deposit or transfer a pension of at least £20k and you could earn £200 cashback
- Terms and Fees apply, Capital at risk
- New & Existing customers opening a SIPP
- Offer ends 31st July 2026
Before starting your transfer, check you won't lose any valuable benefits (such as guaranteed annuity rates or a lower protected pension age) and find out what exit fees you might have to pay
