

If you have been following my weekly/monthly newsletters you will know that both bond and equity markets have been wrestling with rising inflation all year. At the same time, they have been trying to second guess the outlook for global economic growth. On occasion when the market fears a downturn in economic growth, talk of stagflation comes to the fore. Stagflation refers to an economic pattern when inflation is high or increasing despite high unemployment and slow economic growth. However, when the market becomes optimistic about economic growth in the face of rising inflation then talk is of the reflation trade.
I have previously carried out analysis on the funds that tend to outperform in each environment, which is listed below:
Arguably at this precise moment in time, we have veered back towards the reflation trade, but for much of 2021 the consensus over stagflation or reflation has switched back and forth, moving asset prices accordingly, and this will no doubt continue to happen.
However, what I want to do in this research piece is focus on the low-risk portion of an investor's portfolio. As bond yields have been rising it means that bond prices (and therefore bond funds) have been falling in value. For a straightforward bond/equity portfolio that means that bonds are proving a drag on performance. Of course, the aim of diversification is that when certain areas of your portfolio (in this case bonds) are struggling other areas of the portfolio (perhaps equities) can take up the mantle and provide positive returns to counter the negative returns experienced among an investor's bond holdings.
The heatmaps provided in the above research were useful. By comparing those bond funds that outperformed and provided positive returns in both periods of rising bond yields it is possible to identify funds that perhaps have a better chance of preserving capital if bond yields do indeed keep rising.
However, those heatmaps were split by sector categorisation. In the research articles, I highlighted that sectors are not a homogenous group of funds. Typically, within each sector, there is a wide range of funds with different remits and mandates. It was this fact that enabled me to identify the winners and losers within each market environment (reflation and stagflation). However, the heatmaps did not assign the 80-20 Investor risk ratings to each fund. So for example, a fund that was highlighted as a winner in a reflation environment that inhabited the typically low-risk Targeted Absolute Return sector, could have actually been deemed medium risk by the 80-20 Investor algorithm, yet there was no way of telling.
Technically this left investors with the question that if the low-risk portion of their portfolio (which is mostly invested in bonds) is struggling, what low-risk alternatives are there to preserve capital or potentially make money in an environment when bond yields keep rising? The research below attempts to answer that question.
Methodology
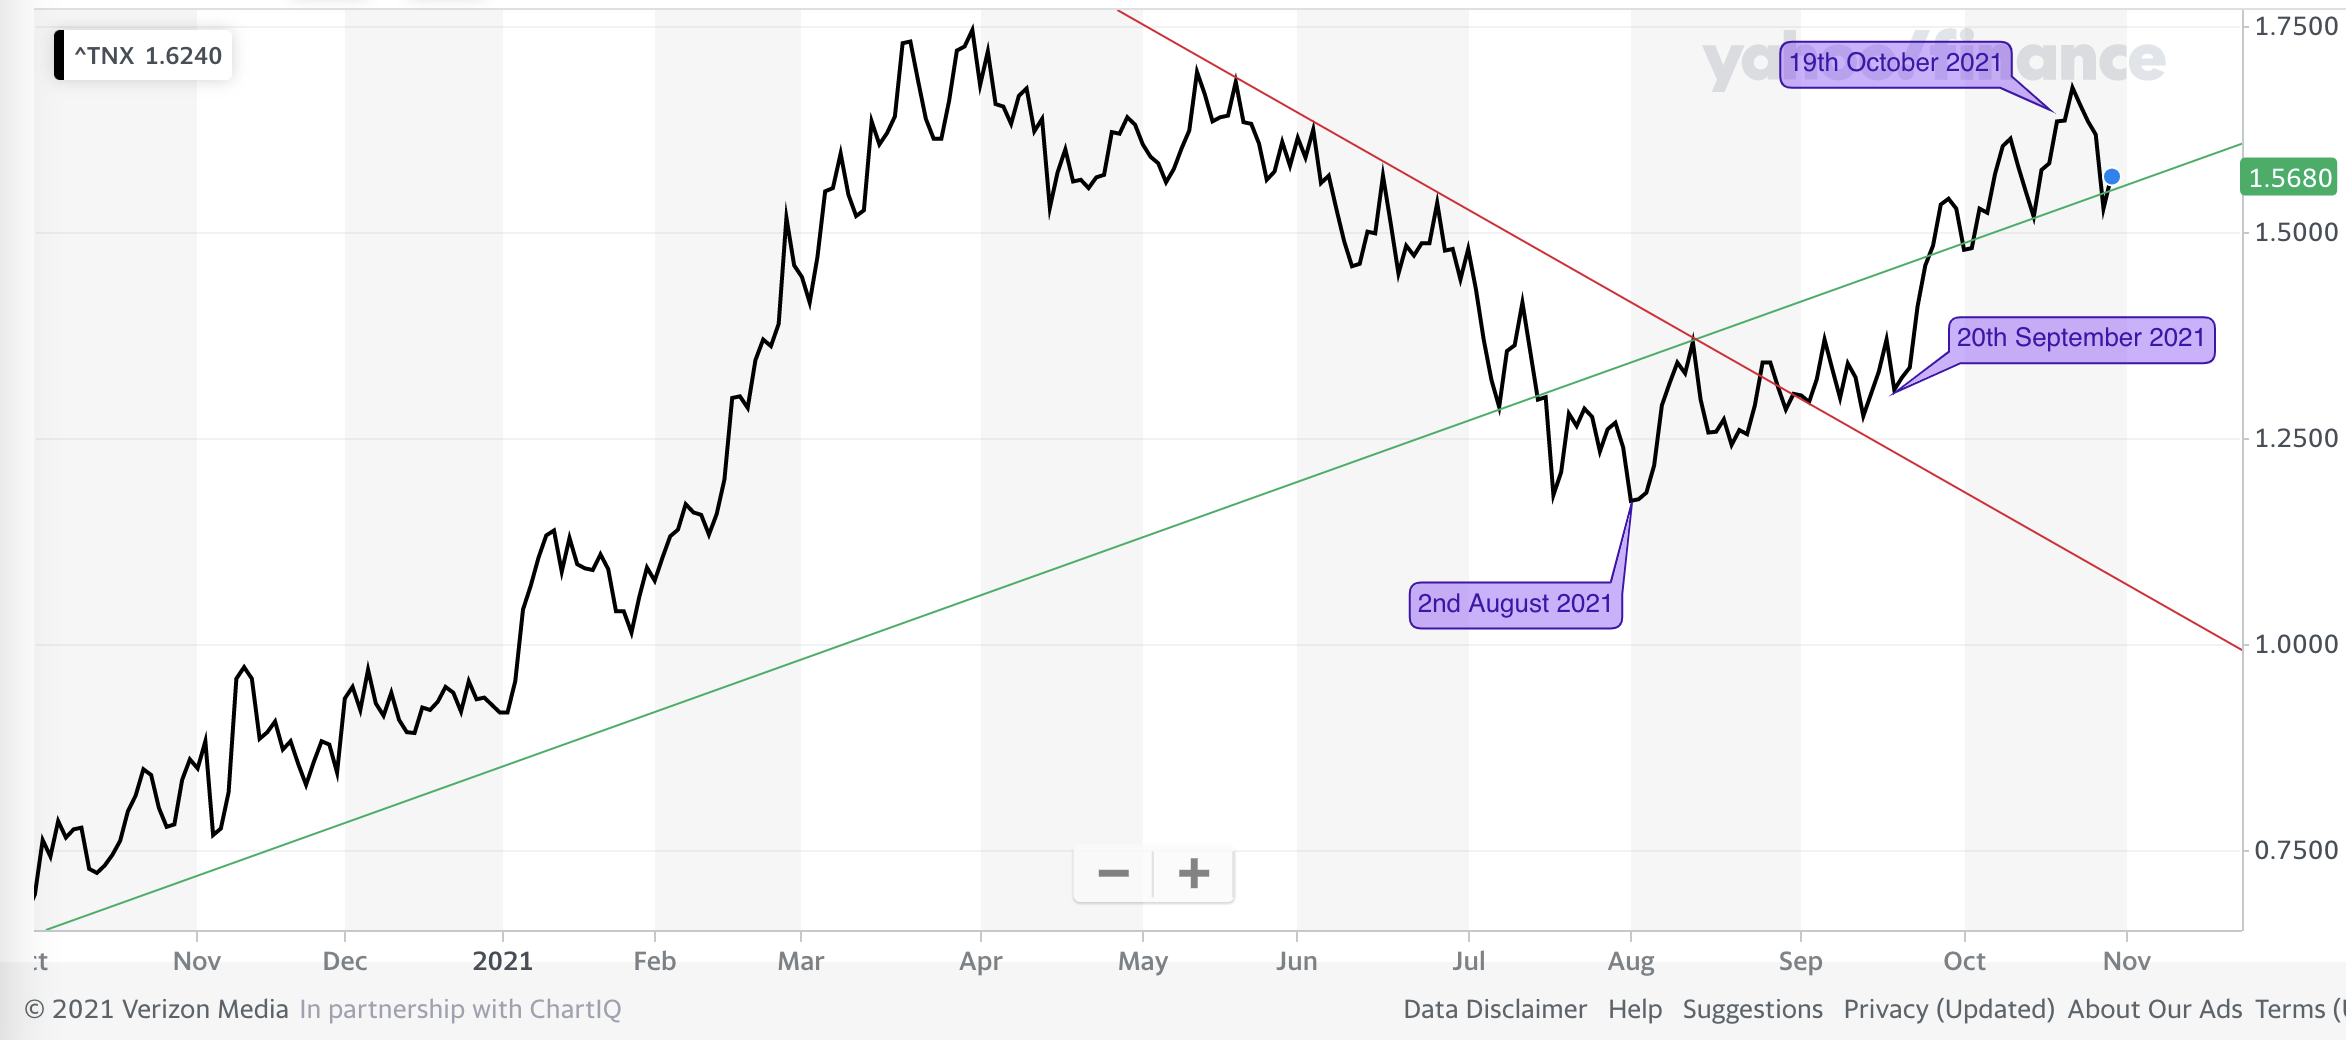
To set about answering the above question I looked at two periods where bond yields had consistently risen higher. The chart below (click to enlarge) shows the movement of the 10 year US treasury yield during 2021. The first period of time I use in this research is between 2nd August and 19th October (just before bond yields began to retreat over the last week). Interestingly, this time frame covers periods of time when both reflation or stagflation expectations were driving markets. So it is a good test of what might work when bond yields are rising, irrespective of the market narrative behind the move.
The second time frame covers the 1 month period preceding 19th October when bond yields suddenly accelerated higher. Periods of time with extreme market moves like this are useful because they almost ensure that the overriding driver behind asset price moves is, in this case, rising bond yields. So my analysis on fund performance during this period is about the best test I can construct on the impact of higher bond yields.
By analysing the performance of every unit trust out there across both time frames, after first categorising every fund by their risk rating as per the 80-20 Investor algorithm (which can differ from the fund's official risk profile on their factsheets), I produced the heatmap below to show how the low-risk funds performed.
How to use the heatmap
If you click on the link below it will load a pdf (which you can enlarge) that contains around 350 'lower risk' funds across a number of unit trust sectors. The heatmap is colour coded and the funds are grouped by sector, with the best performers in dark green and the worst in dark red. This heatmap gives you a starting point for the funds to look at and research, that the 80-20 Investor algorithm has deemed 'lower risk'. It is therefore easy to focus on those funds that have outperformed their peers in both time frames as a good starting point. A good example of a high yield bond fund that has performed well during the period (see the pdf below) of rising bond yields versus its peers is the Invesco High Yield fund which has been a regular in the BOTB.
Low-risk funds in a bond sell-off

£200 Pension Cashback Offer
Make a qualifying deposit or transfer a pension to our partner Interactive Investor.
- Deposit or transfer a pension of at least £20k and you could earn £200 cashback
- Terms and Fees apply, Capital at risk
- New & Existing customers opening a SIPP
- Offer ends 31st July 2026
Before starting your transfer, check you won't lose any valuable benefits (such as guaranteed annuity rates or a lower protected pension age) and find out what exit fees you might have to pay
