

Back in 2016 I wrote about the "Sell in May and Go away" adage.
"It's probably the oldest and most well-known investment adage... Sell in May and go away, don't come back till St. Leger Day. Or in other words, sell out of the stock market in May and stay in cash over the summer, before going back in at the start of September when the St Leger Stakes horse race is run. The theory is that by doing so you avoid the more volatile summer months which historically have also tended to underperform the rest of the year."
In that article, I referenced a number of pieces of research that suggested that following the Sell in May adage over the long-term could actually be detrimental to your investment returns. But as with many seasonal trends their reliability can ebb and flow. We've seen it with the Santa Rally phenomenon. In the intervening 5 years since my original look at the Sell in May phenomenon has the adage proved any more reliable? The short answer is no, with the adage last working in 2019 but having failed in 2016, 2017, 2018 and spectacularly so in 2020 following the post-pandemic rebound.
However, an interesting article in the Financial Times this week suggested a Sell in May approach has proven more reliable and useful in European markets over the last 15 years than in the US. In fact, using the Sell in May approach with the Euro Stoxx 600 outperformed a simple buy and hold strategy. It, therefore, raises the question of whether a Sell in May strategy can work in other equity markets and or indeed in other asset classes?
Does Sell in May ever outperform?
So I set about answering this question by analysing the past performance of a Sell in May strategy versus a buy and hold strategy in 30 different unit trust sectors going back as far as 1990. I won't include the details of all of the portfolio returns but suffice to say that over a 30-year time frame, a 15-year time frame and a 10 year time frame a Sell in May approach only outperformed a buy and hold strategy on 1 occasion. That is 1 occasion out of a possible 90 and that was if you had used a Sell in May approach (i.e investing in cash over the summer) when investing in Global Emerging Market equities over a 30 year period from 1990. The data didn't even corroborate the findings quoted in the Financial Times. That's likely because the FT focused on one index (the Euro Stoxx) when investing in Europe whereas a typical European equity unit trust fund is not so constrained and can invest in a range of companies. Furthermore, I assumed an investor achieved the average fund return for any given sector, which in itself will average out any outliers.
The result is quite damning for Sell in May advocates. While this shows that Sell in May doesn't outperform over the long term, of course in the short term you can strike lucky. The table below shows the odds of the typical fund within each sector producing a negative return over the last 15 years. The odds aren't much different if you use a 30-year timeframe, it's just that not all sectors have been in existence beyond 15 years hence the timeframe I've chosen. The first thing you will notice is that generally speaking the odds of a negative summer are higher than a negative winter. This can be explained by the fact that technically the winter period (September to the end of May) is longer but also because of the Winter seasonality we talk about in the Winter Portfolio article.
| Sector | % chance of summer slump (based on last 15 years) |
% chance of winter slump (based on last 15 years)
|
| Asia Pacific Excluding Japan | 46.67% | 13.33% |
| China/Greater China | 46.67% | 26.67% |
| Europe Excluding UK | 46.67% | 26.67% |
| European Smaller Companies | 60.00% | 26.67% |
| Flexible Investment | 46.67% | 26.67% |
| Global Bonds | 26.67% | 20.00% |
| Global EM Bonds Blended | 33.33% | 26.67% |
| Global EM Bonds Hard Currency | 26.67% | 26.67% |
| Global Emerging Markets | 53.33% | 26.67% |
| Global Equity Income | 46.67% | 26.67% |
| Global | 46.67% | 13.33% |
| Japan | 53.33% | 46.67% |
| Japanese Smaller Companies | 46.67% | 40.00% |
| Mixed Investment 0-35% Shares | 40.00% | 26.67% |
| Mixed Investment 20-60% Shares | 46.67% | 20.00% |
| Mixed Investment 40-85% Shares | 40.00% | 20.00% |
| North America | 33.33% | 20.00% |
| North American Smaller Companies | 33.33% | 26.67% |
| Property Other | 33.33% | 20.00% |
| Sterling Corporate Bond | 20.00% | 40.00% |
| Sterling High Yield | 40.00% | 20.00% |
| Sterling Strategic Bond | 40.00% | 26.67% |
| Targeted Absolute Return | 26.67% | 33.33% |
| Technology & Telecommunications | 26.67% | 13.33% |
| UK All Companies | 46.67% | 26.67% |
| UK Direct Property | 26.67% | 20.00% |
| UK Equity Income | 46.67% | 26.67% |
| UK Gilts | 13.33% | 40.00% |
| UK Index Linked Gilts | 20.00% | 46.67% |
| UK Smaller Companies | 53.33% | 26.67% |
A couple of key observations:
Firstly the odds of a negative return in the summer are lower than would be suggested by random chance (i.e. 50/50), but what is perhaps more interesting is that the odds are not consistent across asset classes or equity markets. Some sectors are clearly more likely to have a negative summer than their peers.
In fact as the table shows, the lower risk sectors, such as those exposed to bonds, gilts and targeted absolute return funds are less likely to have a negative summer. In addition, there are only four sectors where the odds of a negative summer are actually lower than the corresponding odds of a negative winter. That is very unusual and suggests that those asset classes perform better in the summer. The sectors in question are
- UK Gilts
- UK Index Linked Gilts
- Targeted Absolute Return
- Sterling Corporate Bond
In my original article that first pondered the Sell in May phenomenon, I linked to external research that suggested that buying individual shares from defensive equity sectors during the summer could improve your portfolio performance. What would happen if you instead switched asset classes from equities to a more defensive fund sector? Would we see a performance boost?
Defensive Sell in May strategy - Summer portfolio
In the table above I have highlighted a clear candidate for the defensive fund sector (UK Gilts) which could be used during the summer months to create a defensive version of the Sell in May strategy. The chart below shows the performance of investing in the average UK All Companies fund from 1st September 1992 until the 1st May 2021. This is shown by the red line and assumes you buy and hold. The green line represents a portfolio where you invested in the UK All Companies sector but switched to cash between 1st May and 1st September each year. The Blue line is the Defensive Sell in May strategy where instead of going into cash during the summer months you invested in a UK Gilt fund.
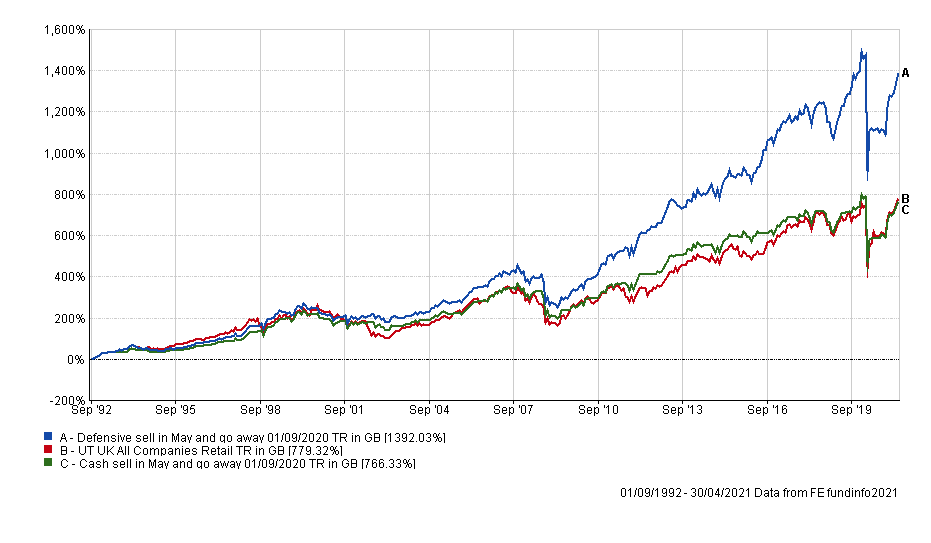
The difference in performance is staggering and the use of UK Gilts as a performance enhancer perhaps should not come as a surprise given its significance in the Perfect ISA portfolio. In some way the Defensive Sell in May portfolio is a seasonal version of the Perfect ISA portfolio. We could just as well have used the UK Equity Income sector in the Defensive Sell in May portfolio, rather than the UK All Companies sector, as we did in the Perfect ISA portfolio.
The table below shows the annualised return of each portfolio as well as how much £1.000 invested in 1992 would now be worth using each of the strategies.
| Strategy | Annualised return since 1992 | Value today of £1,000 invested in 1992 |
| Buy and Hold | 7.88% | £8,793 |
| Sell in May strategy (using cash) | 7.83% | £8,663 |
| Defensive Sell in May strategy (using gilts) | 9.89% | £14,920 |
The Sell in May adage may be unreliable if you attempt to cash in and out of the market. But those who are worried about the summer months would perhaps be better served going more defensive during the summer rather than bailing out of the market altogether.

£200 Pension Cashback Offer
Make a qualifying deposit or transfer a pension to our partner Interactive Investor.
- Deposit or transfer a pension of at least £20k and you could earn £200 cashback
- Terms and Fees apply, Capital at risk
- New & Existing customers opening a SIPP
- Offer ends 31st July 2026
Before starting your transfer, check you won't lose any valuable benefits (such as guaranteed annuity rates or a lower protected pension age) and find out what exit fees you might have to pay
