

I first wrote about the "sell in may" phenomenon in 2016 in my article "Should you sell in May and go away". The adage states that you "Sell in May and go away and don't come back till St. Leger Day", in other words, sell out of the stock market in May and stay in cash over the summer, before going back in at the start of September when the St Leger Stakes horse race is run. The theory is that by doing so you avoid the more volatile summer months which historically have also tended to underperform the rest of the year.
In my article, I referenced a number of pieces of research that suggested that following the Sell in May adage over the long-term could actually be detrimental to your investment returns. As with many seasonal trends their reliability can ebb and flow. In the intervening 6 years since my original look at the Sell in May phenomenon in 2016, its reliability has waned further. Following the adage and sitting in cash over the summer months last worked in 2019 but failed to do so in 2016, 2017, 2018 and spectacularly so in 2020. It also failed in 2021 when the FTSE 100 rallied 2.58% over the summer.
But just before the summer of 2021 I developed the concept of building a summer portfolio, where rather than disinvesting into cash over the summer months you move into defensive assets. You can read this research in full in my article "Summer portfolio & Sell in May".
Which assets perform best in the summer months?
As part of the research, I analysed the past performance of different assets over the winter and summer months. To do this I calculated the odds of the typical fund within each unit trust sector producing a negative return over the previous 15 years. I have now updated this table to take account of investment market movements in 2021, (see below).
Generally speaking, it's still the case that the odds of a negative summer are higher than a negative winter across nearly all sectors. This can be explained by the fact that technically the winter period (September to the end of May) is longer but also because of the Winter seasonality we talk about in the Winter Portfolio article.
| Sector | % chance of summer slump (based on last 15 years) |
% chance of winter slump (based on last 15 years)
|
| Asia Pacific Excluding Japan | 46.67% | 20.00% |
| China/Greater China | 46.67% | 33.33% |
| Europe Excluding UK | 40.00% | 33.33% |
| European Smaller Companies | 53.33% | 33.33% |
| Flexible Investment | 40.00% | 33.33% |
| Global Bonds | 20.00% | 26.67% |
| Global EM Bonds Blended | 26.67% | 33.33% |
| Global EM Bonds Hard Currency | 20.00% | 33.33% |
| Global Emerging Markets | 53.33% | 33.33% |
| Global Equity Income | 40.00% | 26.67% |
| Global | 40.00% | 20.00% |
| Japan | 46.67% | 46.67% |
| Japanese Smaller Companies | 40.00% | 40.00% |
| Mixed Investment 0-35% Shares | 33.33% | 33.33% |
| Mixed Investment 20-60% Shares | 40.00% | 26.67% |
| Mixed Investment 40-85% Shares | 33.33% | 26.67% |
| North America | 26.67% | 26.67% |
| North American Smaller Companies | 26.67% | 33.33% |
| Property Other | 33.33% | 20.00% |
| Sterling Corporate Bond | 20.00% | 40.00% |
| Sterling High Yield | 40.00% | 26.67% |
| Sterling Strategic Bond | 40.00% | 33.33% |
| Targeted Absolute Return | 26.67% | 40.00% |
| Technology & Telecommunications | 20.00% | 20.00% |
| UK All Companies | 40.00% | 33.33% |
| UK Direct Property | 26.67% | 20.00% |
| UK Equity Income | 40.00% | 26.67% |
| UK Gilts | 13.33% | 40.00% |
| UK Index Linked Gilts | 20.00% | 46.67% |
| UK Smaller Companies | 46.67% | 33.33% |
The odds of a negative return in the summer are not consistent across asset classes or equity markets. Some sectors are clearly more likely to have a negative summer than others. It remains the case that the lower risk sectors, such as those exposed to bonds, gilts and targeted absolute return funds are less likely to have a negative summer. It is also interesting to see that the odds of a negative summer when investing in UK stocks is significantly higher than if you invested in US equities.
Defensive Sell in May strategy - Summer portfolio 2021 performance
In the summer of 2021 when I created the summer portfolio UK Gilts was the best candidate for the defensive fund sector which could be used during the summer months to create a defensive version of the Sell in May strategy. The UK Gilts sector is highlighted in the table above (in bold) and you can see why it was chosen. So the summer portfolio assumes you invest in the UK All Companies sector by default but switch into UK Gilts between 1st May and 1st September each year. So how did the summer portfolio fare in reality during the summer of 2021? The performance of the summer portfolio is shown by the green line in the chart below. To calculate the performance I used the average return achieved by funds in the UK Gilts and UK All Companies sectors over the relevant time periods. The purple line represents the performance of investing in the average UK All Companies throughout (i.e. a buy and hold strategy). The brown line assumes you switched to cash between 1st May and 1st September.
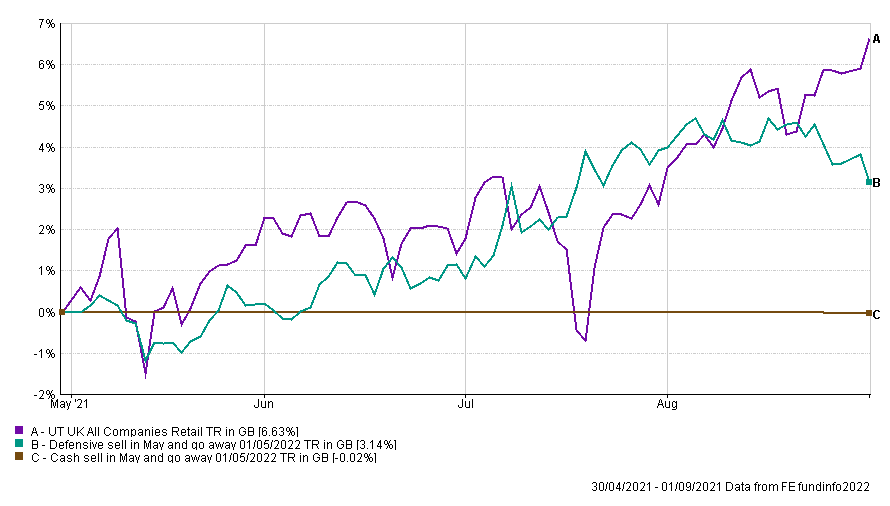
You can see that even despite the summer of 2021 being a strong period for equity markets, the defensive sell in May portfolio (aka the summer portfolio) was only pipped by the buy and hold equity strategy in the final weeks of August.
Summer portfolio long-term performance
If we now look at the difference in the long-term performance, up to the start of May 2022, of all three portfolios the difference remains staggering. Click on the image to enlarge it.
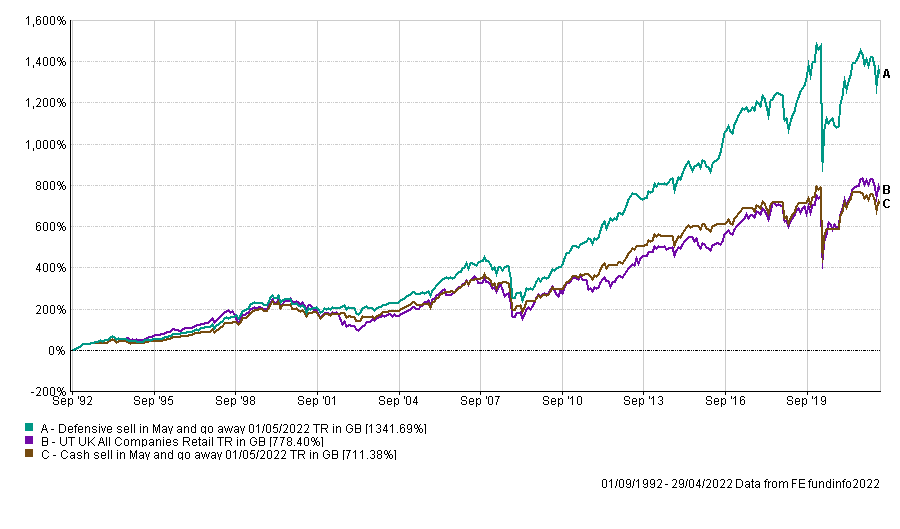
The table below shows the annualised return of each portfolio as well as how much £1,000 invested in 1992 would have been worth at the start of May 2022.
| Strategy | Annualised return since 1992 | Value on 1st May 2022 of £1,000 invested in 1992 |
| Buy and Hold (equity strategy) | 7.21% | £8,784 |
| Sell in May strategy (using cash) | 7.20% | £8,114 |
| Defensive Sell in May strategy (using gilts) | 9.11% | £14,417 |
Summer 2022 - performance so far
So the Sell in May adage may be unreliable if you attempt to cash in and out of the market. But those who are worried about the summer months may be better served going more defensive during the summer rather than bailing out of the market altogether. Even a year like 2021, which was a good summer for equity markets, wasn't bad for the summer portfolio. But what about a year like 2022, which has seen bond and equity markets globally enter bear markets?
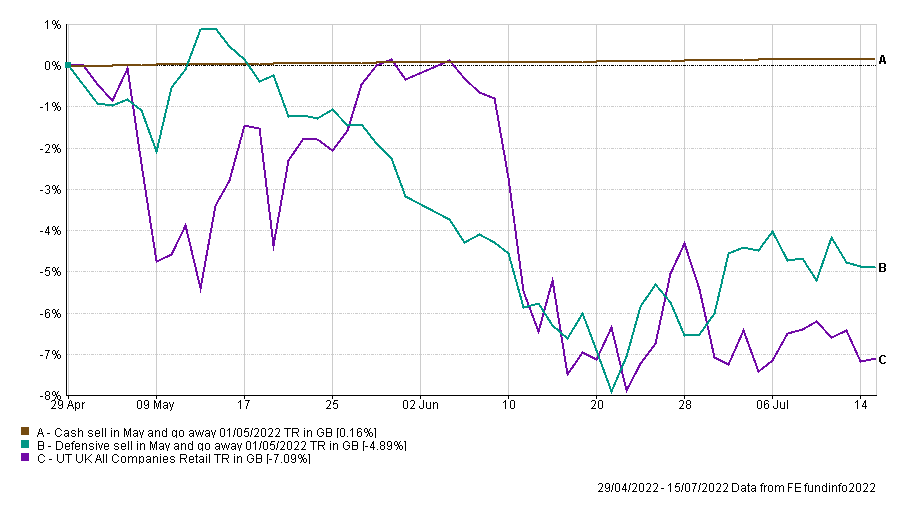
The chart below shows the performance so far this summer, since the 1st May 2022 of each portfolio. While the performance is disappointing the summer portfolio has preserved capital better than a buy and hold equity strategy, but has obviously underperformed moving into cash. It will be interesting to see how the rest of this summer will play out. But what we've seen play out in reality in 2021 and so far in 2022 suggests that the summer portfolio may indeed have legs.

£200 Pension Cashback Offer
Make a qualifying deposit or transfer a pension to our partner Interactive Investor.
- Deposit or transfer a pension of at least £20k and you could earn £200 cashback
- Terms and Fees apply, Capital at risk
- New & Existing customers opening a SIPP
- Offer ends 31st July 2026
Before starting your transfer, check you won't lose any valuable benefits (such as guaranteed annuity rates or a lower protected pension age) and find out what exit fees you might have to pay
