

I first wrote about the "sell in may" phenomenon in 2016 in my article "Should you sell in May and go away". The adage states that you "Sell in May and go away and don't come back till St. Leger Day", in other words, sell out of the stock market in May and stay in cash over the summer, before going back in at the start of September when the St Leger Stakes horse race is run. The theory is that by doing so you avoid the more volatile summer months which historically have also tended to underperform the rest of the year.
But just before the summer of 2021 I developed the concept of building a Summer portfolio, where rather than disinvesting into cash over the summer months you move into defensive assets. You can read this research in full in my article "Summer portfolio & Sell in May".
Defensive Sell in May strategy - Summer portfolio 2022 performance
When I created the Summer portfolio, the UK Gilts sector was the best candidate for the asset which could be used during the summer months to create a defensive version of the Sell in May strategy. This remained the case heading into the summer of 2022, as shown in the table below which emphasises that the UK Gilts sector had the lowest chance of a summer slump based on the 15 years prior to 2022.
| Sector | % chance of summer slump (based on last 15 years) |
% chance of winter slump (based on last 15 years)
|
| Asia Pacific Excluding Japan | 46.67% | 20.00% |
| China/Greater China | 46.67% | 33.33% |
| Europe Excluding UK | 40.00% | 33.33% |
| European Smaller Companies | 53.33% | 33.33% |
| Flexible Investment | 40.00% | 33.33% |
| Global Bonds | 20.00% | 26.67% |
| Global EM Bonds Blended | 26.67% | 33.33% |
| Global EM Bonds Hard Currency | 20.00% | 33.33% |
| Global Emerging Markets | 53.33% | 33.33% |
| Global Equity Income | 40.00% | 26.67% |
| Global | 40.00% | 20.00% |
| Japan | 46.67% | 46.67% |
| Japanese Smaller Companies | 40.00% | 40.00% |
| Mixed Investment 0-35% Shares | 33.33% | 33.33% |
| Mixed Investment 20-60% Shares | 40.00% | 26.67% |
| Mixed Investment 40-85% Shares | 33.33% | 26.67% |
| North America | 26.67% | 26.67% |
| North American Smaller Companies | 26.67% | 33.33% |
| Property Other | 33.33% | 20.00% |
| Sterling Corporate Bond | 20.00% | 40.00% |
| Sterling High Yield | 40.00% | 26.67% |
| Sterling Strategic Bond | 40.00% | 33.33% |
| Targeted Absolute Return | 26.67% | 40.00% |
| Technology & Telecommunications | 20.00% | 20.00% |
| UK All Companies | 40.00% | 33.33% |
| UK Direct Property | 26.67% | 20.00% |
| UK Equity Income | 40.00% | 26.67% |
| UK Gilts | 13.33% | 40.00% |
| UK Index Linked Gilts | 20.00% | 46.67% |
| UK Smaller Companies | 46.67% | 33.33% |
Just to clarify, the Summer portfolio assumes you invest in the UK All Companies sector by default but switch into UK Gilts between 1st May and 1st September each year.
So how did the Summer portfolio fare during the summer of 2022? The answer is dreadfully. The performance of the Summer portfolio is shown below (red line) versus remaining invested in UK equities (green line) and switching into cash (blue line).

During 2022 the Bank of England aggressively raised the base rate which made the fixed income offered by existing bonds less attractive, resulting in a broad bond market sell-off. In fact it was the worst year for US bonds for 250 years. But given that UK gilt funds and especially Index-linked gilts tend to be long duration, and don't benefit from a fall in the value of the pound, they were hit the hardest among bond sectors. Don’t forget that duration is a measure of sensitivity to interest rate moves. When we are talking about bonds, for every 1% increase or decrease in interest rates, a bond's price will change by roughly 1% in the opposite direction for every year of duration it has. So if a bond has a duration of 5 years then if the interest rate rises 1% the bond price will fall 5%. Bond funds own hundreds of bonds which when combined give the fund an overall duration which fund managers will look to control.
Summer portfolio long-term performance
So how does this impact the Summer portfolio's long-term performance? Well despite the setback in 2022 it is still impressive as shown in the chart below.
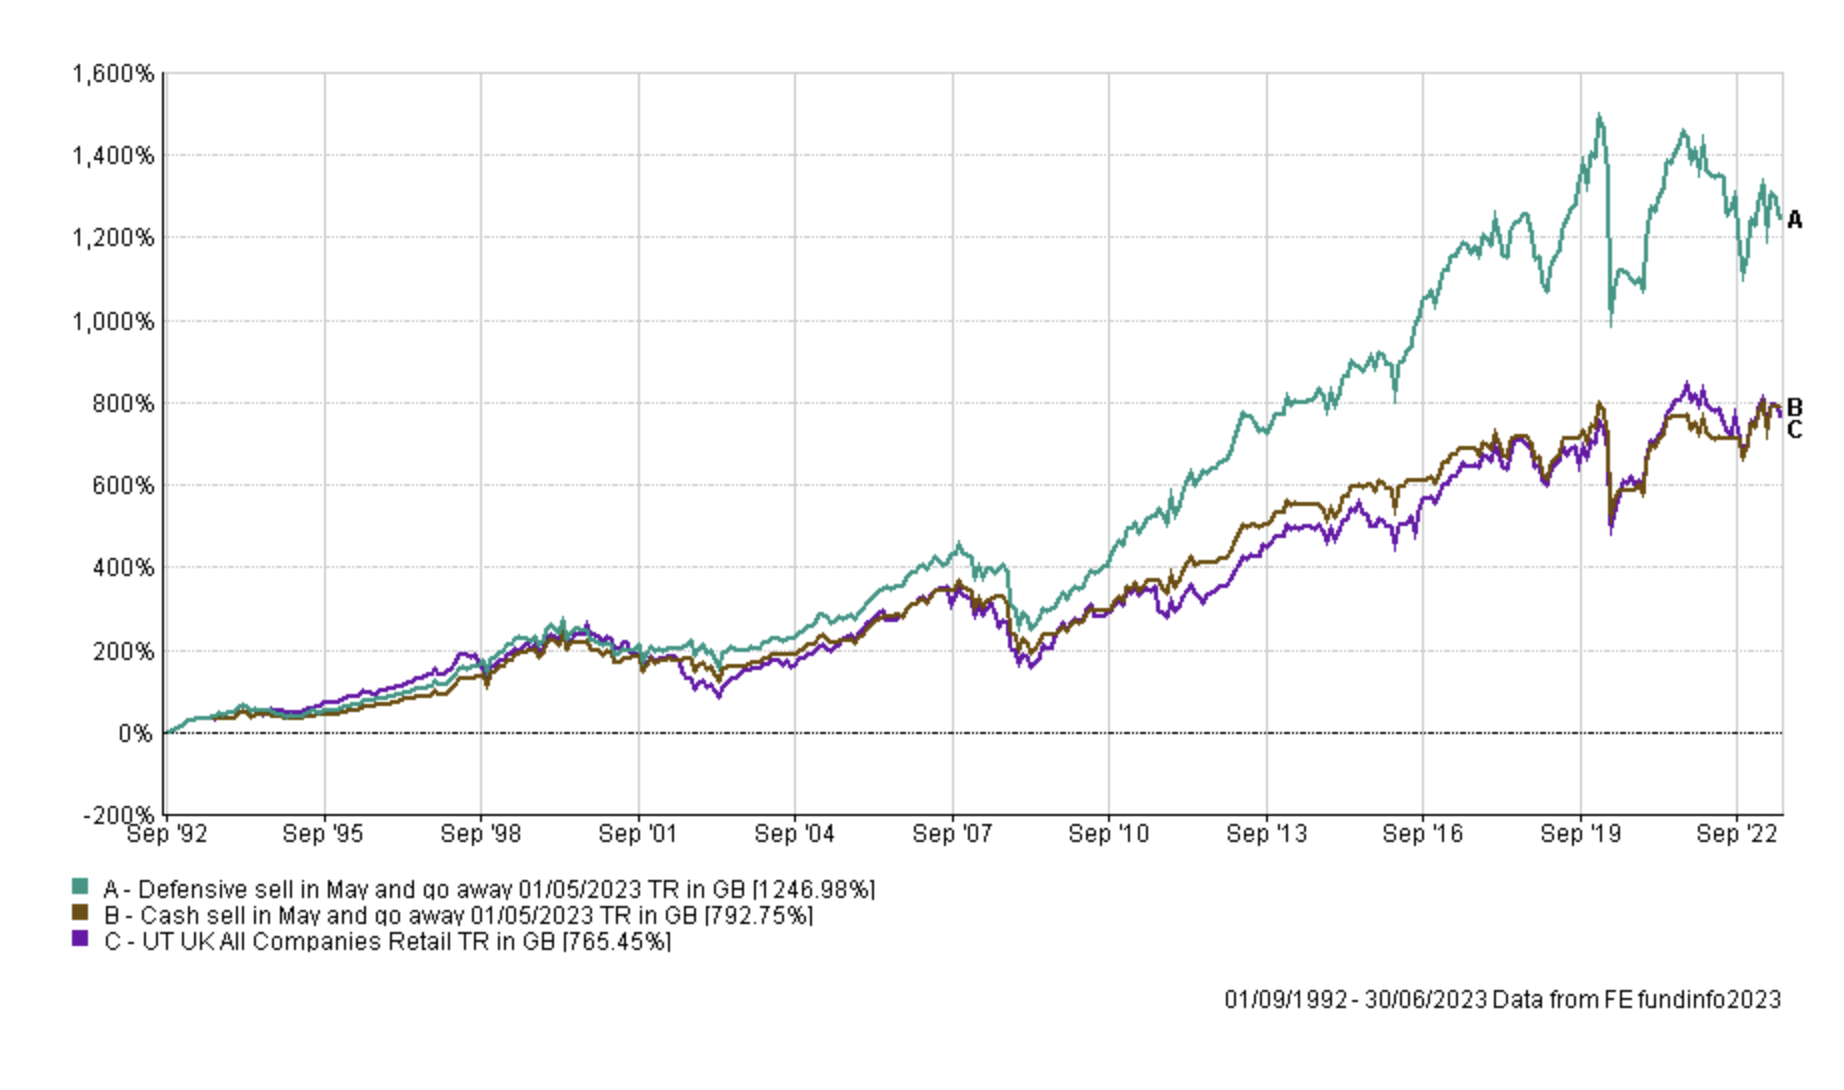
The table below shows the annualised return of each portfolio as well as how much £1,000 invested in 1992 would have been worth at the start of July 2023.
| Strategy | Annualised return since 1992 (figures in brackets are the figures from this time last year) | Value on 1st July 2023 of £1,000 invested in 1992 |
| Buy and Hold (equity strategy) | 7.18% (7.21%) | £8,654 |
| Sell in May strategy (using cash) | 7.29% (7.20%) | £8,927 |
| Defensive Sell in May strategy (using gilts) | 8.72% (9.11%) | £13,470 |
You can see that despite 2022 being one of the worst years on record for bonds the Summer Portfolio still significantly outperforms buy and hold over the long term.
Summer 2023 - performance so far
The chart below shows the performance so far this summer, since the 1st May 2023 of each portfolio. Once again the usually unreliable Sell in May cash strategy is outperforming both the Summer portfolio and the UK equity Buy and Hold strategy as it did in 2022.

In fact the chart below shows how the strategies have performed since the start of Summer 2022.
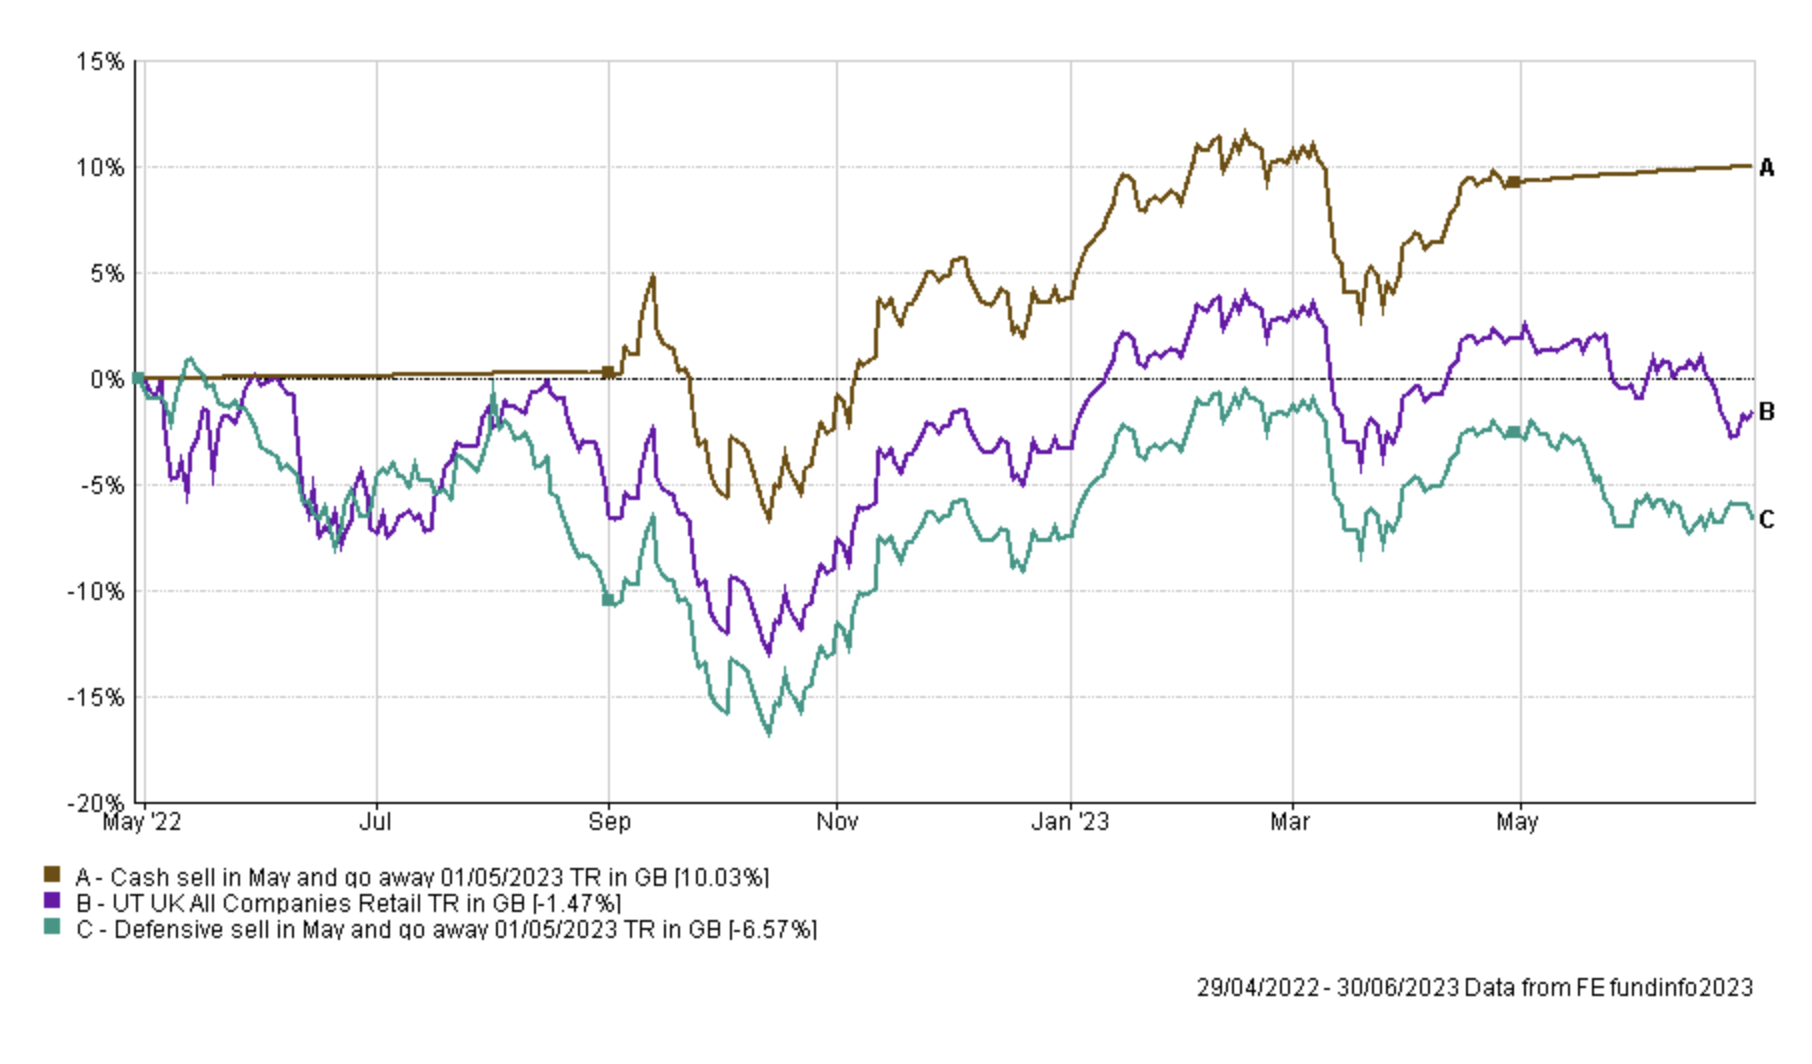
So clearly over the long term the Summer Portfolio still works, even taking into account the dismal bond market performance since central banks began aggressively hiking interest rates in late 2021. It also means that there is a sense that things can only get better for the Summer Portfolio. However the performance of the Summer portfolio during the last 18 months emphasises that macro trends will always trump seasonal trends. So if the macro backdrop doesn't change (i.e. the Bank of England continues to hike its base rate) then the Summer Portfolio may struggle for a while longer. But remember, the Summer Portfolio is a long-term strategy that will have increased levels of volatility.
It does then raise the question of whether an alternative asset class should replace UK Gilts in the Summer Portfolio?
Which assets still perform best in the summer months?
To answer this I re-analysed the past performance of different assets over the winter and summer months, taking into account the latest performance data (which includes 2022). I calculated the odds of the typical fund within each unit trust sector producing a negative return over the 15 years prior to 2022. Generally speaking, it's still the case that the odds of a negative summer are higher than a negative winter across most sectors. This can be explained by the fact that technically the winter period (September to the end of May) is longer but also because of the Winter seasonality we talk about in the Winter Portfolio article.
The numbers are coloured red where the latest % chance of a slump is now higher than this time last year, having now taken into account market moves in 2022 and into 2023. Ultimately UK gilts remain one of the best candidates for a defensive summer portfolio despite the recent setback, but other bond sectors including Sterling Corporate Bonds may well be worth consideration going forward.
| Name | % Chance of Summer slump over last 15 years |
% Chance of Winter slump over last 15 years
|
| Asia Pacific Excluding Japan | 53.33% | 26.67% |
| China/Greater China | 46.67% | 33.33% |
| Europe Excluding UK | 40.00% | 33.33% |
| European Smaller Companies | 53.33% | 26.67% |
| Flexible Investment | 40.00% | 26.67% |
| Global Bonds | 20.00% | 33.33% |
| Global EM Bonds Blended | 26.67% | 33.33% |
| Global EM Bonds Hard Currency | 13.33% | 40.00% |
| Global Emerging Markets | 53.33% | 40.00% |
| Global Equity Income | 40.00% | 20.00% |
| Global | 40.00% | 20.00% |
| Japan | 40.00% | 40.00% |
| Japanese Smaller Companies | 33.33% | 40.00% |
| Mixed Investment 0-35% Shares | 33.33% | 33.33% |
| Mixed Investment 20-60% Shares | 40.00% | 20.00% |
| Mixed Investment 40-85% Shares | 33.33% | 20.00% |
| North America | 20.00% | 26.67% |
| North American Smaller Companies | 20.00% | 33.33% |
| Property Other | 33.33% | 20.00% |
| Sterling Corporate Bond | 20.00% | 33.33% |
| Sterling High Yield | 40.00% | 20.00% |
| Sterling Strategic Bond | 40.00% | 26.67% |
| Targeted Absolute Return | 33.33% | 40.00% |
| Technology & Telecommunications | 26.67% | 13.33% |
| UK All Companies | 40.00% | 26.67% |
| UK Direct Property | 20.00% | 20.00% |
| UK Equity Income | 40.00% | 20.00% |
| UK Gilts | 20.00% | 46.67% |
| UK Index Linked Gilts | 26.67% | 53.33% |
| UK Smaller Companies | 46.67% | 33.33% |

£200 Pension Cashback Offer
Make a qualifying deposit or transfer a pension to our partner Interactive Investor.
- Deposit or transfer a pension of at least £20k and you could earn £200 cashback
- Terms and Fees apply, Capital at risk
- New & Existing customers opening a SIPP
- Offer ends 31st July 2026
Before starting your transfer, check you won't lose any valuable benefits (such as guaranteed annuity rates or a lower protected pension age) and find out what exit fees you might have to pay
