

2016 is little over a month old and it is already turning into an annus horribilis. Equity markets are in a tailspin and investors are running for the hills as central banks start to look a bit panicky. But the question on every investors' lips is when will the slide stop?
It’s the million dollar question which I don’t hold the answer to. However, below I’ve provided some broad technical analysis, looking at areas of support and resistance, on the three key global equity markets to give some insight on what we might expect.
UK stock market
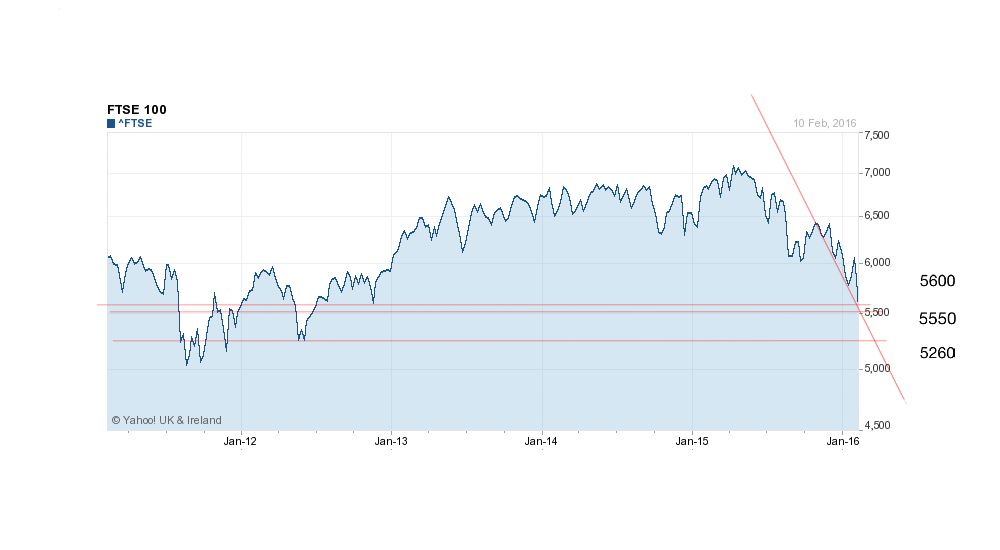
The FTSE 100 has had a torrid time of late and it doesn’t look like we’ve seen the end of it yet. When drawing support/resistance lines for a market they are more reliable if it connects at least 3 peaks or troughs. Looking at the chart below you can see that the market is approaching a crucial point around 5,500-5,600 where there is a fair bit of support (the horizontal red lines). There is a definite downward trend to the market now (represented by the sloping red line) which some would argue is confirmation that we are entering a long term bear market.
The point to take from the chart is that the FTSE 100 has support around the 5,550-5,600 area but if it breaches that then there is a lot of fresh air below and the market could tumble a long way towards 5,260 or even 5,000. That’s 5-10% below where the market is at the time of writing.
On the upside there is a lot of resistance on the way up to 6,000 which limits the upside potential in the short term. We really need the market to break back above 6,000 for the short term sell-off to be behind us.
US stock market
It’s a similar situation in the US. The resistance line of 1,865 for the S&P 500 was an important one. In the short term we’ve breached that which indicates that the market trend is still downwards.
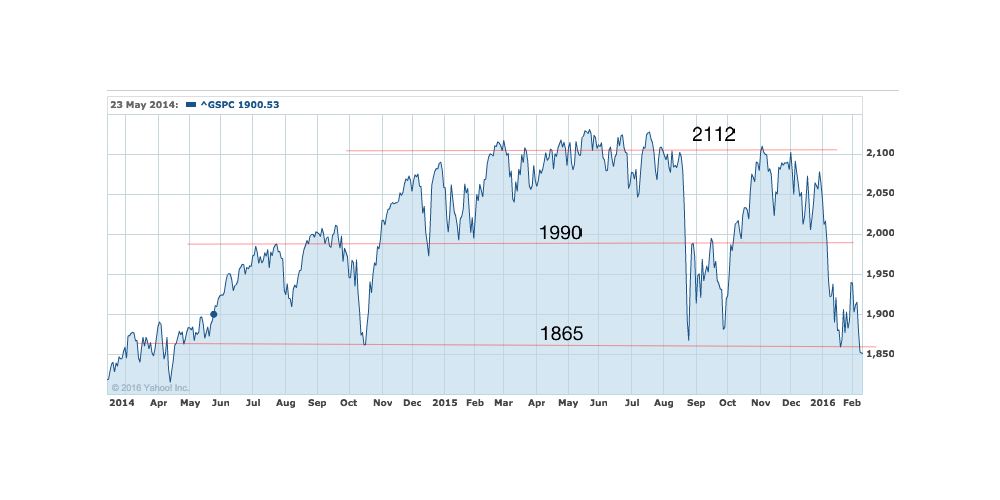
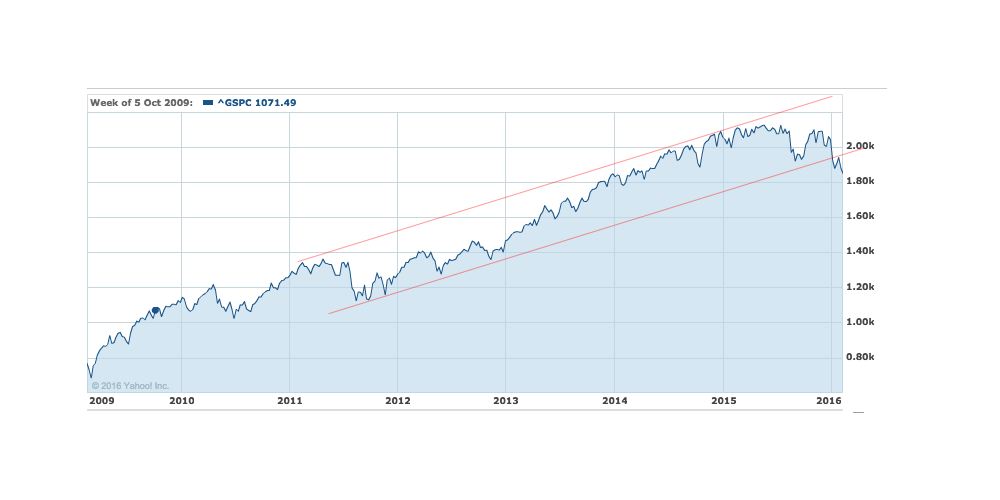
If we pan out to the longer term view the S&P 500 has broken the uptrend of the last 5 years which suggests that the market is in a definite downslide unless it can bounce back up to 1990. What could trigger that given the negative sentiment out there? A shock and awe approach from the US Federal Reserve (printing lots of money and cutting rates) could do it but then the markets might interpret that as pure panic. Overall things don't look great for US equities.
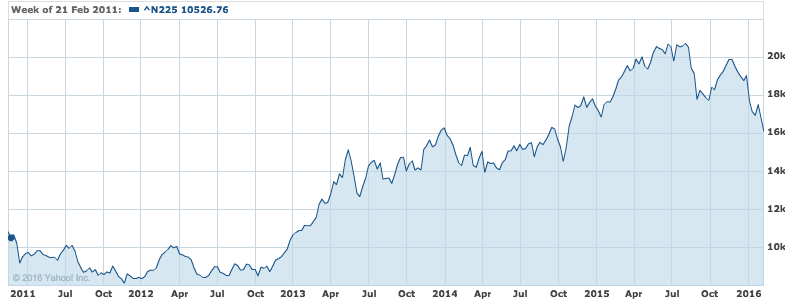
Japanese stock market
Last month the Bank of Japan set its benchmark interest rate negative which caused the stock market to bounce (as you can see on the right of the chart below).
Yet as can be seen even this was not enough to appease a market racked by panic over global growth. The Yen is seen as a haven asset and is bought en masse whenever investors become nervous. Due to the export focus of the Japanese economy a strong Yen is bad news for Japanese stocks. So the stock market and the Yen tend to move in opposite directions - what's good for the currency is bad for the stock market.
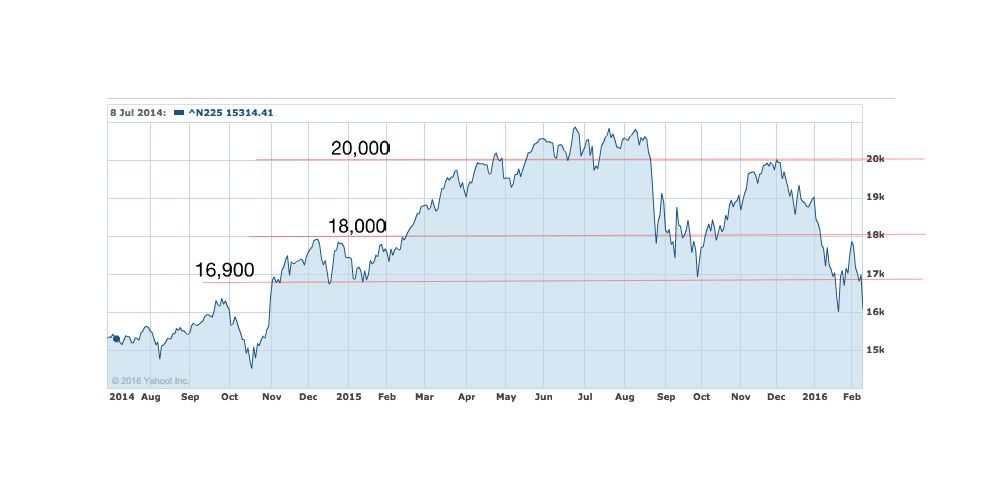
Short term the outlook is not great unless we get even more central bank intervention. If we zoom out there is a lot of support down towards 14,000, which is around 8% lower than we are now.
Summary
Stock markets are in panic mode and the short term outlook is pretty negative. The above analysis would suggest that the situation for stocks is likely to get worse before it gets better. Bonds and gold have been the obvious beneficiaries. We need a bottom to set in and if the macro situation doesn’t escalate we may be nearing it (or at least within 5% of that bottom). If the macro situation gets worse then things will get really ugly. Yet at the moment markets are following a 'two weeks bad news' followed by 'two weeks good news' pattern. It might suggest that markets are due a break. Only then will we have a chance of getting away from the 'sell the rallies' mentality (which is driving markets down) and back to a 'buy the dips' ethos.
We will only know with the benefit of hindsight where the bottom of the current sell-off is. Yet as a long term investor, while I of course don’t like tumbling markets, it will present opportunities. If you are looking to put money into the market then it makes sense to drip it in over a number of months to benefit from pound cost averaging if markets do fall further. Finally do have a read of my analysis - The best strategy in a stock market crash – Stick or Twist?

£200 Pension Cashback Offer
Make a qualifying deposit or transfer a pension to our partner Interactive Investor.
- Deposit or transfer a pension of at least £20k and you could earn £200 cashback
- Terms and Fees apply, Capital at risk
- New & Existing customers opening a SIPP
- Offer ends 31st July 2026
Before starting your transfer, check you won't lose any valuable benefits (such as guaranteed annuity rates or a lower protected pension age) and find out what exit fees you might have to pay
