


Remember that no one can predict the future. However, technical analysis can be used as a guide to the range of possible future outcomes. Once again I focus on the UK stock market, the US stock market and the Japanese stock market. Remember I'm not looking at what is going to happen in the next few days but the coming months.
What is technical analysis?
Here is my previous explanation of what technical analysis is:
Trying to predict the future of the stock market is akin to reading tea leaves. Personal predictions are almost always clouded by prejudices which reaffirm what we ‘want’ to happen rather than what is ‘most likely’ to happen.
That is why one objective method is to use technical analysis to try and judge likely outcomes. So what is technical analysis? One line of thinking is that stock markets are driven largely by human behaviour. At the simplest level you could argue that fear and greed drive a lot of investors’ actions. Let’s say that an opportunity presents itself and some investors jump on it and buy the shares in question. The demand then drives up the price. More investors jump on the bandwagon looking to profit. Then at some point the tide turns (fear sets in) as people think the price for the shares is looking expensive and so people start selling. More and more people start selling to take profits and the price falls. At some point the price falls until others think the shares look cheap and start buying, outnumbering the number of sellers. Again demand outstrips supply and the price goes back up.
This see-sawing explains the movement you see in stock market charts such as those below. The prices at which investors start bailing and selling the shares is called a point of resistance while the point at which they pile in is called a point of support.
As such there is a surprising level of predictability to human behaviour. In terms of the stock market that means when the price goes through historic points of resistance or support it can indicate an new unfolding market rally or collapse. Why does it do this? Part of it will be because traders trading in millions of pounds will use these points of resistance and support to trigger trades. Yet for a lot of investors they might not even be aware of these inflexion points. They simply are reacting to how other people in the market behave. Put it this way, when stock markets fall you feel tempted to sell, right? Also once it starts to rally, you are tempted to jump in? That’s why these patterns have a tendency to repeat.
Some investors and traders swear by it and trade solely using technical analysis. I don’t fall into that camp. I view technical analysis like a road map drawn by someone who has already completed a journey to somewhere near where you are planning to drive to. The road map won’t take you exactly to your intended destination, nor will it be entirely accurate. However, it will give you a better sense of what to expect. Then if you decide you like the look of particular market you can use 80-20 Investor’s ‘Best funds by Sector‘ data to choose an actual fund to invest in. So where are 3 key stock markets now heading?
There are different types of technical analysis, however, I find the most useful guide is to simply highlight the points of resistance and support.
FTSE 100 - where next?
At the time of writing stock markets globally are in the midst of a sell-off sparked once again by wobbles in the bond market as well as concerns about a possible Greek exit from the eurozone.
Yet the technical analysis for the FTSE 100 hasn't shifted a lot since the last time I did this analysis. In the chart below (click to enlarge all charts) I've drawn in a few lines of resistance (green line) and support (red line). Resistance lines can also act as support levels and vice versa. If we consider the current sell-off of the FTSE 100, 6,800 is a key level of support which we have just breached. The next key level of support is just below 6,700 and if we breach that then hang on to your hats as market sentiment in the short term will have turned seriously negative, meaning that further losses are on the cards. Subsequent levels of support exist at various stages (6,300 being one) down to 6,000 if a significant market correction occurred. What could spark such a sell-off? Well a Greek exit from the eurozone is one thing that could.
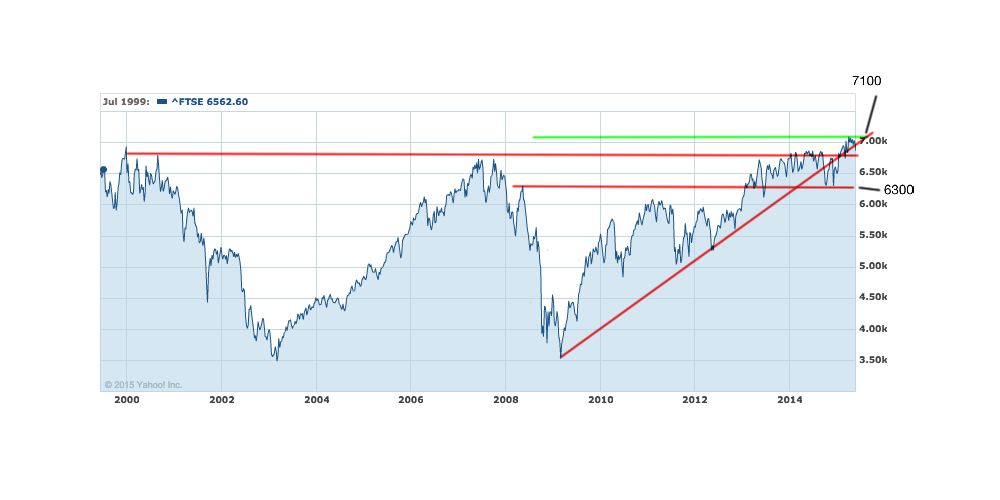
On the upside there once again is a line of resistance around 6,975 which the FTSE 100 has to break through to have another run over 7,000. But the diagonal line of support suggests that if the FTSE 100 is to make some serious long term gain then we need to break out above its all time high of 7,103 convincingly.
So what do all these lines mean? The FTSE 100 has been bouncing around for a while in a range between 6,800 and its all time high of 7,103. Over the medium term this trend looks likely to continue In the absence of something like a Greek exit or a 'black swan' event that shakes markets. If the market consistently closes below 6,700 then a sell-off in the short term is likely. On the upside a serious market rally will only occur if we can consistently close above 7,103.
That's not to say there's no money to be made from individual UK companies or stocks but as a whole the market is looking for a sense of direction.
The US stock market
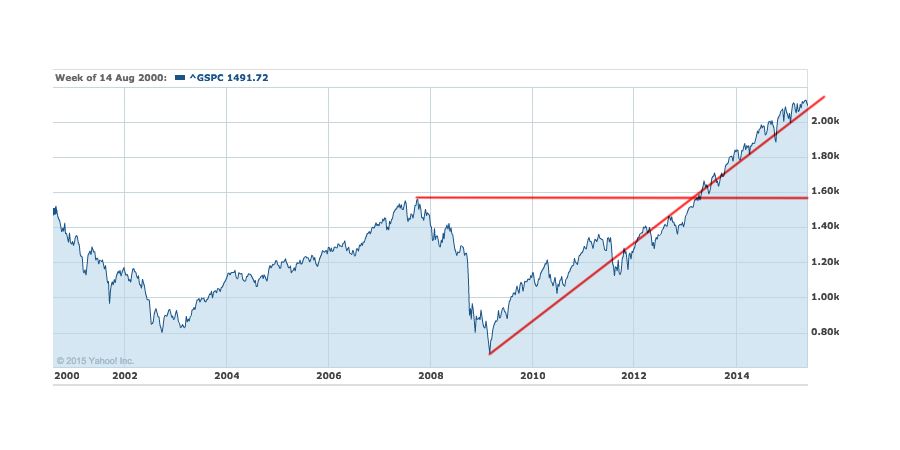
Below I have drawn the equivalent lines of support and resistance for the S&P 500. Since last time the S&P 500 has traded in a very narrow range, moving sideways, as a strong dollar started to hurt the stock market. Last time I said that if the rally is to continue then investors needed to start backing the belief that the US economic recovery has legs.
However since that time investor sentiment has turned neutral, from its previously bullish stance, and the market has limped along. Yet if you look at the chart below you can see that from a technical standpoint things remain positive and the market continues to bounce along the diagonal line of support. Yet this has become a 'reluctant rally' where it would appear that investors are buying into the stock market as the 'least bad option'. The problems will come when those already reluctant investors find that better option. The thing that has upset the market in the short term is the prospect of the US Federal Reserve (their central bank) possibly raising rates in September. This has caused markets to wobble and when rates do go up don't be surprised to see markets fall for a few weeks after.
Japan
The Japan stock market is a great example of where technical analysis can spot opportunities to make money. Back in February I pointed out there was the possibility of the Nikkei 225 hitting 20,000 which at the time was 10% above where the market stood. Well that's exactly what's happened. As can be seen from my recent post on the sectors with momentum those who invested would have made some serious profit. It's no surprise that the 80-20 Investor Best of the Best Selection as well as my own portfolio have significant exposure to Japanese equities.
You can see from the chart below how once the market broke through the green diagonal level of support that it soon hit 20,000. So where next? Currently on the downside there is strong support around the 18,000 mark in the event of a significant correction.
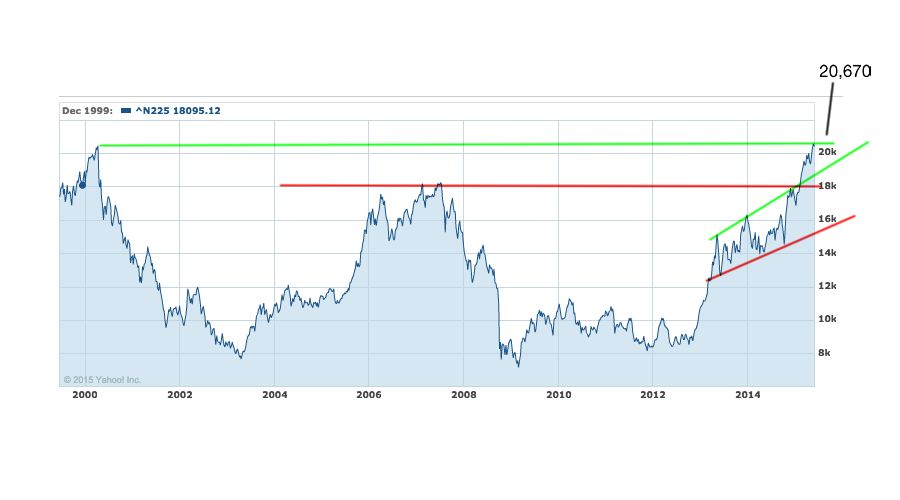
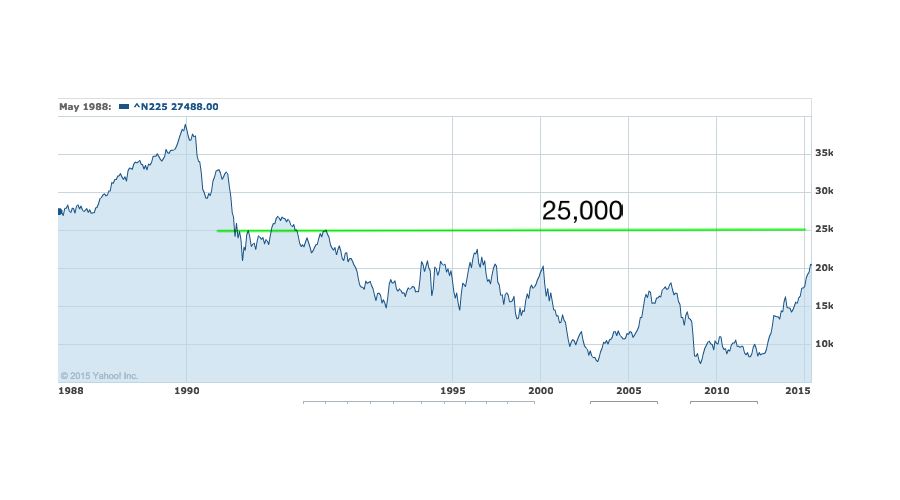
On the upside there is a resistance line near the previous high achieved in 2000 of around 20,670. We need to see the market convincingly break through this barrier and then there is no reason why we couldn't see the market rise, given time, towards 25,000 which is in-line with the market highs of the early 1990s.
Of the 3 markets I've analysed this one is perhaps the most exciting in terms of upside potential especially if it can avoid a sell-off below the line of support near 19,574. If it can and breaks above the 20,670 resistance level it will be a very positive sign for investors.
The material in any email, the MonetotheMasses.com website, associated pages / channels / accounts and any other correspondence are for general information only and do not constitute investment, tax, legal or other form of advice. You should not rely on this information to make (or refrain from making) any decisions. Always obtain independent, professional advice for your own particular situation. See full Terms & Conditions and Privacy Policy
Neither MoneytotheMasses.com/80-20 Investor nor its content providers are responsible for any damages or losses arising from any use of this information. Past performance is no guarantee of future results.
Funds invest in shares, bonds, and other financial instruments and are by their nature speculative and can be volatile. You should never invest more than you can safely afford to lose. The value of your investment can go down as well as up so you may get back less than you originally invested.
Information provided by MoneytotheMasses.com/80-20 Investor is for general information only and not intended to be relied upon by readers in making (or not making) specific investment decisions.
Appropriate independent advice should be obtained before making any such decisions. Leadenhall Learning (owner of MoneytotheMasses.com/80-20 Investor) and its staff do not accept liability for any loss suffered by readers as a result of any such decisions.
The tables and graphs are derived from data supplied by Trustnet. All rights Reserved.

£200 Pension Cashback Offer
Make a qualifying deposit or transfer a pension to our partner Interactive Investor.
- Deposit or transfer a pension of at least £20k and you could earn £200 cashback
- Terms and Fees apply, Capital at risk
- New & Existing customers opening a SIPP
- Offer ends 31st July 2026
Before starting your transfer, check you won't lose any valuable benefits (such as guaranteed annuity rates or a lower protected pension age) and find out what exit fees you might have to pay
