

The traditional portfolio asset allocation model is broadly one that invests in bonds and equities and the more equity exposure the portfolio has the greater the portfolio's investment risk. Traditionally the price moves of bonds and equities have had a negative correlation, that is when one rises in value the other tends to fall in value. As such they historically have provided a good level of diversification, so during periods of equity market weakness the bond portion of an investment portfolio has tended to rise as investors seek safety in fixed-income investments. Similarly when equity markets rally, bond markets tend to weaken. However, it is a relationship that is not set in stone and varies over time.
During short periods of time, both assets can rise and fall in tandem, i.e. their correlation becomes positive. The start of 2022 has been a perfect example of this. The chart below shows the performance of bond/equity portfolios with varying equity exposures from the start of 2022 up until 21st April. I've used the popular Vanguard Lifestrategy funds to represent the different bond/equity portfolios. I have also included my own £50k portfolio (the green line) as a comparison.
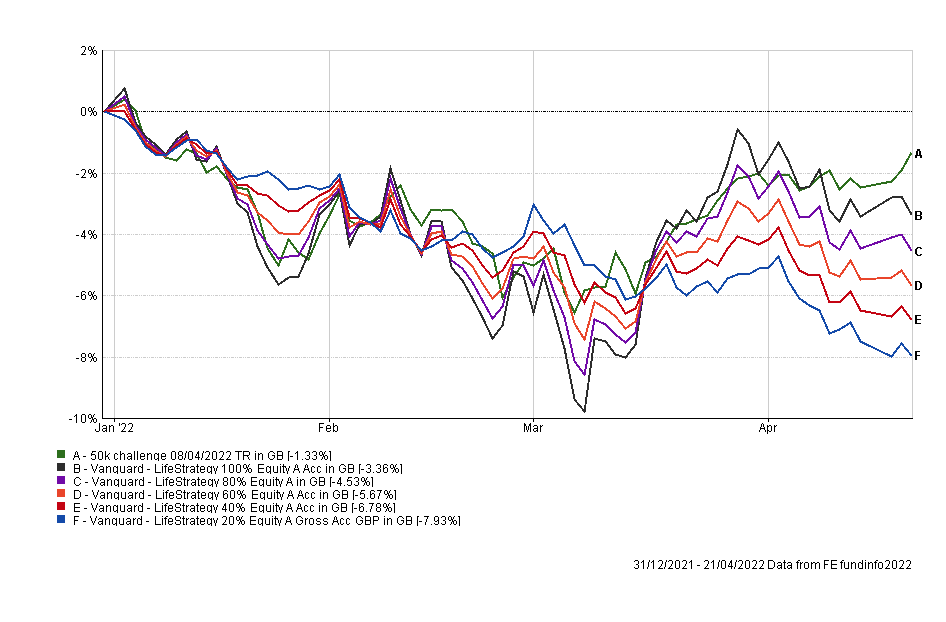
You can see that into the March low the equity bond portfolios tumbled, with those portfolios most exposed to equities performing the worst. By that point all of the portfolios had tumbled in value by between 5% and 10% because their bond holdings were also falling in value thanks to inflation fears and the prospect of central bank monetary tightening. Even during the subsequent equity market rebound in late March/early April bonds continued to fall, dragging on portfolio returns. The chart suggests that the popular 60/40 bond/equity portfolio is down around 5.6% so far in 2022. So does that mean that the 60/40 portfolio is dead or is this just a short-term blip in the correlation between bonds and equities which will soon revert to the historical norm of being negative?
Interestingly the chart below produced by Schroders shows how the correlation between the price moves of bonds and equities does in fact change for extended periods of time and that the persistently negative correlation has only been a phenomenon since the start of the century.
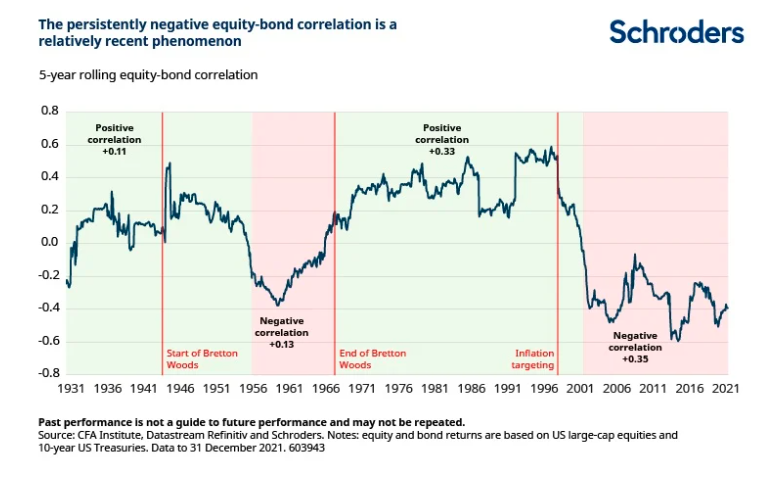
Schroders' research also concluded that when investors are worried about slowing growth and high inflation (i.e. stagflation), as they were in the 1970s, they may end up disliking both equities and bonds (instead favouring cash) which causes the equity/bond correlation to turn positive. Furthermore, if central banks start raising rates at the same time as growth is slowing then history shows this coincides with a positive correlation between bond and equity prices. This is the environment we find ourselves in 2022, a period of high and volatile inflation alongside rising interest rates.
Of course, we don't know whether we are about to see a long-term regime change (like we saw between the late 1960s and late 1990s when bonds and equities were positively correlated) but the evidence at least suggests that we should be mindful of the possibility. Especially given that Schroders also found that when inflation exceeds 3% a year on a five-year basis the equity-bond correlation has been positive 98% of the time going back as far as 1926.
The alternative to bonds and equities
So if a simple bond and equity portfolio doesn't work, then how should you best diversify a portfolio for the current environment? One possible answer is to look at the correlations between asset classes so far in 2022. Unfortunately the relatively short timeframe makes correlation calculations somewhat unreliable. So one alternative method is to look at what has been working in terms of portfolio construction.
I previously carried out a piece of research titled "The best all-weather portfolios analysed" where I looked at a number of well-known buy and hold portfolios that are designed to weather investing storms over the long term. These portfolios were:
I also analysed my own Perfect ISA Portfolio as well as a Perfect Gold Portfolio which replaces the cash element of the original 80-20 Investor Perfect Portfolio with gold.
By analysing these portfolios it is possible to see which has outperformed and therefore which asset classes to consider when building a portfolio for a positively correlated equity/bond environment.
At this point, it is worth reminding you of the asset allocation of each of the above portfolios, but bear in mind the first four portfolios listed were designed for American investors so I had to anglicise them.
Harry Browne Permanent Portfolio
- 25% ETFS Physical Gold
- 25% Cash
- 25% UK Equities
- 25% UK Gilts
Ivy League Portfolio
- 30% UK Equities
- 15% Global Equities
- 5% Emerging Market Equities
- 20% Property Equities
- 15% Gilts
- 15% Index-Linked Gilts
Gone Fishin' Portfolio
- 5% Ruffer Gold
- 10% Asia ex-Japan Equities
- 10% Europe ex-UK Equities
- 10% Global Bonds
- 10% Global Emerging Market Equities
- 15% North American Equities
- 15% North American Smaller Companies
- 5% Property Equities
- 10% Sterling High Yield
- 10% UK Gilts
Ray Dalio All Weather
- 7.5% ETFS Gold Physical
- 7.5% Commodities and Energy ETFs
- 15% Sterling Corporate Bond
- 30% UK Equities
- 40% UK Gilts
80-20 Investor Perfect Portfolio
- 9% Cash
- 20% UK Equity Income
- 71% UK Gilts
80-20 Investor Perfect Gold Portfolio
- 9% ETFS Physical Gold
- 20% UK Equity Income
- 71% UK Gilts
The chart below shows the performance of all portfolios so far in 2022, during the period of positive bond/equity correlation.
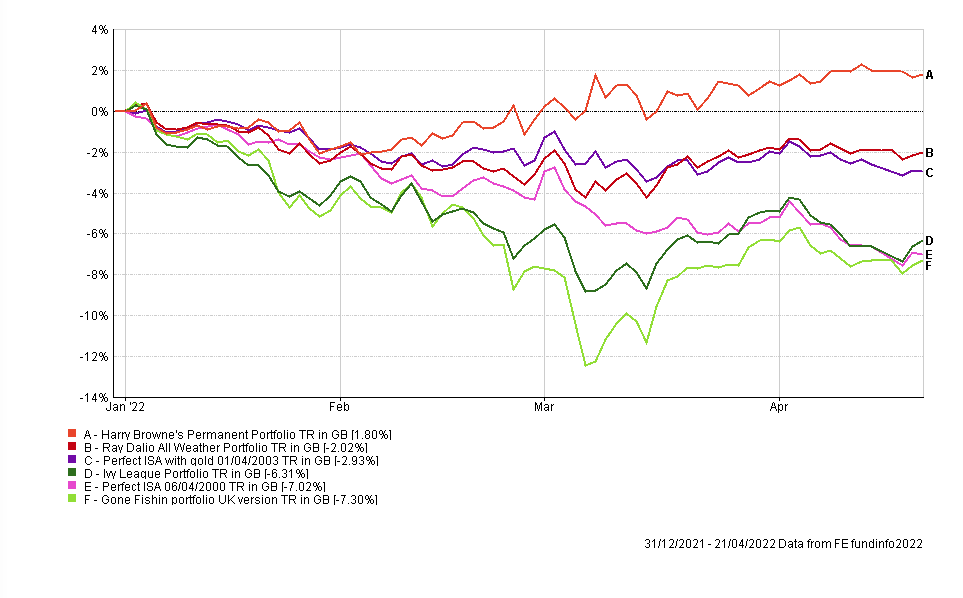
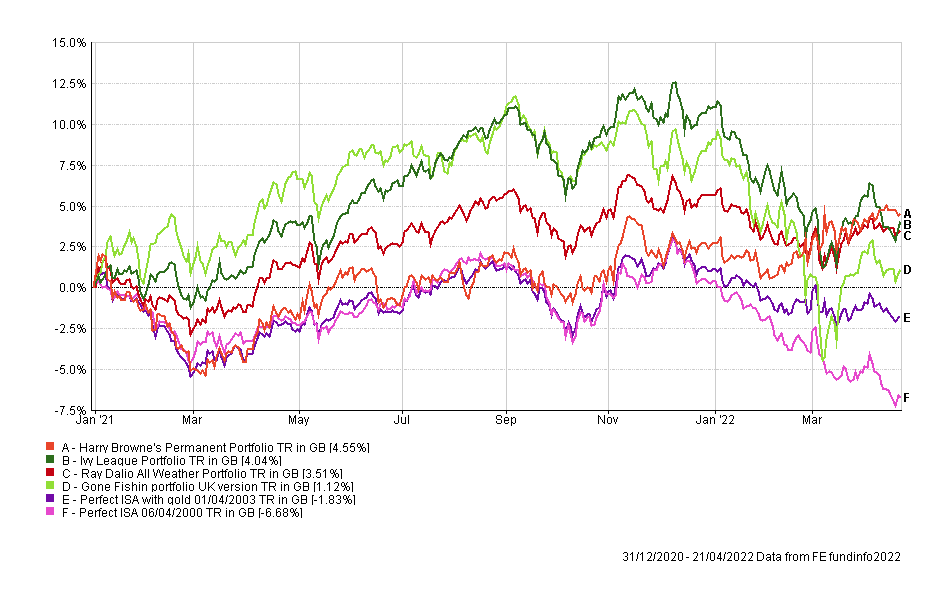
Out of interest, if we extend the timeframe to cover the entire pandemic you can see that the Harry Permanent Browne Portfolio is still the top performer.
So looking at the asset mix of the three best performing portfolios in 2022 they are:
Harry Browne Permanent Portfolio
- 25% ETFS Physical Gold
- 25% Cash
- 25% UK Equities
- 25% UK Gilts
Ray Dalio All Weather
- 7.5% ETFS Gold Physical
- 7.5% Commodities and Energy ETFs
- 15% Sterling Corporate Bond
- 30% UK Equities
- 40% UK Gilts
80-20 Investor Perfect Gold Portfolio
- 9% ETFS Physical Gold
- 20% UK Equity Income
- 71% UK Gilts
What sets these portfolios apart is their significant exposures to gold (and some commodity exposure in the case of the Ray Dalio portfolio) as well as their relatively low equity exposure. In addition, they have exposure solely to UK equities (partly by my anglicising of the original US versions), while Harry Browne's portfolio also has significant exposure to cash.
Interestingly the first section of this article provided some clues as to the likelihood of these findings. Firstly, Schroders found that investors may favour cash during a period of positive equity/bond correlation while my own £50k portfolio has significantly outperformed the straight bond/equity portfolios so far in 2022. As you no doubt know my portfolio has exposure to gold and commodities while having limited exposure to bonds, instead favouring targetted absolute return funds.
So the evidence suggests that it is possible to still diversify a portfolio during a period of positive bond/equity correlation but cash, commodities and gold will all need to play a more prominent part than they perhaps have done over the last decade. Not only that but the funds that you invest in within each asset class also matter. Have a read of my article "Investing for inflation – Equity funds".

£200 Pension Cashback Offer
Make a qualifying deposit or transfer a pension to our partner Interactive Investor.
- Deposit or transfer a pension of at least £20k and you could earn £200 cashback
- Terms and Fees apply, Capital at risk
- New & Existing customers opening a SIPP
- Offer ends 31st July 2026
Before starting your transfer, check you won't lose any valuable benefits (such as guaranteed annuity rates or a lower protected pension age) and find out what exit fees you might have to pay
