

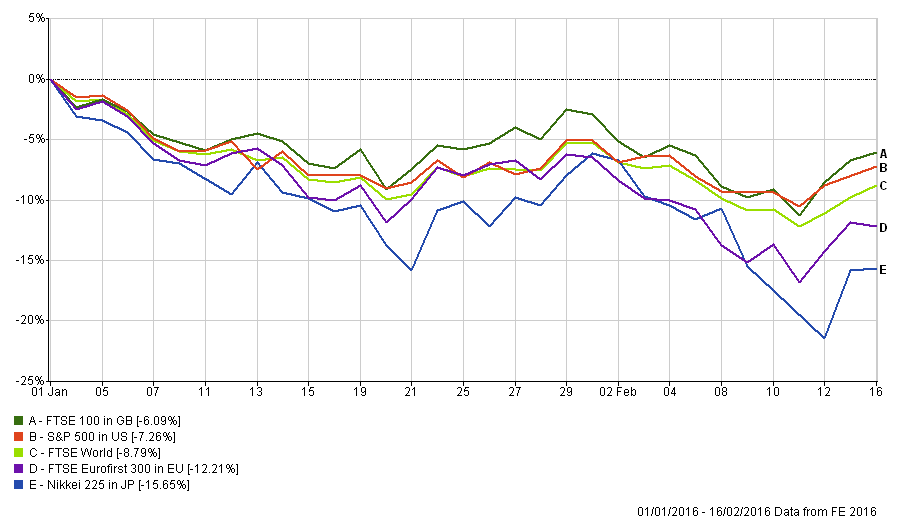
The start of 2016 has been a dismal one for investors. The chart below shows how the major developed world indices have performed year to date. At their worst they were down between 10% and 20% (click to enlarge).
Bank stocks and bonds tumble over crisis fears
While the sell-off was broad the latest down-leg was sparked by concerns over the banking sector (particularly in Europe) and the real possibility of another financial crisis. As I pointed out in my last weekly newsletter the catalyst for the sell-off was the central bank of Sweden moving its main interest rate on reserve deposits deeper into negative territory. Or in other words it would now cost banks money to place deposits with the Swedish central bank. Such a phenomena has many economists in a twist because their guide books don't allow for this eventuality. Yet this is nothing new. Central banks in Japan, the EU, Denmark and Switzerland have done the same in recent history.
What suddenly spooked the markets was the size and surprise of the Swedish move which opened investors' eyes to a world where negative interest rates could become the norm. The trouble is that in a world of low interest rates banks struggle to make money. In a world of negative rates it would be nigh on impossible for them. Suddenly investors became concerned about the viability of a number of major banks across the world (especially Deutsche Bank) and whether they could continue to service their debts. Talk of bailouts resurfaced and a flight from bank stocks and bonds occurred on a scale not seen since the financial crisis of 2008. Any one left holding them saw their value plummet as banking shares tumbled by as much as 10% in a day.
The table below gives an analysis of how each sector grouping within the FTSE has performed over different time periods. Focus on the year to date column (YTD) and you will see that banks are the worst performing sector bar none despite the strong rally in recent days. The message is clear.
Performance of shares by sector
| Sector | Today % | 5 Day % | 30 days % | YTD % | 1 Year % |
| Aerospace & Defense | 3.87 | 7.9 | 6.72 | 3.33 | -16.05 |
| Automobiles & Parts | 3.52 | 8.38 | -1.67 | -10.25 | -26.28 |
| Banks | 2.85 | 5.23 | -5.12 | -16.52 | -27.58 |
| Beverages | 0.67 | 2.66 | 2.06 | 0.09 | 5.32 |
| Chemicals | 3.49 | 6.81 | 1.04 | -8.1 | -14.99 |
| Construction & Materials | 3.16 | 5.85 | 1.34 | -9.39 | -1.98 |
| Electricity | 1.03 | 2.09 | -1.92 | -9.75 | -14.89 |
| Electronic & Electrical Equipment | 3.83 | 10.26 | 7.51 | -4.43 | -0.58 |
| Equity Investment Instruments | 1.9 | 2.77 | -0.86 | -7.4 | -7.2 |
| Financial Services | 3.3 | 5.07 | 0.54 | -12.38 | -9.94 |
| Fixed Line Telecommunications | 1.31 | 3.37 | 0.95 | -2.61 | 3.3 |
| Food & Drug Retailers | 3.23 | 5.74 | 12.9 | 12.49 | -15.12 |
| Food Producers | 2.63 | 5.47 | 5.1 | -2.9 | 10.71 |
| Forestry & Paper | 3.55 | 7.45 | 9.61 | -1.65 | 5.3 |
| Gas; Water & Multiutilities | -0.12 | 1.56 | 0.61 | -1.9 | -3.04 |
| General Industrials | 2.32 | 5.26 | 3.46 | -1.56 | 1.19 |
| General Retailers | 2.73 | 4.5 | 3.59 | -3.92 | -4.53 |
| Health Care Equipment & Services | 2.59 | 5.77 | 3.97 | -3.98 | 3.43 |
| Household Goods & Home Construction | 2.11 | 7.3 | 5.37 | -1.45 | 18.5 |
| Industrial Engineering | 2.93 | 7.22 | 6.95 | -4.37 | -27.51 |
| Industrial Metals | 0 | 0.94 | 18.79 | -5.05 | -63.64 |
| Industrial Transportation | 2.44 | 5.42 | 4.64 | -2.85 | -9.54 |
| Life Insurance | 5.09 | 7.72 | -3.39 | -14.23 | -18.22 |
| Media | 2.26 | 5.4 | 2.83 | -4.44 | 0.3 |
| Mining | 7.29 | 8.32 | 32.43 | 10.51 | -45.84 |
| Mobile Telecommunications | 3.03 | 5.81 | 1.42 | -2.46 | -4.91 |
| Nonlife Insurance | 2.22 | 3.78 | 1.75 | -3.83 | 14.85 |
| Oil & Gas Producers | 3.95 | 6.28 | 15.31 | 5.2 | -19.96 |
| Oil Equipment; Services & Distribution | 7.02 | 7.23 | 4.79 | -4.11 | -29.99 |
| Personal Goods | 1.59 | 4.1 | 7.53 | 3.67 | 0.8 |
| Pharmaceuticals & Biotechnology | 1.64 | 5.11 | 0.81 | -4.94 | -10.85 |
| Real Estate Investment & Services | 2.49 | 2.51 | -4.81 | -14.27 | -8.75 |
| Real Estate Investment Trusts | 2.33 | 4.46 | -1.38 | -9.41 | -10.92 |
| Software & Computer Services | 3.11 | 5.21 | 2.07 | -5.69 | 18.64 |
| Support Services | 3 | 5.52 | 2.35 | -6.71 | -6.59 |
| Technology Hardware & Equipment | 3.56 | 4.96 | -1.61 | -10.11 | -9.3 |
| Tobacco | 0.88 | 4.66 | 6.37 | 3.18 | 10.62 |
| Travel & Leisure | 2.91 | 5.71 | 0.45 | -7.48 | 0.26 |
It's unlikely to be over
There has been much debate over whether the banking sector fears have been overdone or whether there is a real problem bubbling up. In recent days there has been some respite for banking shares with a strong rally for the sector. In fact the market has rallied strongly in most sectors. As I highlighted in my article Technical analysis – when will the market sell-off stop? we need a continued rally to break the overriding downward trend.
What will determine the outllook for banking stocks and bonds is what central banks do next. Bank stocks perform best in a rising interest rate environment. Clearly the sudden prospect of negative interest rates being used more widely by central banks has spooked the market. Unless we see a 'shock and awe' approach from central banks, perhaps with direct purchases of assets such as shares and bonds, then the market could once again lose faith in central banks' ability to do anything to stop a full blown financial crisis or recession. So if you want to reduce your portfolio's exposure to a potential banking crisis what funds should you avoid holding?
The funds most exposed to a banking crisis
For DIY investors it's difficult to avoid overexposing themselves to a banking crisis. Ideally you need to avoid funds that have significant exposure to bank stock or bonds. Yet that is easier said than done unless you analyse the holdings of every one of the thousands of funds out there. So that's exactly what I've done for 80-20 Investor members.
The table below lists those funds with over 10% exposure to banking stocks or bonds. I have also grouped them by sector to make it easier to check whether you hold any of them. In addition, you will find the quartile ranking for each fund since the start of the year to the recent market bottom. A quartile ranking of 3 or 4 means that the fund has underperformed the average of its peers. A poor performance combined with a high bank exposure would suggest exposure to some of the more maligned banks.
| Fund | Sector | % Bank exposure | Performance to market bottom | Quartile ranking |
| Majedie - Global Focus | Global | 11.55 | -12.21 | 4 |
| Majedie - Global Equity | Global | 10.87 | -12.25 | 4 |
| Threadneedle - European High Yield Bond | Global Bonds | 10.4 | 4.2 | 2 |
| Schroder - QEP Global Emerging Markets | Global Emerging Markets | 11.79 | -4.27 | 1 |
| Jupiter - Global Emerging Markets | Global Emerging Markets | 10.77 | -11.41 | 4 |
| Man GLG - Japan Core Alpha | Japan | 19.98 | -17.82 | 4 |
| CF - Morant Wright Japan | Japan | 10.04 | -12.25 | 3 |
| Invesco Perpetual - Global Distribution | Mixed Investment 20%-60% Shares | 21.4 | -7.51 | 4 |
| Invesco Perpetual - Distribution | Mixed Investment 20%-60% Shares | 20.85 | -6.11 | 4 |
| Invesco Perpetual - European High Income | Mixed Investment 20%-60% Shares | 10.14 | -6.01 | 4 |
| CF - Miton US Opportunities | North America | 10.03 | -7.95 | 1 |
| Invesco Perpetual - Global Financial Capital | Specialist | 59.9 | -12.4 | 4 |
| AXA - Framlington Financial | Specialist | 52.47 | -18.15 | 4 |
| Henderson - Global Financials | Specialist | 50.2 | -16.11 | 4 |
| JPM - Global Financials | Specialist | 44.6 | -19.43 | 4 |
| Jupiter - International Financials | Specialist | 32.3 | -16.08 | 4 |
| Jupiter - Financial Opportunities | Specialist | 23.7 | -13.29 | 4 |
| Rathbone - Ethical Bond | Sterling Corporate Bond | 27.99 | -1.36 | 4 |
| Invesco Perpetual - Corporate Bond | Sterling Corporate Bond | 23.94 | -1.73 | 4 |
| F&C - Responsible Sterling Bond | Sterling Corporate Bond | 19.9 | 1.29 | 1 |
| Legg Mason - IF Western Asset Retirement Income Bond | Sterling Corporate Bond | 18.91 | 0.05 | 2 |
| F&C - Corporate Bond | Sterling Corporate Bond | 18.3 | -0.04 | 2 |
| Schroder - All Maturities Corporate Bond | Sterling Corporate Bond | 17.69 | 1.08 | 1 |
| Kames - Investment Grade Bond | Sterling Corporate Bond | 17.17 | -0.19 | 3 |
| Kames - Sterling Corporate Bond | Sterling Corporate Bond | 16.02 | -0.19 | 3 |
| M&G - Strategic Corporate Bond | Sterling Corporate Bond | 15.1 | -0.6 | 3 |
| UBS - Sterling Corporate Bond Indexed | Sterling Corporate Bond | 14.1 | 1.38 | 1 |
| Kames - Ethical Corporate Bond | Sterling Corporate Bond | 12.45 | 0.87 | 1 |
| Invesco Perpetual - High Yield | Sterling High Yield | 32.26 | -5.91 | 4 |
| Fidelity - Global High Yield | Sterling High Yield | 10.31 | -3.27 | 1 |
| Invesco Perpetual - Tactical Bond | Sterling Strategic Bond | 26.86 | -0.98 | 2 |
| Invesco Perpetual - Monthly Income Plus | Sterling Strategic Bond | 25.56 | -4.91 | 4 |
| PFS - TwentyFour Dynamic Bond | Sterling Strategic Bond | 24.25 | -5.21 | 4 |
| PFS - Focus Bond | Sterling Strategic Bond | 18.73 | -2.9 | 4 |
| F&C - Strategic Bond | Sterling Strategic Bond | 17.31 | -2.99 | 4 |
| Kames - Strategic Bond | Sterling Strategic Bond | 16.14 | -3.65 | 4 |
| Fidelity - Extra Income | Sterling Strategic Bond | 15.28 | -1.55 | 2 |
| F&C - Extra Income Bond | Sterling Strategic Bond | 15.2 | -2 | 3 |
| Artemis - High Income | Sterling Strategic Bond | 12.76 | -5.46 | 4 |
| M&G - Optimal Income | Sterling Strategic Bond | 12.37 | -3.06 | 4 |
| Majedie - UK Focus | UK All Companies | 22.76 | -14.06 | 4 |
| Majedie - UK Equity | UK All Companies | 18.25 | -10.8 | 2 |
| Man GLG - Undervalued Assets | UK All Companies | 10.85 | -11.44 | 2 |
| Virgin - UK Index Tracking | UK All Companies | 10.69 | -10.88 | 2 |
| Majedie - UK Income | UK Equity Income | 12.47 | -14.56 | 4 |
The material in any email, the MonetotheMasses.com website, associated pages / channels / accounts and any other correspondence are for general information only and do not constitute investment, tax, legal or other form of advice. You should not rely on this information to make (or refrain from making) any decisions. Always obtain independent, professional advice for your own particular situation. See full Terms & Conditions and Privacy Policy
Neither MoneytotheMasses.com/80-20 Investor nor its content providers are responsible for any damages or losses arising from any use of this information. Past performance is no guarantee of future results.
Funds invest in shares, bonds, and other financial instruments and are by their nature speculative and can be volatile. You should never invest more than you can safely afford to lose. The value of your investment can go down as well as up so you may get back less than you originally invested.
Information provided by MoneytotheMasses.com/80-20 Investor is for general information only and not intended to be relied upon by readers in making (or not making) specific investment decisions.
Appropriate independent advice should be obtained before making any such decisions. Leadenhall Learning (owner of MoneytotheMasses.com/80-20 Investor) and its staff do not accept liability for any loss suffered by readers as a result of any such decisions.
The tables and graphs are derived from data supplied by Trustnet. All rights Reserved.

£200 Pension Cashback Offer
Make a qualifying deposit or transfer a pension to our partner Interactive Investor.
- Deposit or transfer a pension of at least £20k and you could earn £200 cashback
- Terms and Fees apply, Capital at risk
- New & Existing customers opening a SIPP
- Offer ends 31st July 2026
Before starting your transfer, check you won't lose any valuable benefits (such as guaranteed annuity rates or a lower protected pension age) and find out what exit fees you might have to pay
