

This time last year I wrote my 2019 investment outlook which, with the benefit of hindsight, makes for an interesting read. It is worth revisiting to see how accurate the outlook turned out to be. One highlight was my prediction that bricks and mortar UK property unit trusts could potentially close their doors, which ultimately happened two weeks ago.
Investment markets finished 2018 off the back of a brutal autumn sell-off and one of the worst Decembers on record for stock markets. Cash was proving a key part of a diversified portfolio and there were concerns that stock markets may enter a long term bear market. With the benefit of hindsight we now know that this was a catalyst for the US Federal Reserve to do a 180-degree turn on monetary policy and become more accommodative. Ultimately, as the year progressed it cut interest rates and launched another round of Quantitative Easing, even if it refuses to officially call it Quantitative Easing. The Fed's dovish u-turn was one of the key themes in 2019 which ultimately led it to be a positive one for stock markets generally.
This time last year investment banks were incredibly bullish with their 2019 market predictions, which were made at the start of December 2018 prior to the December slump in stocks. At the time that the banks made their predictions the S&P 500 was sitting at 2760 and the average prediction of where the S&P 500 would end 2020 was approximately 3060. A rise of almost 11%.
Interestingly some investment banks rushed to amend their 2019 end of year predictions after their initial publication. Credit Suisse, the most bullish institution at the time with a prediction of 3350, cut its prediction to 2925 on the 18th December 2018 (after the S&P 500 had fallen to 2545). Given that (at the time of writing) the S&P 500 currently sits at just below 3200, Credit Suisse should have stuck with its original prediction. With an average investment bank S&P 500 prediction for 2019 being 3060, perhaps investment banks weren't bullish enough.
The table below shows each investment bank's prediction of where the S&P 500 will end 2020. Bear in mind that when most of the predictions were made (at the start of December 2019) the S&P 500 sat around 3100. Unlike last year when the banks almost unanimously predicted the market would rise (Morgan Stanley was the exception and predicted no growth). This year there are in fact two banks that predict the market will fall in 2020. Unsurprisingly one is Morgan Stanley and the other is UBS. Overall the predictions are slightly less optimistic than this time last year, with the average prediction being 3300, meaning that they expect a 6.5% rise in the S&P 500 next year. However, at the time of writing the market is already within touching distance of that level. In stark contrast to last year when the most bullish investment bank cut its prediction for the following year, in light of market moves in December 2018, this year we have the opposite scenario. BTIG which gave the most bullish prediction for 2020 has since stated that 3950 is now possible by the end of 2020 if we get a full-blown trade war truce between China and the US. That's an eye-watering 23.5% rally in 2020 from current levels?!
The investment banks from last year that ended up being the closest with their end of 2019 predictions were UBS and Deutsche Bank. This time around they are among the most cautious about what 2020 may bring. Make of that what you will.
| Institution | Prediction of where S&P 500 ends 2020 |
| Morgan Stanley | 3000 |
| UBS | 3000 |
| Deutsche Bank | 3250 |
| Bank of America | 3300 |
| Barclays | 3300 |
| RBC | 3350 |
| Goldman Sachs | 3400 |
| JP Morgan | 3400 |
| BMO | 3400 |
| Credit Suisse | 3425 |
| BTIG | 3450 |
However, with investment banks being notoriously poor at predicting the future (although they didn't do too badly last year) what is probably more useful is to ponder what the key investment themes of 2020 may be.
Investment themes for 2020?
Recession/yield curve
Recession fears were a key macro theme during parts of 2019, particularly during the summer. In my 2019 outlook I raised concerns over the flattening of bond yield curves globally. Then in April the US Federal Reserve (the Fed) voiced its own concerns that the yield curve for Treasury securities was growing flat, noting that historical evidence suggested that an inverted yield curve could portend economic weakness. By June the US Treasury yield curve did invert fuelling concerns that a recession was on the horizon. Yet it wasn't just a US issue, yield curve inversions were everywhere as a result of a steady stream of worrying economic data. In Germany, Bund yields turned negative for every duration out to 17 years. In other words, you had to pay the German government to lend it money for 17 years. Some companies were even issuing bonds with a negative yield. US 10 year Treasury yields and UK gilt yields tumbled to multi-year lows.
However, by the autumn news of a potential phase 1 trade deal being agreed between China and the US saw yield curves steepen (a good sign) once again. Given that the trade war was one of the biggest contributors to recessionary fears, markets became more bullish on global economic growth prospects. We saw this in bond market pricing but it was much more marked in equity markets where we experienced an aggressive equity rally into the festive season,
However, as research by Credit Suisse highlighted, while a US yield curve inversion is usually a reliable indicator (some would call it sure-fire) of an impending recession the lead time can vary dramatically. On average this lead time until a recession is 22 months. More interestingly stocks rally on average a further 15% over the next 18 months, following a yield curve inversion, before the recession hits. The latter rally has already occurred. If history is to be proved correct about the timing of a potential recession that puts it firmly in 2020. So while the market seems to have dismissed the possibility of a recession almost entirely, history suggests that they shouldn't be too hasty and if the stock market catches up with the reality of a recession it normally crashes.
Trade war
At the time of writing phase 1 of a US-China trade deal has apparently been agreed. However, full details of the deal have not yet been released by either side, neither have the time and date of an official signing ceremony. For now the market is happy to believe the headlines surrounding a potential trade deal. But as the diagram below, which I included in a recent 80-20 Investor newsletter, shows we've been here before. The chart is a perfect summary of the US-China trade war 'cycle' which we currently seem unable to break free from.
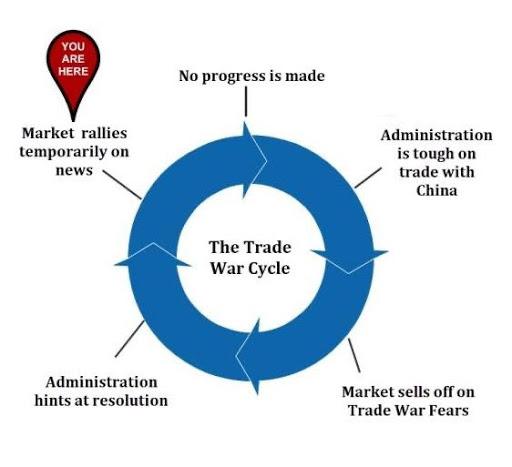
The above chart could also be annotated with defensive sectors outperform in the bottom right hand corner. While in the top left (where we are now) cyclical sectors outperform. But it is not just China with which Trump is locking horns. Europe and Latin America have come under trade war fire. The problem from an economic and investment perspective is that Trump's trade offensive is already having implications on the US economy. Bloomberg recently reported that economists calculated U.S. and China's tit-for-tat trade tariffs reduced US GDP by between 0.3% to 0.7% in 2019. More worryingly they believe that even with a phase-one trade deal the economic drag caused by the tariffs will last a number of years. Trump ultimately needs to resolve a trade dispute of his own making not just from an economic perspective but also a political one. In November 2020 Trump will seek re-election as the President of the United States. Prior to the phase 1 deal agreement, Trump had already threatened to wait until after the 2020 election if he had to in order to secure a trade deal with China. Days later he changed his tune and a phase 1 trade deal was apparently completed. Trump will want to go into the 2020 election lauding the strength of the US economy and his own brand of Make America Great Again. A trade deal of sorts would certainly help his cause. But it could also be argued that China might decide to play a waiting game if it looks like Trump could lose the 2020 election, in the hope that a more moderate President would take office and diffuse trade tensions. If that's the case we are likely to continue to go around and around the cycle pictured above. However, if we were to see a more substantial wide-reaching trade deal then Bank of America believe that the end of year predictions listed earlier would fall well short of reality.
US election
As 2020 progresses attention will start to turn towards the US election in November. Although Trump has been impeached he is anticipated to remain in office until then and stand for re-election. If history is a guide then it could be positive for US stock markets and ultimately global stock markets. According to the Stock Trader’s Almanac, since 1952 the Dow Jones has risen on average by 10.1% in a year where the sitting President ran for re-election. However where there is an open field the Dow Jones has fallen by 1.6% that year. Ultimately stock markets like certainty.
Monetary policy/US dollar
As the decade comes to a close and we reflect on the investment lessons learnt, there are two stand-outs
- Don't fight the Fed
- Buy the Dip (BTD)
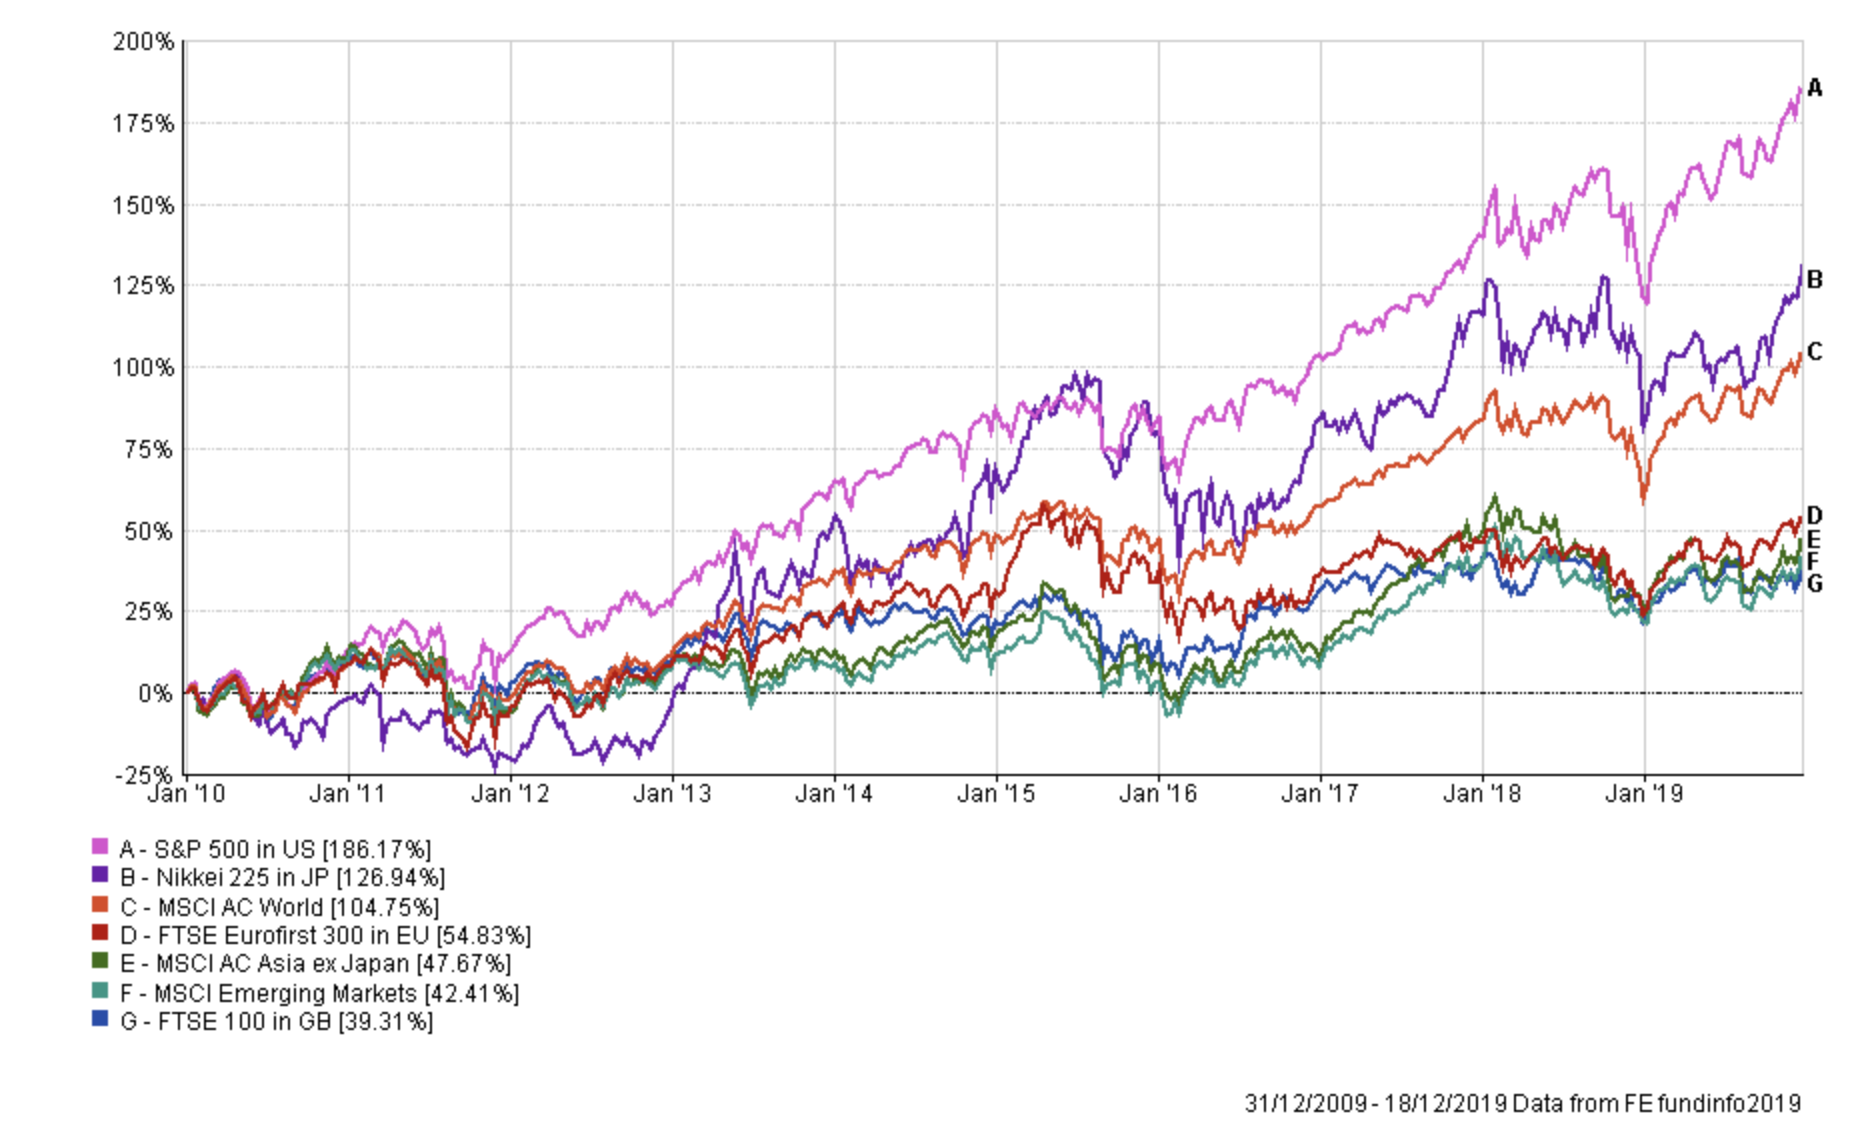
Accommodative monetary policy in the form of low interest rates and quantitative easing (QE) helped to inflate asset prices around the world, especially in bonds and equities. The chart below shows the price moves of key stock markets over the last decade.
One of the key protagonists was, of course, the US Federal Reserve. If you recall at the end of 2018 stock markets crashed as the Fed began to tighten monetary policy. Once the Fed made a 180-degree u-turn and became accommodative again it lit a rocket under stock markets in 2019. Throw in 'not QE4' and markets are still riding a wave of liquidity to new all-time highs. The question then becomes will the Fed continue on this path in 2020? We only have to go back 12 months to know what will happen if it suddenly becomes hawkish in response to an improving economic backdrop. At its rate-setting meeting last week the Fed gave no indication that it had plans to raise rates in 2020 but things can change fast. Ultimately the Fed has helped keep the equity bull market alive and every decision or press conference it makes in 2020 will be scrutinised, perhaps no more so than by Donald Trump.
The US president has regularly taken to Twitter to berate the Fed and its Chair, Jerome Powell, for not weakening the dollar by cutting interest rates or embarking on more QE. In fact, he did it again last week. Back in November, I wrote about why you should keep an eye on the US dollar as it was showing signs of weakness around key technical levels. As it turns out the dollar has indeed continued to weaken. If we do see a sustained weakening in the US dollar in 2020, in stark contrast to the strength experienced since mid-2018, it would impact a range of assets. A weak dollar is positive for emerging-market assets. It is also very positive for commodities as they are generally priced in US dollars. That means commodities such as gold, copper and oil could rally. If the latter does then this would be good for energy stocks.
A weaker dollar (and therefore a stronger pound vs the dollar) could be bad news for the FTSE 100 given the scale of company earnings that are in dollars. It's a similar story for the yen and the Japanese stock market. But there is another potential impact of a sustained weakening in the dollar and that is inflation.
Inflation
2020 could well be the year where we start talking about the inflation trade once again. If the dollar does weaken, perhaps as a result of monetary policy, then it would increase the cost of goods imported to the US which would push inflation higher. But it is not just in the US where we are seeing the early signs that inflation could be picking up. With global monetary policy still in accommodative mode and countries being accused of deliberate currency devaluation a sudden spike in inflation is possible. That would be bad news for bonds and government debt in particular but good news for commodity prices as well the companies that mine/refine them.
Brexit
Of course no 2020 outlook would be complete without the mention of Brexit. The Conservatives are committed to ensuring the UK leaves the EU by the 31st of January. Whether this materialises is one issue but the type of Brexit is another. In the aftermath of the general election result the pound rallied more than 2% to $1.35. The FTSE 250 lept almost 5% fuelled by the belief that a no-deal Brexit was now no longer on the table while the possibility of a more moderate version could be. However, since then reports have surfaced that Boris Johnson plans to enshrine in law an exit date from the EU, whether a deal is agreed or not. That put no-deal Brexit back on the table and the pound gave up all of its post-election gains.
The hope is that a resolution to Brexit could finally mean that UK stocks become attractive once again. In terms of currency, a Brexit deal and exit could see the pound quickly rally above $1.38 and in time push higher. If instead, we crash out of the EU then the pound could well fall back to the lows we've experienced in the last three years.
More food for thought
There are a host of other themes that will no doubt rear their head in 2020 which I will list:
- US stocks versus the rest of the world - as shown by the chart earlier US stocks continue to outperform stock markets around the world, particularly in the UK. Will 2020 simply be a continuation of this pattern or will there be a reversal of fortunes?
- Company earnings - despite each corporate earnings season during 2019 not being as bad as feared corporate earnings growth rates continue to decline. With company fundamentals seemingly detached from share price valuations will 2020 be the year when reality bites?
- Style shifts - the autumn of 2019 saw a sudden shift in the performance of various investment styles. Value stocks finally began to outperform growth stocks after years in the doldrums. Small caps also showed signs of life, outperforming large-caps as hopes of a global economic recovery took hold.
- Bond markets - aside from predicting an impending recession bonds had a stellar 2019 and until the start of October bond investors were outperforming equity investors year to date. Bond yields have since started to rise. Will 2020 finally be the year where the bond market crashes?

£200 Pension Cashback Offer
Make a qualifying deposit or transfer a pension to our partner Interactive Investor.
- Deposit or transfer a pension of at least £20k and you could earn £200 cashback
- Terms and Fees apply, Capital at risk
- New & Existing customers opening a SIPP
- Offer ends 31st July 2026
Before starting your transfer, check you won't lose any valuable benefits (such as guaranteed annuity rates or a lower protected pension age) and find out what exit fees you might have to pay
