

I was asked the following question by an 80-20 Investor member:
How often should I review my portfolio and make changes? Every month, or should I wait for 3 months or 6 months? What's the best strategy?
My response was as below:
"Hi
80-20 Investor is not prescriptive so the answer to how often you review your portfolio is down to the individual. However, the more regularly you review the more time you spend out of the market (if you use unit trusts) and the higher the trading charges (if you use investment trusts and ETFs).
So it is important to strike a balance. If you read through my reviews of my £50k portfolio, although the articles are monthly, you will see that often I don’t change anything or only make minimal changes.
Also have a read of this 80-20 Investor article on rebalancing.
Finally, keep an eye out as I plan to produce a piece of research on the exact question you’ve raised.
Best wishes
Damien"
The lazy 80-20 Investor
As stated in my response above I had already decided to explore the impact of reviewing a portfolio over a variety of time periods. When developing the algorithm that lies behind 80-20 Investor I tested a wide range of variables that could potentially impact investment returns. One such variable was the time frame of which an investment was held. The 80-20 Investor algorithm allows for investments to be held for up to six months before they are reviewed.
The desire for investors to continually tweak their portfolios is understandable but as I state in my answer above, 80-20 Investor is not dictatorial. Its aim is to help investors make informed investment decisions based upon their own views and frequency of investment reviews. There is a tendency to think that given the positive impact of reviewing your portfolio, then the more frequently you review it the greater the impact.
Equally, I have received emails from 80-20 Investor members who feel compelled to constantly tweak their portfolios in line with the frequency that the BFBS & BOTB tables are updated. The BFBS tables are updated weekly while the BOTB table is updated monthly. Those investors then fell overwhelmed with the 'workload' they are creating.
So I decided to explore what would have happened had the 80-20 Investor BOTB only been updated at various time frames rather than every month.
Methodology
The first ever BOTB selection was produced in August 2014, almost 5 years ago. That means there have been 60 monthly updates. The chart below shows the indicative performance of the BOTB over that time. It is only indicative as it assumes that someone buys every fund within the BOTB each month and then switches every time a new BOTB is produced. It also ignores any fund switch delays.

In my previous research article 'Do fund switch delays hit your 80-20 investment returns?' I concluded that fund switch delays (up to two days long) don't impact your performance when using 80-20 Investor and momentum, to any significant degree. That's because things eventually even themselves out i.e. markets move for you sometimes and against you at other times. Furthermore, as I am comparing one indicative portfolio to other indicative portfolios in this article (which also ignore fund switch delays) then any comparisons remain valid.
So I went back and recreated what would happen if the BOTB was updated every three months (the blue line), every six months (the red line) and annually (the black line). Click on the chart below to enlarge it.
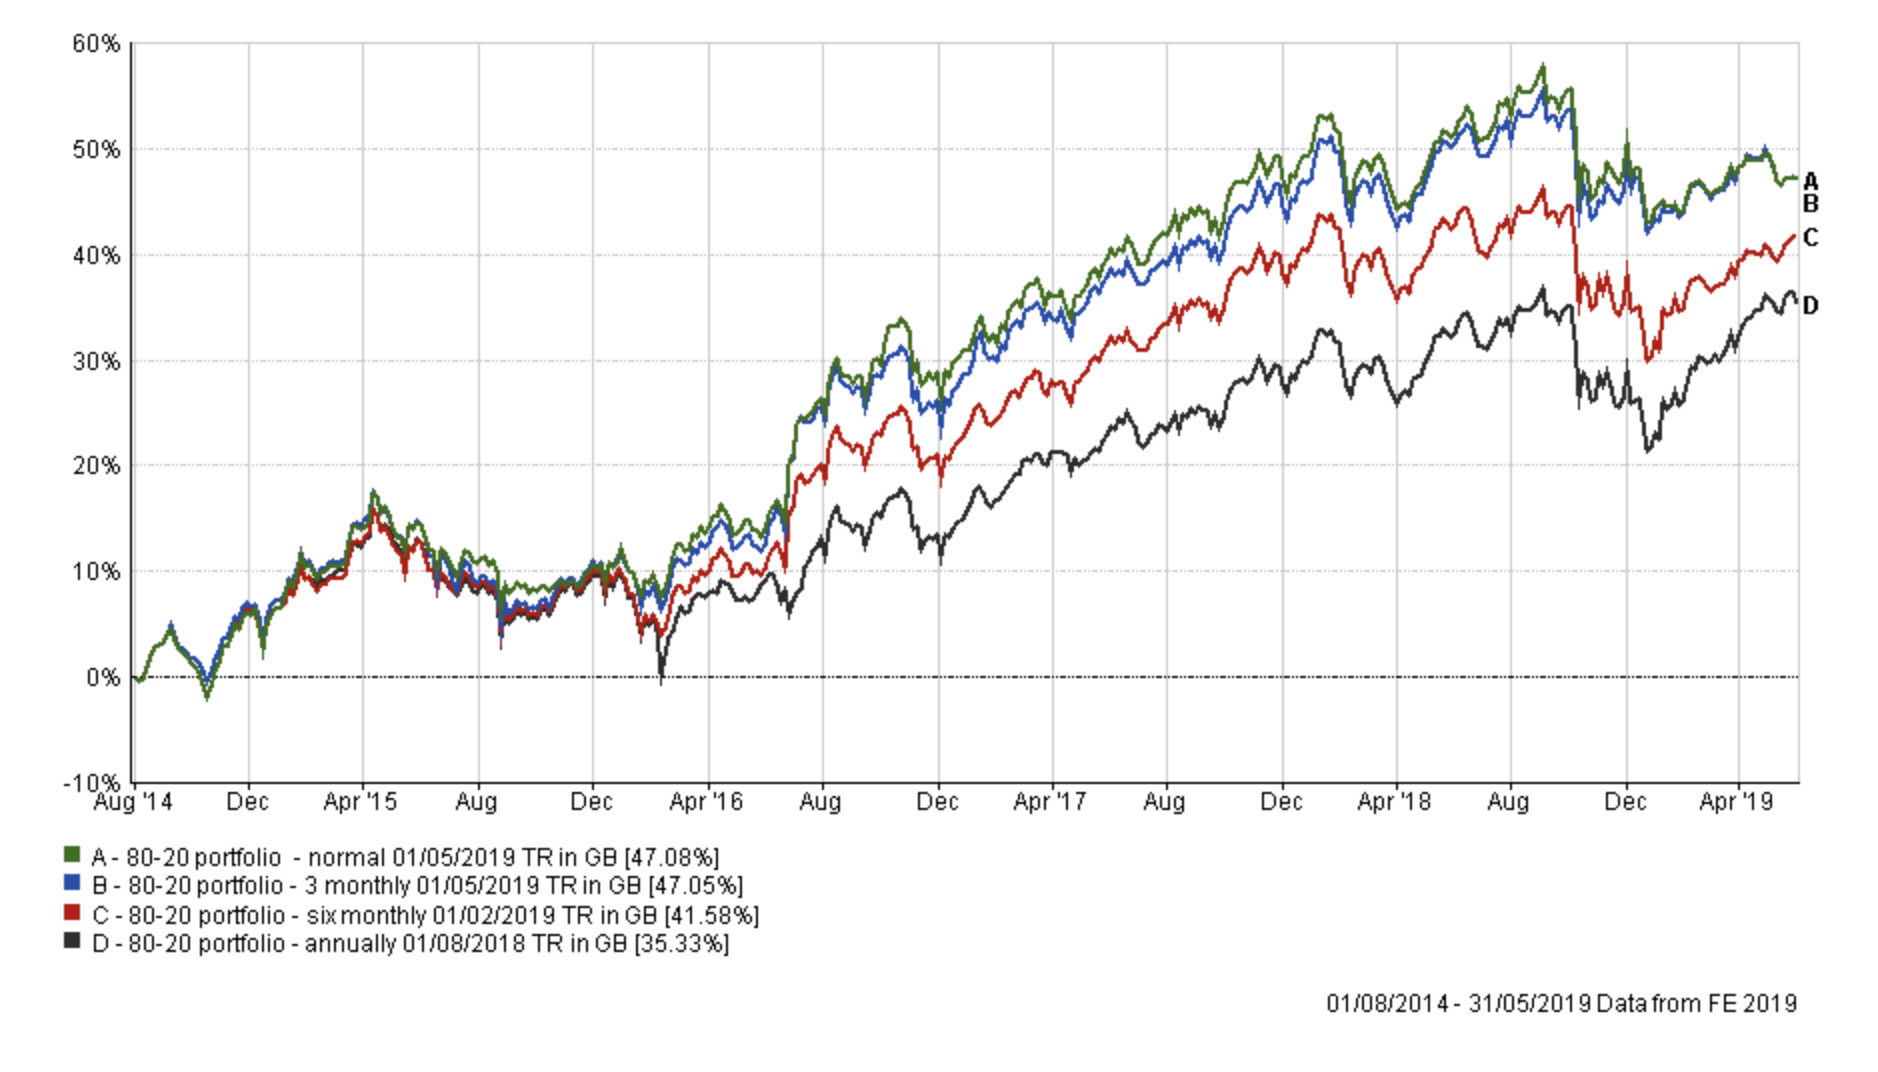
The first conclusion that you will reach is that the more frequently you review/change your portfolio the more it boosts your returns. However, there is clearly a law of diminishing returns in doing so. In fact, the performance of the monthly portfolio versus the three-monthly portfolio is basically identical. If we were to have factored in any switching delays (the monthly portfolio will have likely made almost three times as many switches as the three-monthly portfolio) perhaps the picture may have been marginally different.
However, as with any performance comparison, the time frame chosen is important. If instead, I run the performance chart from 1st August 2014 to 31st December 2018, then the monthly portfolio outperforms all the other variants (except the three-monthly version) by an even more significant margin. That is because the monthly portfolio avoided the worst of the December sell-off. Don't forget that at that point, nobody had any idea of whether the market would continue to crash or not.

If you then analyse the Sharpe ratio for each portfolio over the same timeframe (see table below), you can see that the monthly and three-monthly portfolio have the highest value. The Sharpe Ratio is a measure of the level of excess return the fund manager earns for the extra risk he/she has taken. The higher the figure the better.
| Variant | Sharpe ratio |
| 80-20 portfolio normal | 0.61 |
| 80-20 portfolio 3 monthly | 0.6 |
| 80-20 portfolio six monthly | 0.36 |
| 80-20 portfolio annually | 0.17 |
So why is there such a difference between reviewing your portfolio 6 monthly versus monthly? But also why the similarity between one month and three-month variants?
The answer lies in how the 80-20 Investor BOTB selection changes over time. From one month to the next the BOTB typically retains 50-66% of its funds. If we assume this rate is consistent then it follows that after three months around 12%-21% of the funds that started in the BOTB remain in it. Out of the original list of 30 funds that is the equivalent of 6-7 funds from the original BOTB list still being present. Beyond the third month, future BOTB lists will be very different from the original BOTB list produced in month 1. By month 6, the odds are that only 1 fund will remain in the BOTB from the original list.
The six-month window is therefore clearly of sufficient size for momentum and the underlying market trends to have changed, so warranting a review. This is also backed up by the research findings produced during the development of the 80-20 Investor algorithm.
The fact that there's not much difference between the three-month and one-month portfolio shows the robustness of the algorithm and the selection process behind 80-20 Investor. The algorithm contains a risk screen which reduces the volatility of the selection. It means that an element of consistency in performance is favoured.
It is pleasing to see that over the last 5 years that the 80-20 Investor process has worked 'in the field'. The results justify the light touch approach that was part of the original design, but which I also champion in my own £50k portfolio. Typically funds are held for at least 3 months in my portfolio (sometimes as long as 18 months) as I prefer to prune and weed rather than overhaul.
While of course, the findings above are based on a relatively small sample size (of five years) it should go a long way towards answering many of your questions and fears when it comes to the frequency of reviewing your portfolio. It's ok to take a more 'lazy' approach.

£200 Pension Cashback Offer
Make a qualifying deposit or transfer a pension to our partner Interactive Investor.
- Deposit or transfer a pension of at least £20k and you could earn £200 cashback
- Terms and Fees apply, Capital at risk
- New & Existing customers opening a SIPP
- Offer ends 31st July 2026
Before starting your transfer, check you won't lose any valuable benefits (such as guaranteed annuity rates or a lower protected pension age) and find out what exit fees you might have to pay
