

Long-term 80-20 Investor members may remember that seven years ago I embarked on a research endeavour to find the Perfect ISA Portfolio.
In simple terms, I was trying to work out the Perfect ISA Portfolio asset mix (or whether one even existed). Was there an asset mix that had always produced a positive return in every tax year historically? Of course that wasn't enough, as just investing in cash would have achieved this. So finding the Perfect ISA Portfolio also had to maximise the upside, far outperforming cash returns. So I created a number of rules that the Perfect ISA Portfolio had to adhere to. The rules were that:
- There would be no constraint over which assets could be included or in what proportions they are held
- The portfolio must have made money every tax year since the market peak back in 2000
- and not lost money
- It had to at least beat a FTSE 100 Index tracker over the entire time period and
- The asset allocation had to remain constant throughout that time (with annual rebalancing to ensure this)
So, in essence, I wanted to find the perfect 'buy and forget' asset allocation.
Just to recap...
The portfolio had to achieve the above aims irrespective of the actual funds you'd bought. So to make sure I was only looking at the asset allocation I always used the sector average return for each asset type.
To recap, my analysis covered 27 sectors (see the original article for the full list).
The number of possible combinations was mind-blowing and it took me two full days to analyse it. I revealed the Perfect ISA portfolio is split as follows:
- 9% cash
- 71% UK Gilts
- 20% UK Equity Income
Since that time I have revisited the Perfect ISA Portfolio each year to see how it has fared in the real world. While the aim of the original research piece was to determine a 'Perfect' asset allocation based on the above rules it was also to determine whether one even existed and to educate 80-20 Investor members on how to go about finding one. One of my aims with 80-20 Investor has always been to spark an inquisitive nature in members and show them how to carry out their own research. It is all about building a hypothesis, working out the best way to test it and then analysing the results. It may well be that you reach a final conclusion. Sometimes it may be that you don't. That is part of the fun and it may surprise you that some of my 80-20 Investor research never sees the light of day because I can't support the hypothesis.
Also some research never ends, such as the Perfect ISA Portfolio because it is constantly being tested in the field every year.
Staying ahead despite the pandemic rebound
This time last year I carried out my annual review of the Perfect ISA portfolio to see how it had fared during the 2019/20 tax year. I also looked at how it was performing in the 2020/21 tax year which, at the time, was coming to an end. I can now confirm that the Perfect ISA portfolio did in fact end up finishing the 2020/21 tax year in positive territory, as shown below. 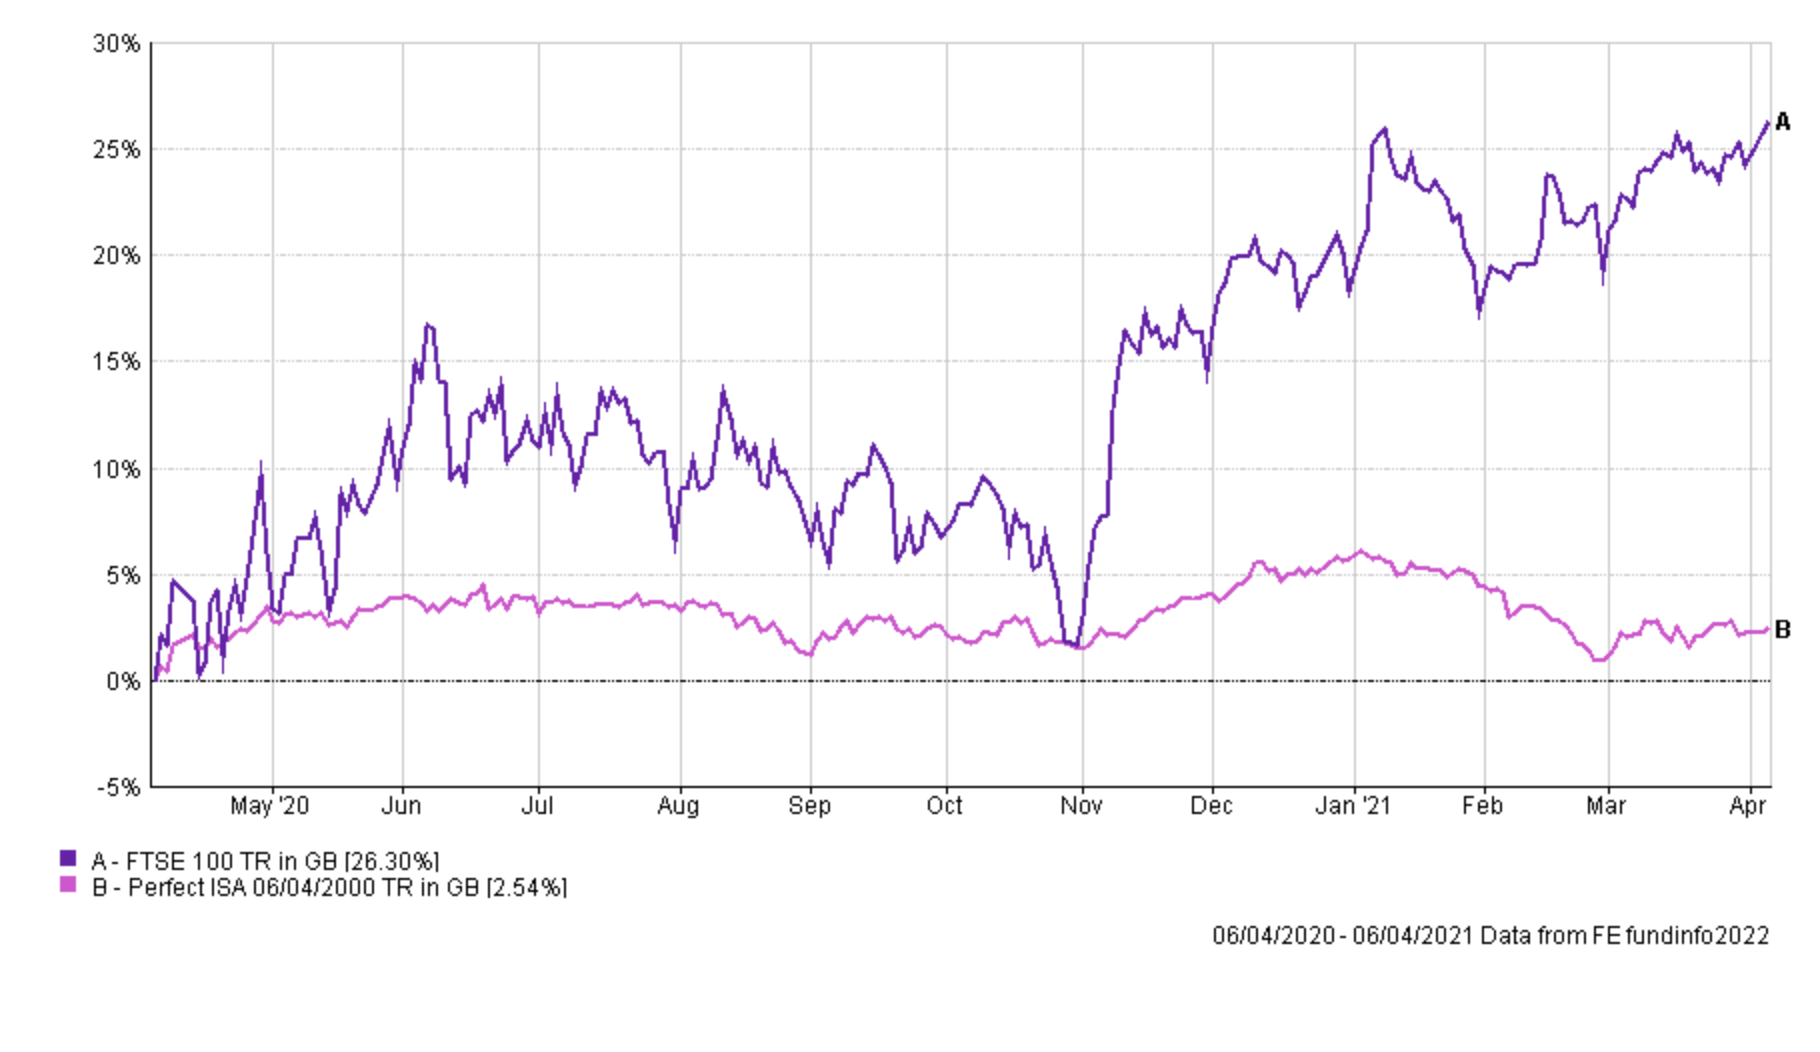
Not only that but it continued to outpace the FTSE 100 over the long term despite the post-pandemic rebound in equity markets.
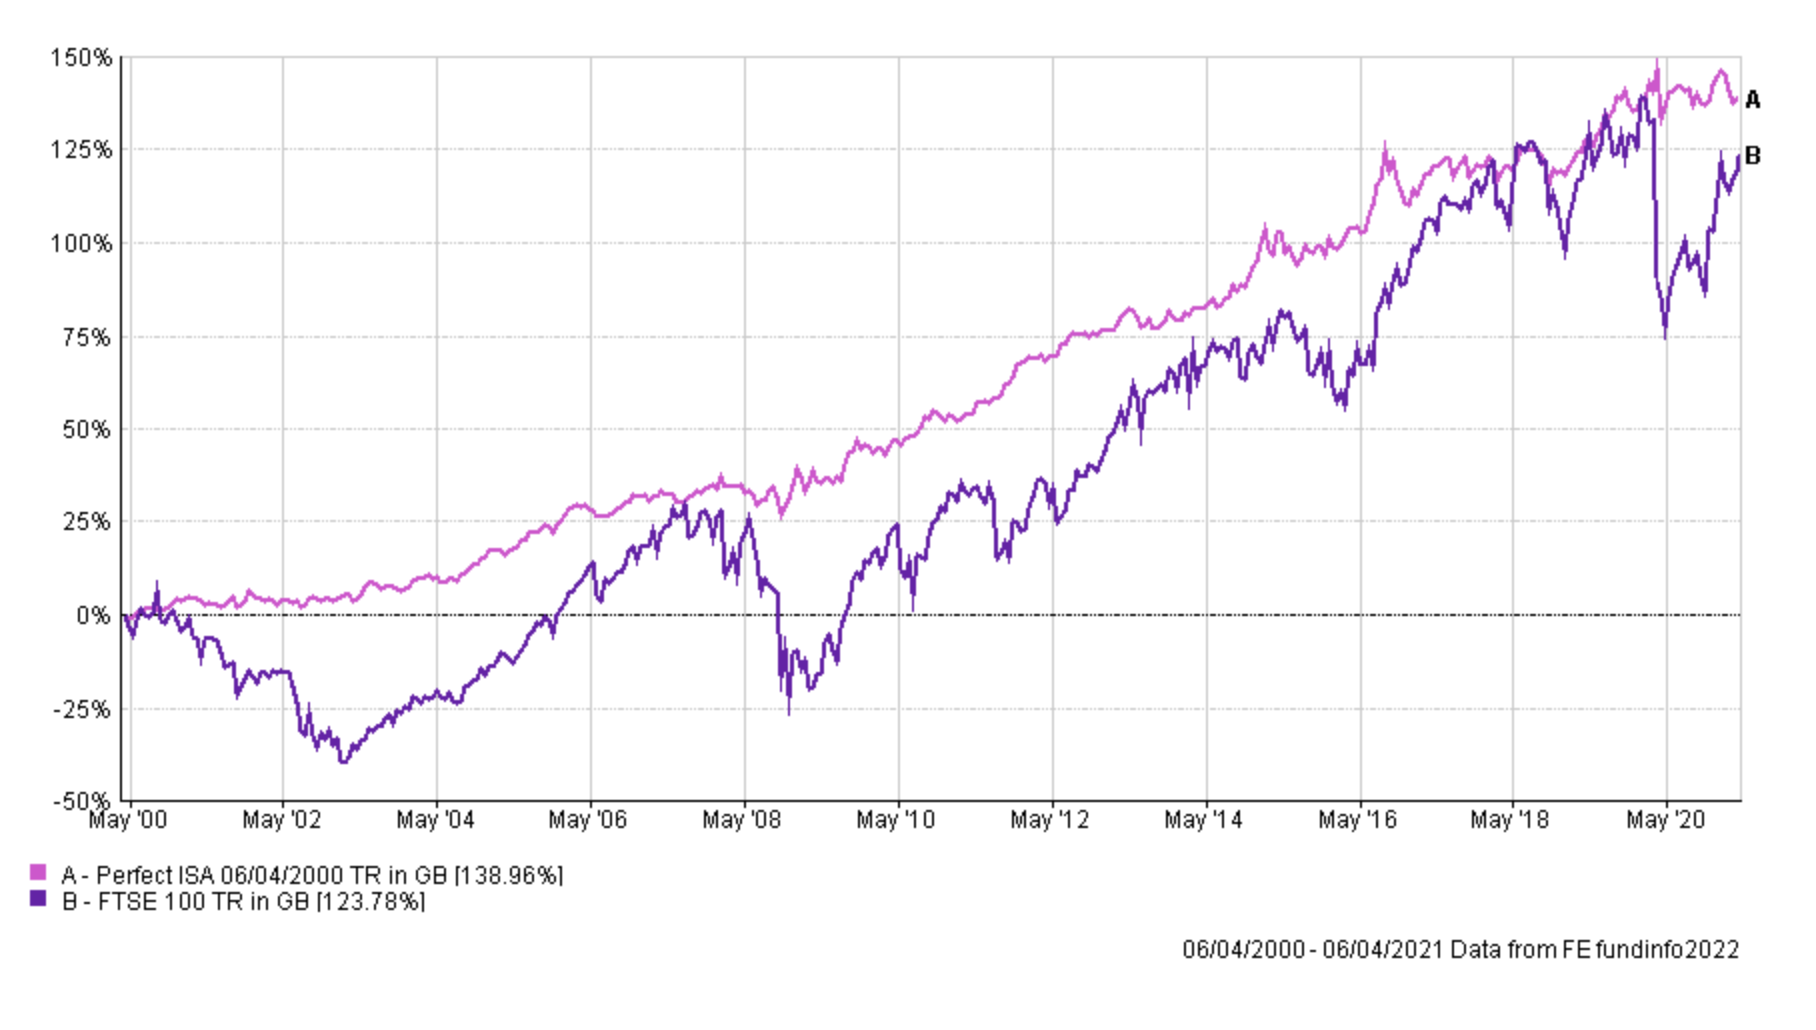
So that means that the Perfect ISA Portfolio's perfect record remains intact for the 21st year in a row, as shown by the table below. This is an incredible achievement.
| Tax Year (the starting year) | FTSE 100 return% |
Perfect ISA Portfolio return %
|
| 2000 | -11.13 | 3.26 |
| 2001 | -4.11 | 0.33 |
| 2002 | -24.52 | 0.51 |
| 2003 | 21.30 | 5.56 |
| 2004 | 14.46 | 6.65 |
| 2005 | 26.34 | 10.43 |
| 2006 | 9.37 | 2.17 |
| 2007 | -3.63 | 1.86 |
| 2008 | -29.94 | 0.59 |
| 2009 | 50.49 | 8.43 |
| 2010 | 7.95 | 4.67 |
| 2011 | -1.74 | 9.84 |
| 2012 | 13.44 | 7.31 |
| 2013 | 11.04 | 0.60 |
| 2014 | 5.73 | 10.96 |
| 2015 | -6.35 | 0.99 |
| 2016 | 23.44 | 7.77 |
| 2017 | 2.26 | 0.03 |
| 2018 | 8.27 | 2.78 |
| 2019 | -21.84 | 2.91 |
| 2020 | 26.30 | 2.54 |
How has the Perfect ISA Portfolio fared so far in the 2021/22 tax year
The chart below shows how the Perfect ISA Portfolio (the pink line) has fared so far this tax year versus the FTSE 100 (in purple). You can see that it was performing strongly until the new year when bond markets tumbled as the reality of higher inflation and central bank monetary tightening came to the fore.
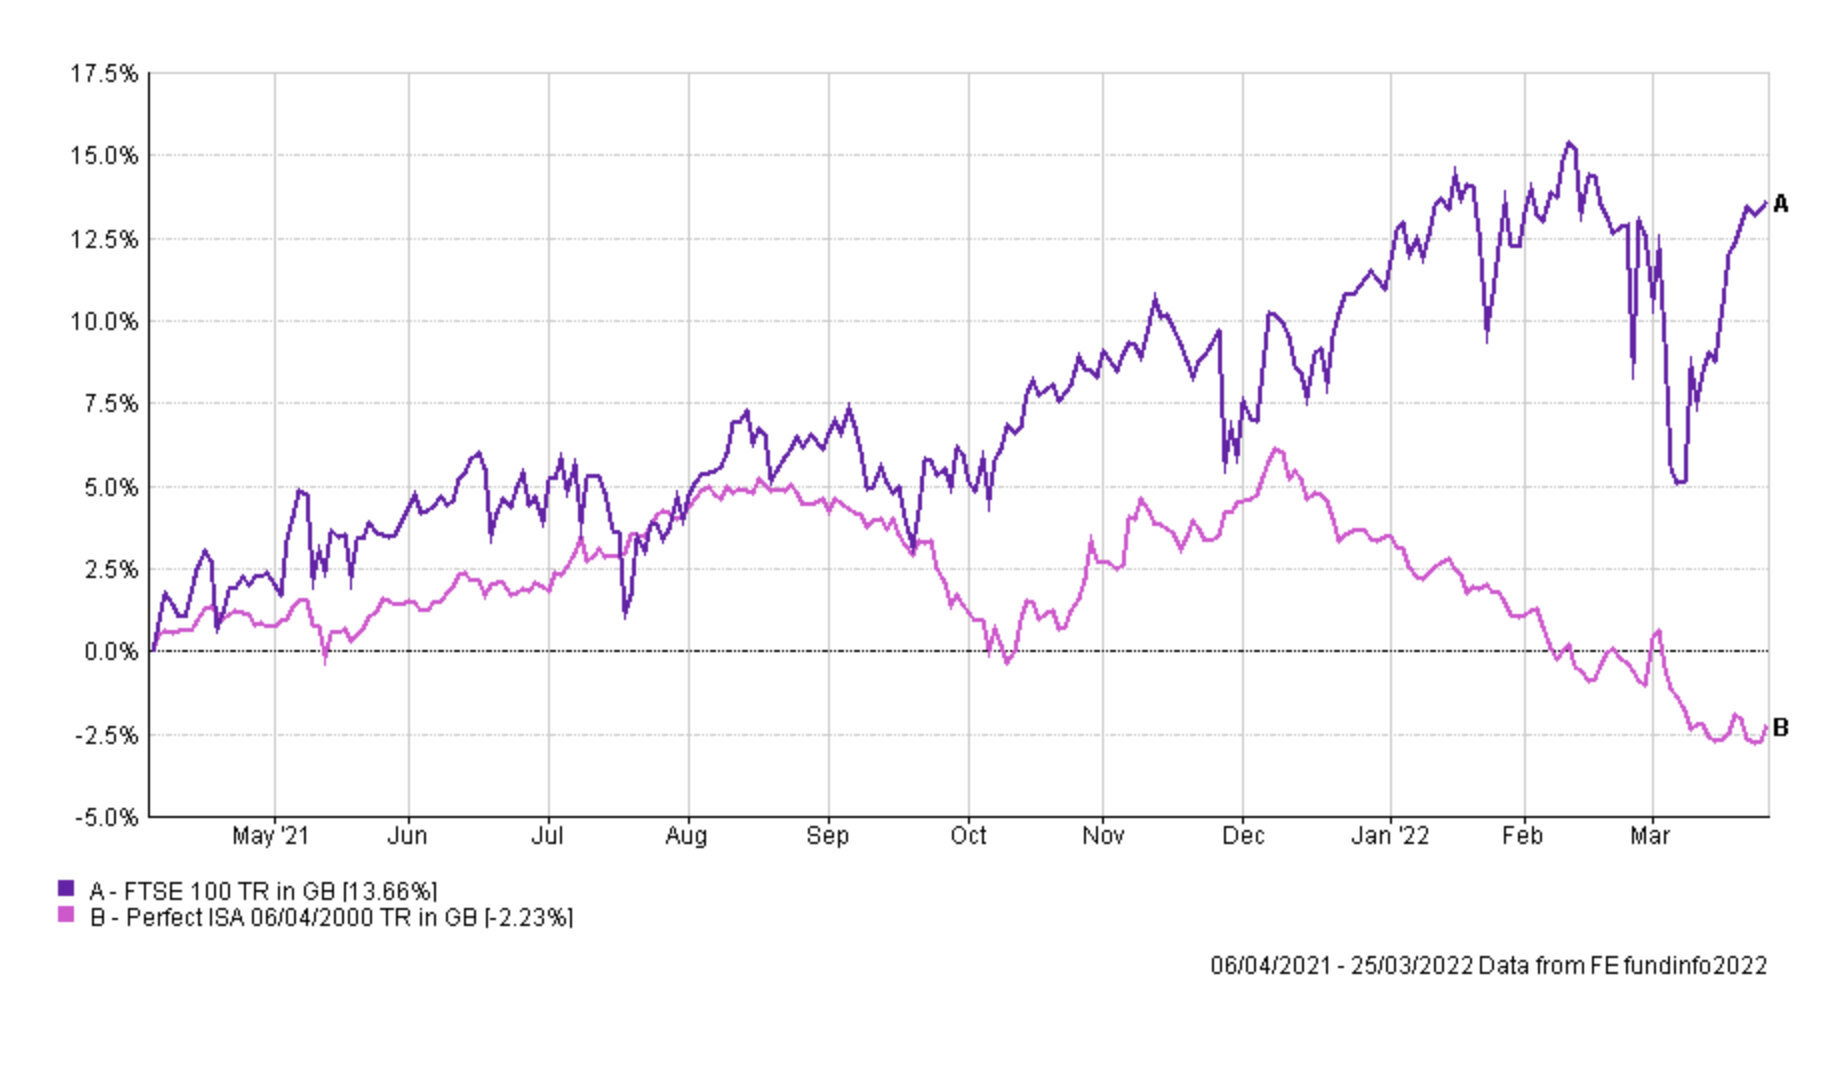
The FTSE 100 has rebounded from its February 2022 low thanks to its exposure to energy stocks (especially oil companies) whose share price has benefited from the spike in the price of oil following Russia's invasion of Ukraine. At present, the Perfect ISA portfolio has now dipped into negative territory with days left in the current tax year. Will it recover to maintain its 100% tax year performance record? But not only, that the surge in the FTSE 100 over the past 12 months places the portfolio's long term outperformance of the FTSE 100 under threat too.
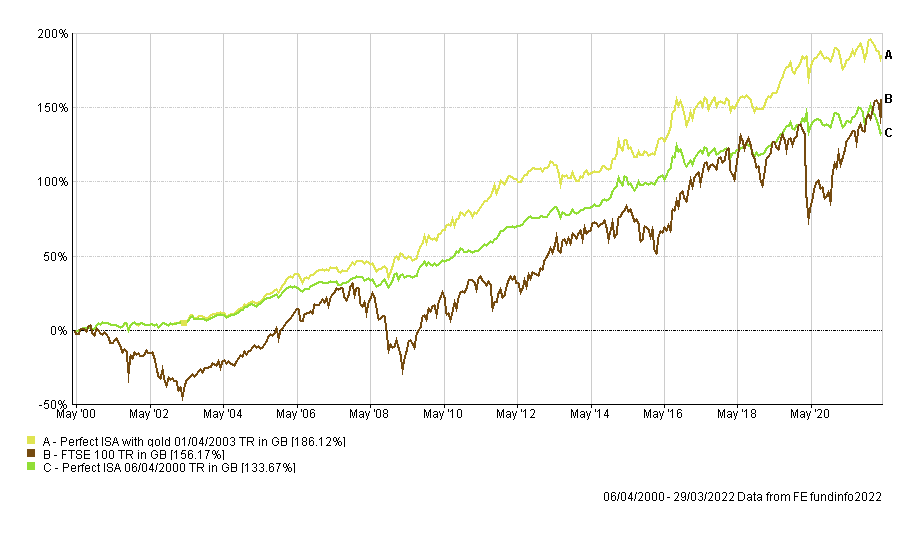
Interestingly in my research piece titled "The best all-weather portfolios analysed" I created the Perfect Gold Portfolio which replaces the cash element of the original 80-20 Investor Perfect Portfolio with gold. While this portfolio hasn't made a profit in every tax year since the year 2000 (making a loss of -3.04% in 2013/14 and a loss of -0.9% in 2017/18) it has performed strongly this tax year, up 2.53% so far. But gold's strong performance so far in 2022 is propelling the portfolio higher, leaving the FTSE 100 in its wake over the long term.
The 80-20 Investor Perfect ISA Portfolio
Each year I also like to see what would have happened if you had used the 80-20 Investor algorithm to choose the equity funds to invest in. The assumption made is that since 6/4/2000 you would have invested £239,560 in total if you had invested your full annual ISA allowance at the start of each tax year. The result of applying 80-20 Investor to the equity content (switching equity income funds every 3 months) up until the end of the tax year in 2021 would then have been:
| Total Invested | £239,560 |
| 80-20 Perfect ISA Portfolio return | £375,070 |
| Perfect ISA Portfolio return | £350,435 |
So you would have been £24,635 better off with the 80-20 Investor version (i.e. using 80-20 Investor to help choose the funds to invest it).
The three UK equity income funds that would have been picked for the Perfect ISA Portfolio at the start of January 2022 were:
- Allianz - UK Listed Equity Income
- Invesco - Income & Growth (UK)
- Schroder - Income
So what are the key takeaways from this research
Once again, the Perfect ISA Portfolio has defied the market and maintained its record of making a positive return in every tax year since the year 2000, as well as maintaining its cumulative outperformance over the FTSE 100 since April 2000. The fact that its unblemished record now stretches to 21 years is a testament to the robustness of the original research carried out 7 years ago. The validity of the research continues to be tested in the field each year and I am especially proud of the results.
As I remind you each year, dynamism is at the heart of 80-20 Investor. By that I mean the ability to review and alter your asset mix and funds to ride the prevailing momentum in markets. However, sometimes investors will want to take a buy and hold approach with some of their money. That's perfectly fine but you can still use 80-20 Investor's research to try and improve returns. 80-20 Investor is not dictatorial and you don't have to just focus on the BOTB funds. The BFBS tables are just as important, in this instance the UK equity income sector shortlist would be particularly relevant.
Interestingly at the time of writing gilt funds are enduring a torrid time as the bond market reprices the prospect of higher inflation and central bank tightening. Understandably, at present, there are no gilt funds within the BOTB or the BFBS tables. However, the Perfect ISA Portfolio research assumes that you achieve the average return from a typical UK gilt fund. Because of their limited investment remit the range of returns achieved from gilt funds is very narrow when compared to the range of returns within other unit trust sectors. In other words the Perfect ISA Portfolio could still be applied by picking a fund that has tracked the UK gilt sector average over recent history.
For those who'd prefer to apply a Perfect ISA approach to the core of their portfolio there are passive options too. Back in 2015 a separate piece of my research was published in The Telegraph called Funds to ‘buy & forget’ in 2015. It highlighted Vanguard – LifeStrategy 20% Equity. Uncannily the fund has 20% of assets in equities globally, not just the UK, and the other 80% in fixed interest (bonds and gilts). Its global exposure does mean that it is exposed to currency moves (which my Perfect ISA Portfolio isn't to the same degree). It hasn't produced a positive return every tax year. But overall it isn't a bad proxy for my Perfect ISA Portfolio asset mix and automatically rebalances its asset mix.

£200 Pension Cashback Offer
Make a qualifying deposit or transfer a pension to our partner Interactive Investor.
- Deposit or transfer a pension of at least £20k and you could earn £200 cashback
- Terms and Fees apply, Capital at risk
- New & Existing customers opening a SIPP
- Offer ends 31st July 2026
Before starting your transfer, check you won't lose any valuable benefits (such as guaranteed annuity rates or a lower protected pension age) and find out what exit fees you might have to pay
