

By now you all realise that I spend a lot of time producing analysis and research that can stand the test of time. It is a brave thing to do to produce articles with titles such as Funds to ‘buy & forget’ in 2016. Yet that is exactly what 80-20 investor is all about and what makes it unique.
In the same vein a year ago I produced an in-depth article revealing The Perfect ISA Portfolio. To recap I am often asked 'Where should I invest my ISA allowance?' So I set out to determine the perfect combination of different types of assets that can not only make you money but reduce the chance of you making a loss.
Perfect ISA Portfolio
To find the perfect ISA portfolio I laid down a series of ground rules:
- There would be no constraint over which assets could be included or in what proportions they are held
- The portfolio must have made money every tax year since the last market peak back in 2000 and not lost money
- It had to at least beat a FTSE 100 Index tracker and
- The asset allocation had to remain constant throughout that time
So in essence I wanted to find the perfect 'buy and forget' asset allocation. One which would have achieved the above irrespective of the actual funds you'd bought. So to make sure I was only looking at the asset allocation I always used the sector average return for each asset. My analysis covered 27 sectors (see the original article for the full list).
The number of possible combinations was mind-blowing and it took me two full days to analyse it. I revealed the Perfect ISA Portfolio is split:
- 9% cash
- 71% UK Gilts
- 20% UK Equity Income
How has the Portfolio fared in 2015/16 - with markets down 6%?
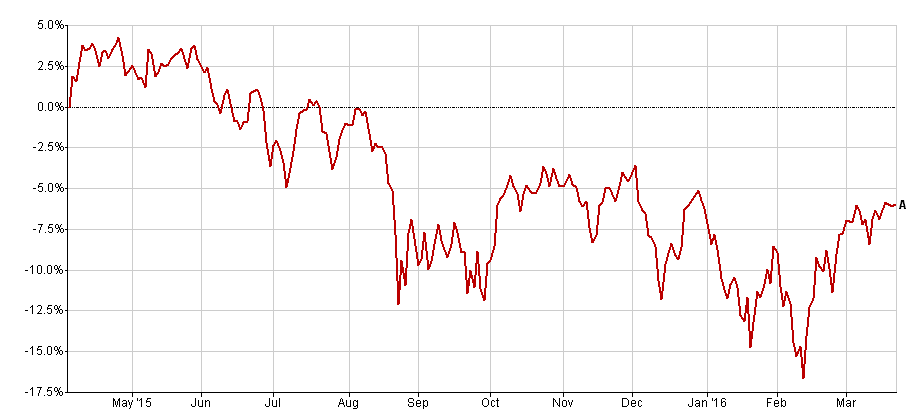
2015/16 has been the worst year for investors since the financial crisis in 2008! At the time of writing the total return from the FTSE 100 since the start of the current tax year (6th April 2015) is -6%, as shown in the chart below:
So how has the Perfect ISA Portfolio fared so far in this tax year? Well it may come as a surprise (although perhaps it shouldn't) the Perfect ISA Portfolio is in profit, up 0.42%, as shown in the chart below by the green line (click to enlarge). Not only that but it also avoided the worst of the market sell-off because of its limited equity exposure.
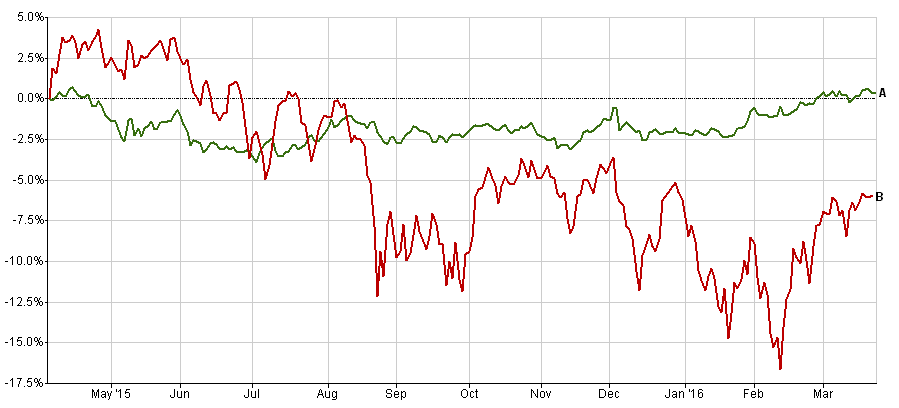
This year's current profit follows a 10.93% return in the 2014/15 tax year! Below is a complete list of how the portfolio has fared since 2000.
| Tax year | FTSE 100 % return | Perfect ISA % return |
| 2015 (to date) | -5.96 | 0.42 |
| 2014 | 5.73 | 10.93 |
| 2013 | 11.04 | 0.6 |
| 2012 | 13.44 | 6.83 |
| 2011 | -1.74 | 9.87 |
| 2010 | 7.95 | 4.78 |
| 2009 | 50.49 | 7.71 |
| 2008 | -29.94 | 0.02 |
| 2007 | -3.63 | 0.86 |
| 2006 | 9.37 | 2.47 |
| 2005 | 26.34 | 10.27 |
| 2004 | 14.46 | 6.38 |
| 2003 | 21.3 | 4.69 |
| 2002 | -24.52 | 0.63 |
| 2001 | -4.11 | 0.3 |
| 2000 | -11.13 | 3.23 |
Double your money
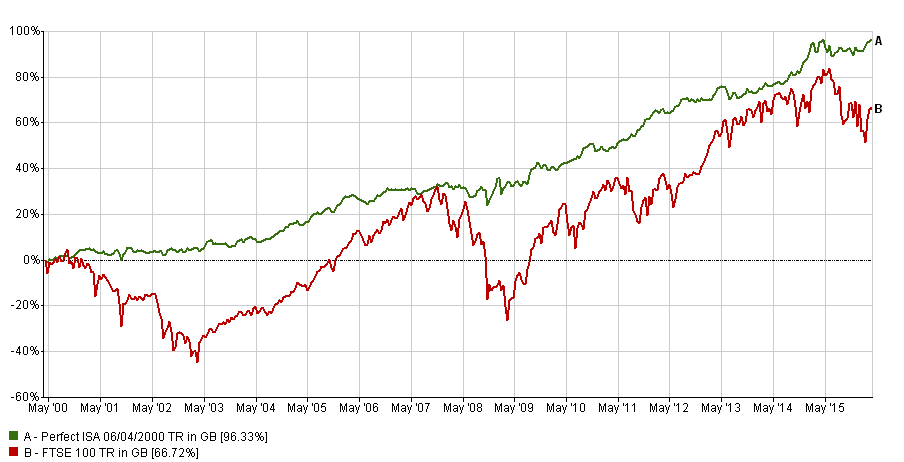
So how would someone who had bought the Perfect ISA portfolio have fared if they had bought it back in 2000? Well the chart shows the Perfect ISA (green line) massively outperformed the FTSE 100 (red line) and pretty much doubled investors' money. That implies a healthy average annual return for the Perfect ISA portfolio of 4.38%.
The 80-20 Perfect Portfolio revisited
Last year I also highlighted that if you want to maximise your returns then simply buying a tracker fund that will replicate the Perfect ISA Portfolio won't achieve this.
If instead you used the 80-20 Investor algorithm to choose the UK equity income funds to invest in for the 20% part of the Perfect ISA portfolio invested in equities your returns would be hugely improved. That's despite the equity content of the portfolio making up such a small part of the Perfect ISA portfolio.
The table below shows how much money an investor would have today if at the start of each tax year they had invested their full ISA allowance into:
- the Perfect Portfolio using trackers
- the 80-20 Investor Perfect Portfolio where our algorithm chooses the UK Equity income funds (I've split the 20% across 3 funds each time).
The ISA allowance has increased from £7,000 to £15,240 over the last 15 Years. So if someone had invested their ISA allowance each year they would have invested a total of £144,320
| Total Invested | £144,320 |
| Perfect ISA portfolio | £207,107 |
| 80-20 Perfect ISA portfolio | £218,208 |
image by Stuart Miles (freedigitalphotos.net)
The material in any email, the MonetotheMasses.com website, associated pages / channels / accounts and any other correspondence are for general information only and do not constitute investment, tax, legal or other form of advice. You should not rely on this information to make (or refrain from making) any decisions. Always obtain independent, professional advice for your own particular situation. See full Terms & Conditions and Privacy Policy
Neither MoneytotheMasses.com/80-20 Investor nor its content providers are responsible for any damages or losses arising from any use of this information. Past performance is no guarantee of future results.
Funds invest in shares, bonds, and other financial instruments and are by their nature speculative and can be volatile. You should never invest more than you can safely afford to lose. The value of your investment can go down as well as up so you may get back less than you originally invested.
Information provided by MoneytotheMasses.com/80-20 Investor is for general information only and not intended to be relied upon by readers in making (or not making) specific investment decisions.
Appropriate independent advice should be obtained before making any such decisions. Leadenhall Learning (owner of MoneytotheMasses.com/80-20 Investor) and its staff do not accept liability for any loss suffered by readers as a result of any such decisions.
The tables and graphs are derived from data supplied by Trustnet. All rights Reserved.

£200 Pension Cashback Offer
Make a qualifying deposit or transfer a pension to our partner Interactive Investor.
- Deposit or transfer a pension of at least £20k and you could earn £200 cashback
- Terms and Fees apply, Capital at risk
- New & Existing customers opening a SIPP
- Offer ends 31st July 2026
Before starting your transfer, check you won't lose any valuable benefits (such as guaranteed annuity rates or a lower protected pension age) and find out what exit fees you might have to pay
