

The background to my portfolio
Back in March 2015 I decided to invest £50,000 of my own money using 80-20 Investor. The purpose was twofold, firstly to show how you can use 80-20 Investor to invest and outperform the market with only a few minutes effort every now and then. Secondly, no other investment commentator, journalist or research provider invests their own money for fear of failing. This is a sorry state of affairs and is precisely why I committed to openly running my own portfolio for 80-20 Investor members to see.
Since then I have periodically changed my portfolio using the fund suggestions provided by the 80-20 Investor algorithm and associated research. I always disclose the changes at the time they are made.
Performance update
As is usual in my portfolio reviews, the chart below shows how my portfolio has outperformed since I started the challenge in March 2015, which is five years ago. The green line is the performance of my portfolio while the red line is the benchmark showing the average return achieved by professional fund managers given the same asset mix. To accurately calculate this I have used the average return for each sector in which my portfolio invested. The blue line shows what the average multi-asset fund with comparable equity content achieved. In other words, the red line would show the extra performance added by just the asset mix of my portfolio (where I was invested i.e European equities etc) over picking a typical multi-asset fund (the blue line). While the green line (which is my actual performance) shows the impact of being in the right funds at the right time, as identified by the 80-20 Investor algorithm.
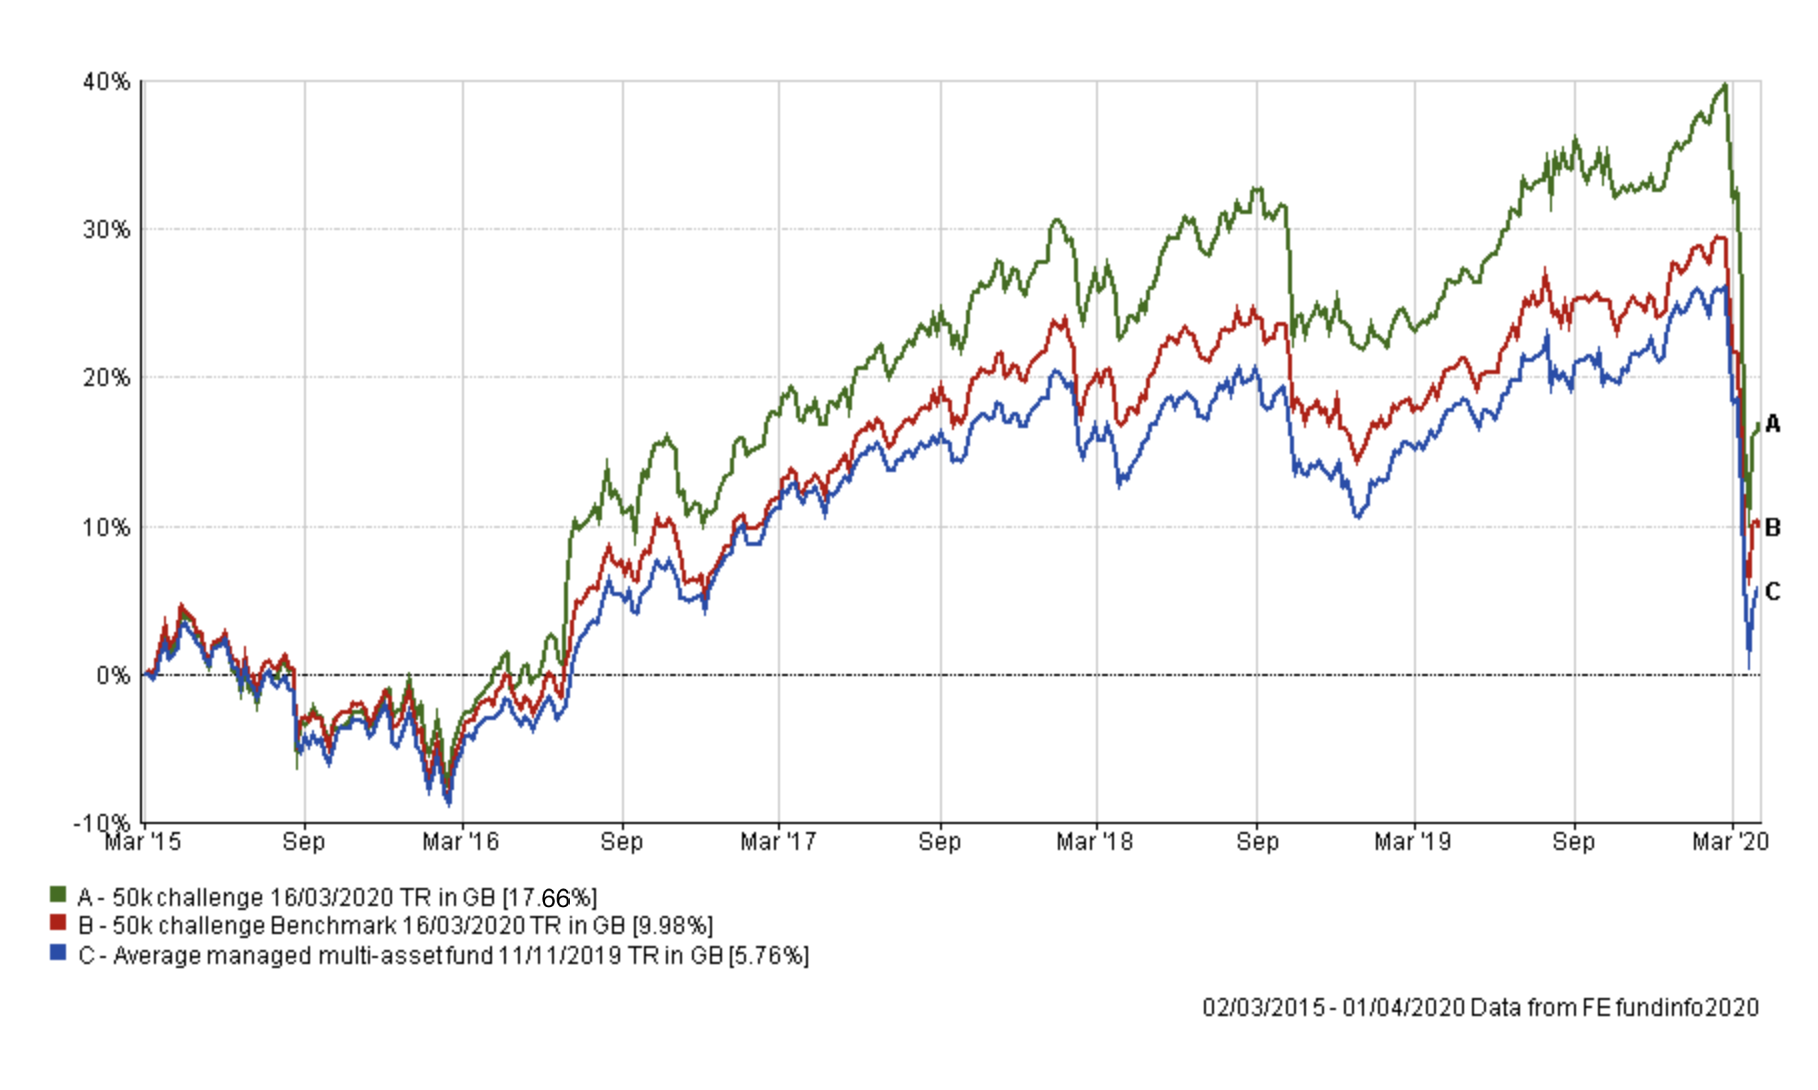
March was the month when markets capitulated and all assets became correlated. Institutional Investors rushed to liquidate anything they could get their hands on in order to meet margin calls. That meant that even traditional haven assets such as gold and bonds crashed. Defensive equity sectors such as REITs and Utilities were sold and played catch-down to other sectors already hit in the coronavirus wash out. Ironically my portfolio's defensive positioning, therefore, meant that it lagged its benchmarks during the month of March. This explains why the portfolio has given up some of its long term outperformance over its benchmarks, as shown above.
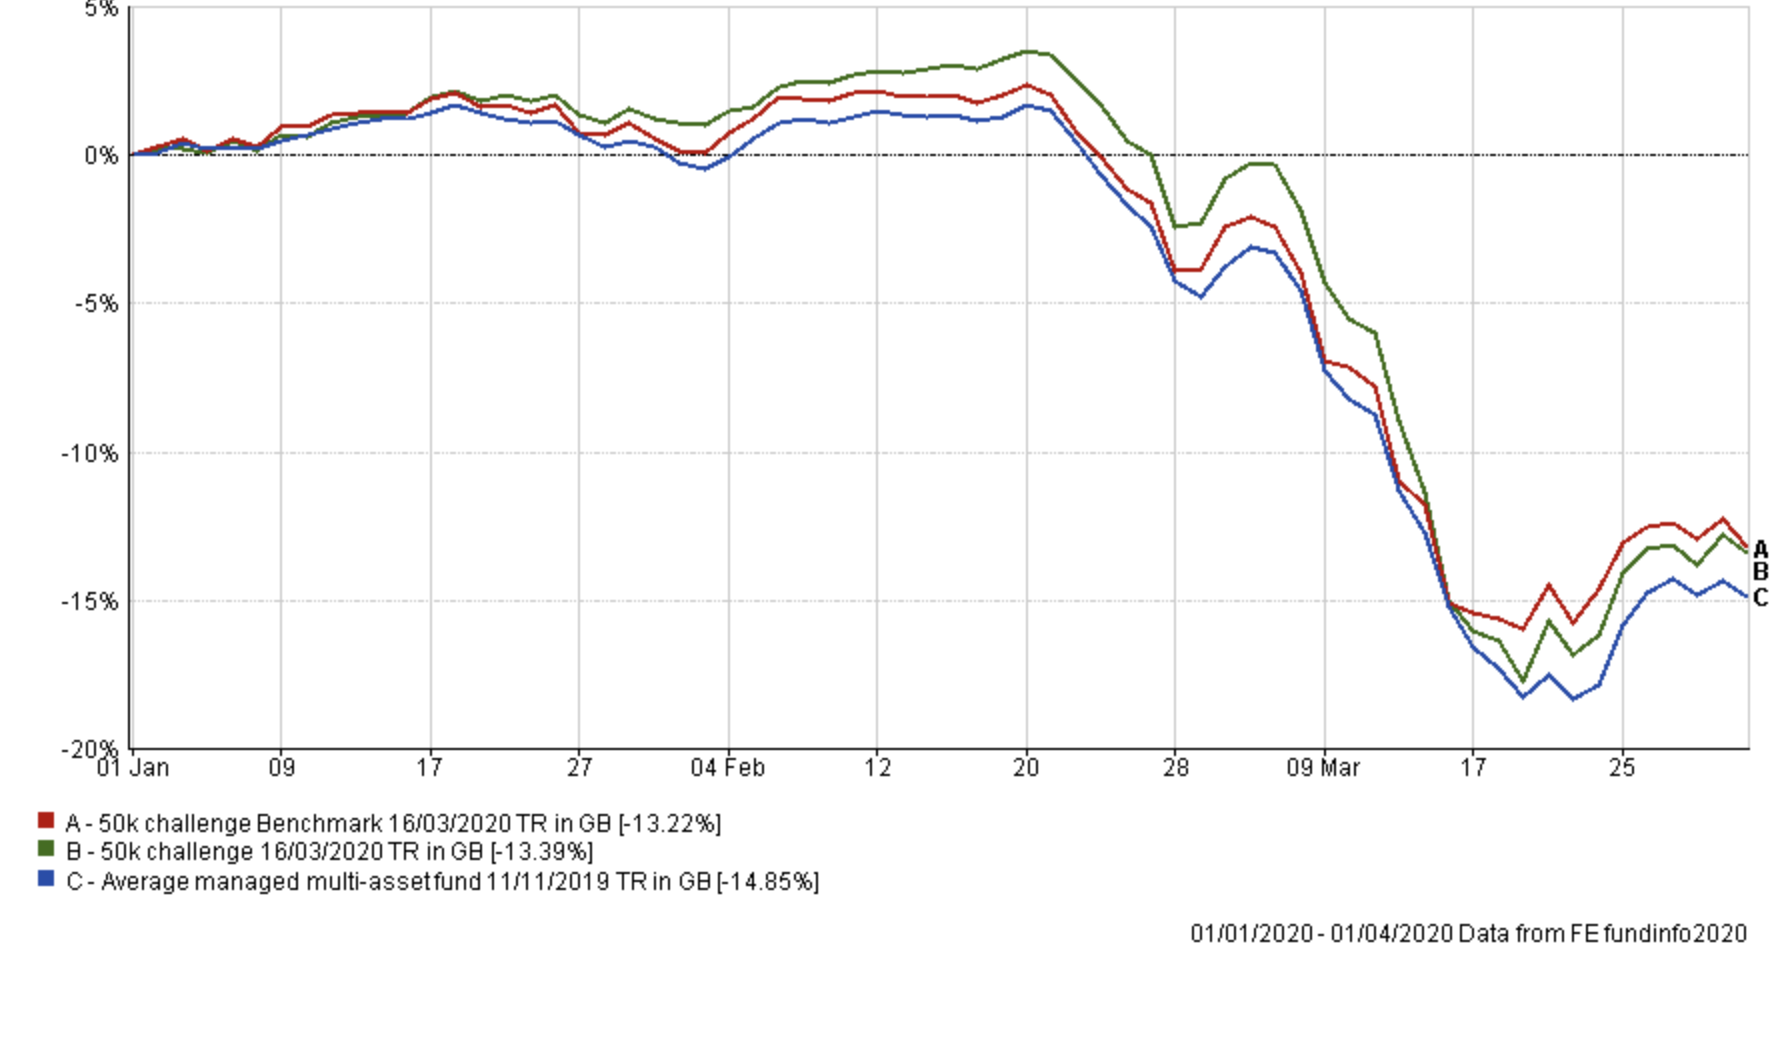
The chart below shows the performance of my portfolio versus its benchmarks since the start of the year. You can see how my portfolio outperformed initially during the sell-off before all boats sunk at once.
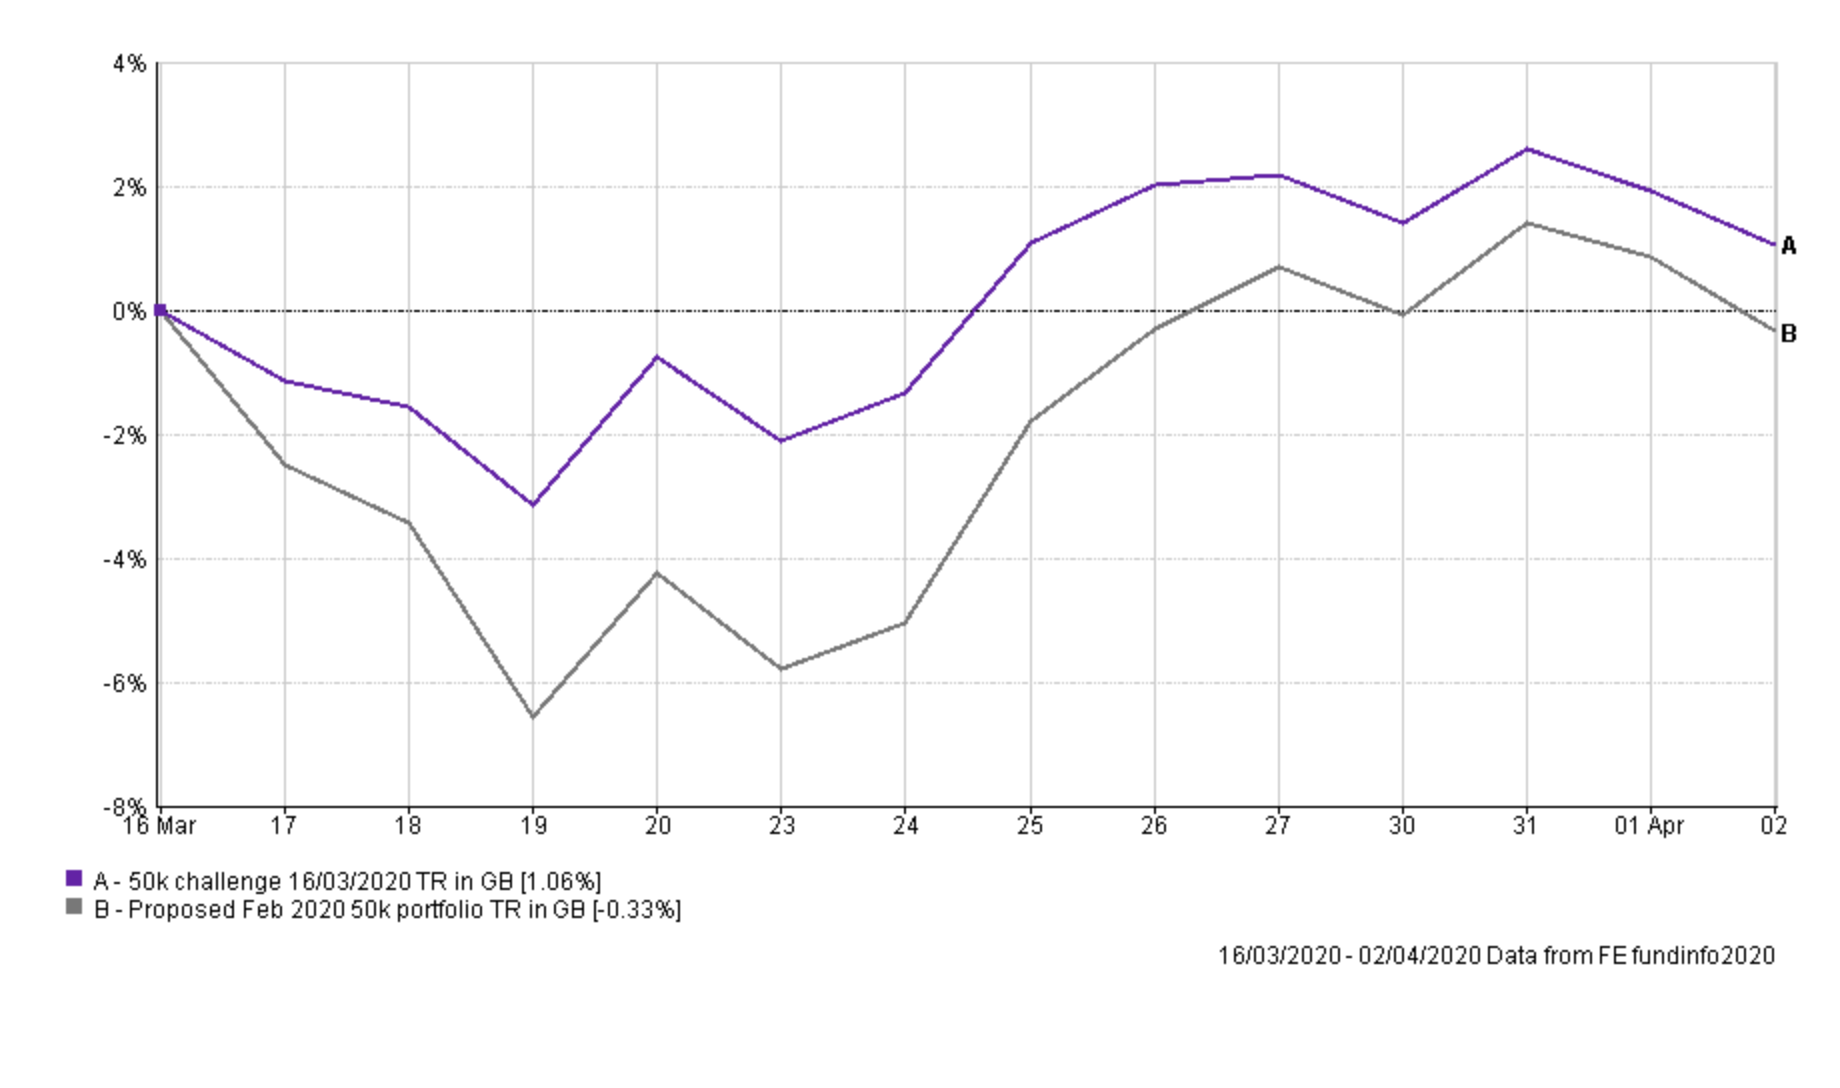
Last month I reduced my equity exposure marginally and sold my low-risk holdings as they were proving a drag on my portfolio. In this period of economic uncertainty, commercial property and rents are now vulnerable (which impacts REITs) and the number of corporate loan defaults are rising (which is bad for corporate bonds).
The move was positive for the portfolio as the chart below demonstrates, which shows my portfolio performance (the purple line) versus the portfolio had I made no changes (the grey line).
With the market now making an extraordinary attempt to rally some analysts think that we are out of the woods. It remains far too early to say. However, unprecedented levels (or at least promises) of fiscal and monetary stimulus have seen bond markets start to stabilise and volatility drop.
As is the tradition in these portfolio reviews, the table below shows which funds within my portfolio are in the current BOTB or BFBS tables and which are not. Those funds in green are still in the BOTB while those in yellow are not in the BOTB but remain in the BFBS list. Meanwhile, any funds in red have dropped out of both shortlists.
| Name | Allocation % (rounded) | Risk | Sector | ISIN Code |
| Fidelity European | 4.5 | Medium | Europe Excluding UK | GB00BFRT3504 |
| Jupiter Japan Income | 5.5 | High | Japan | GB00B0HZTZ55 |
| M&G Global Listed Infrastructure | 7 | Medium | Global | GB00BF00R928 |
| Slater Growth | 9 | Medium | UK All Companies | GB00B0706C66 |
| VT Gravis Clean Energy Income | 14.5 | Medium | Global | GB00BFN4H792 |
| ASI UK Real Estate Share | 5.5 | High | Property Other |
GB00B0XWNN66
|
| Premier Diversified Growth | 9 | Medium | Mixed Investment 40-85% Shares | GB00B8BJV423 |
| Royal London UK Government Bond | 6 | Medium | UK Gilts | GB00B881TW52 |
| Cash | 39 | Low |
The fact that pretty much every fund in my portfolio has fallen out of the 80-20 Investor tables is not surprising given that 97% of all funds, irrespective of the assets they invest in, lost money during the current bout of market weakness. In fact, if you look at the BOTB list for April you will see that it is predominantly made up of global bond funds, mostly those investing in Treasuries and exposed to the value of the dollar which has been one of the few havens, as well UK gilt funds, or in other words government bonds (emphasised by the fact that my Royal London UK Government holding is in green). The current extreme environment has not been favourable to any form of equity exposure and corporate bonds have also floundered.
If you look at my recent research piece 'Funds for the pandemic' it is interesting to see that Fidelity European, which I hold, features. So this is another bright spot.
The table below shows how each of my fund holdings has performed since the start of the coronavirus sell-off versus its peer group, by means of a ranking. You can see that most funds have at least performed in line with their peer group average.
| Fund | Sector | Performance % since sell-off began | Position in sector | Total funds in sector |
| Premier Diversified Growth | Mixed Investment 40-85% Shares | -18.7 | 135 | 223 |
| Fidelity European | Europe Excluding UK | -18.89 | 7 | 95 |
| M&G Global Listed Infrastructure | Global | -25.01 | 180 | 206 |
| VT Gravis Clean Energy Income | Global | -16.58 | 23 | 206 |
| Jupiter Japan Income | Japan | -14.34 | 24 | 35 |
| Slater Growth | UK All Companies | -28.43 | 113 | 229 |
| Royal London UK Government Bond | UK Gilts | 3.69 | 22 | 31 |
| ASI UK Real Estate Share | Property Other | -25.57 | 12 | 25 |
Of course with 40% of the portfolio in cash it does limit the potential downside if markets were to continue to fall. However, it doesn't provide any potential positive return if equity markets slump or when bond markets rally. As it stands the portfolio is largely split between equities and cash.
In light of the aforementioned 'funds for the pandemic' research piece and the new BOTB there are areas of the fixed income market that have produced a positive return during this crisis. There are also diversified funds that have exposure to gold, the US dollar and Treasuries that have held up well in the current environment. Obviously, I consider the asset mix of the BOTB when running my portfolio and try to reflect it. The clear message from the BOTB this month is that momentum is with government bonds (i.e high-quality bonds) and not equities. The new BOTB now only has a 27% equity exposure, with the rest made up principally of gilts and global bonds. The equity exposure has removed all trace of the UK, with US equities now being the dominant sector.
I am not going to wholesale change my portfolio as I am happy to ride the market for the long term. However, I have decided to diversify my portfolio and reflect the trends in the BOTB. I have therefore used some of my cash to invest in funds focusing on government bonds in the US and the UK, namely Royal London UK Government Bond (which I already hold) and Allianz Strategic Bond. Both appear in this month's BOTB as well as my pandemic research piece. I have also decided to invest in Troy Asset Management Ltd Trojan Ethical which, again, appears in both the BOTB and the 'funds for the pandemic' research piece. The fund invests in a range of assets including US dollars, treasuries and gold. However, this fund also invests around 40% of its assets in equities. I am not looking to increase my equity exposure so I decided to drip small amounts out of my two worst-performing UK funds as well as the VT Gravis Clean Energy Income. The latter fund has performed comparatively well during the sell-off versus its peers as shown above but I would be more comfortable not having one fund with such a significant influence on my portfolio's performance.
It's important to note that I am not predicting that the market will head lower, it is about risk management. My portfolio's greatest exposure still remains in equities, albeit slightly reduced, but I am now looking to diversify following the recent rally and publication of the latest BOTB.
Fund switches
- 25% out of ASI UK Real Estate Share and 100% into Troy Asset Management Ltd Trojan Ethical
- 25% out of the Slater Growth and 100% into Troy Asset Management Ltd Trojan Ethical
- 25% out of VT Gravis Clean Energy Income and 100% into Troy Asset Management Ltd Trojan Ethical
- 25% out of Cash and 100% into Royal London UK Government Bond
- 25% out of Cash and 100% into Allianz Strategic Bond
My portfolio now looks like this:
| Name | Allocation % (rounded) | Risk | Sector | ISIN Code |
| Fidelity European | 4.5 | Medium | Europe Excluding UK | GB00BFRT3504 |
| Jupiter Japan Income | 6 | High | Japan | GB00B0HZTZ55 |
| M&G Global Listed Infrastructure | 6.5 | Medium | Global | GB00BF00R928 |
| Slater Growth | 6.5 | Medium | UK All Companies | GB00B0706C66 |
| VT Gravis Clean Energy Income | 10.5 | Medium | Global | GB00BFN4H792 |
| ASI UK Real Estate Share | 4 | High | Property Other |
GB00B0XWNN66
|
| Premier Diversified Growth | 9 | Medium | Mixed Investment 40-85% Shares | GB00B8BJV423 |
| Royal London UK Government Bond | 16 | Medium | UK Gilts | GB00B881TW52 |
| Allianz Strategic Bond | 10 | Medium | Sterling Strategic Bond | GB00B06T9362 |
| Troy Asset Management Ltd Trojan Ethical | 7 | Low | Flexible Investment | GB00BJP0XX17 |
| Cash | 20 | Low |
My Portfolio asset mix
My portfolio asset mix is as shown below (the previous asset mix is in brackets) with approximately 46% invested in equities:
-
- UK Equities 10% (17%)
- North American Equities 11% (11%)
- Global Fixed Interest 13% (0%)
- Japanese Equities 6% (5%)
- European Equities 9% (9%)
- UK Fixed Interest 0% (0%)
- UK Gilt 15% (5%)
- Cash 22% (39%)
- Alternative Investment Strategies 4% (3%)
- Emerging Market Fixed Interest 0% (0%)
- Commodities and energy 6% (6%)
- Property 4% (5%)
Damien's higher risk and lower risk portfolios
Using the logic described in my post: Update to Damien’s alternative risk portfolios I created hypothetical higher and lower risk versions of my portfolio below:
Higher risk
| Fund | Allocation |
| Fidelity European | 6.2 |
| Jupiter Japan Income | 8.2 |
| M&G Global Listed Infrastructure | 8.9 |
| Slater Growth | 8.9 |
| VT Gravis Clean Energy Income | 14.4 |
| ASI UK Real Estate Share | 5.5 |
| Premier Diversified Growth | 12.3 |
| Royal London UK Government Bond | 21.9 |
| Allianz Strategic Bond | 13.7 |
Lower risk
| Fund | Allocation |
| Fidelity European | 5.0 |
| M&G Global Listed Infrastructure | 7.2 |
| Slater Growth | 7.2 |
| VT Gravis Clean Energy Income | 11.7 |
| Premier Diversified Growth | 10.0 |
| Royal London UK Government Bond | 17.8 |
| Allianz Strategic Bond | 11.1 |
| Troy Asset Management Ltd Trojan Ethical | 7.8 |
| Cash | 22.2 |

£200 Pension Cashback Offer
Make a qualifying deposit or transfer a pension to our partner Interactive Investor.
- Deposit or transfer a pension of at least £20k and you could earn £200 cashback
- Terms and Fees apply, Capital at risk
- New & Existing customers opening a SIPP
- Offer ends 31st July 2026
Before starting your transfer, check you won't lose any valuable benefits (such as guaranteed annuity rates or a lower protected pension age) and find out what exit fees you might have to pay
