

The background to my portfolio
Back in March 2015 I decided to invest £50,000 of my own money using 80-20 Investor. The purpose was twofold, firstly to show how you can use 80-20 Investor to invest and outperform the market with only a few minutes effort every now and then. Secondly, no other investment commentator, journalist or research provider invests their own money for fear of failing. This is a sorry state of affairs and is precisely why I committed to openly running my own portfolio for 80-20 Investor members to see.
Since then I have periodically changed my portfolio using the fund suggestions provided by the 80-20 Investor algorithm and associated research. I always disclose the changes at the time they are made.
Performance update
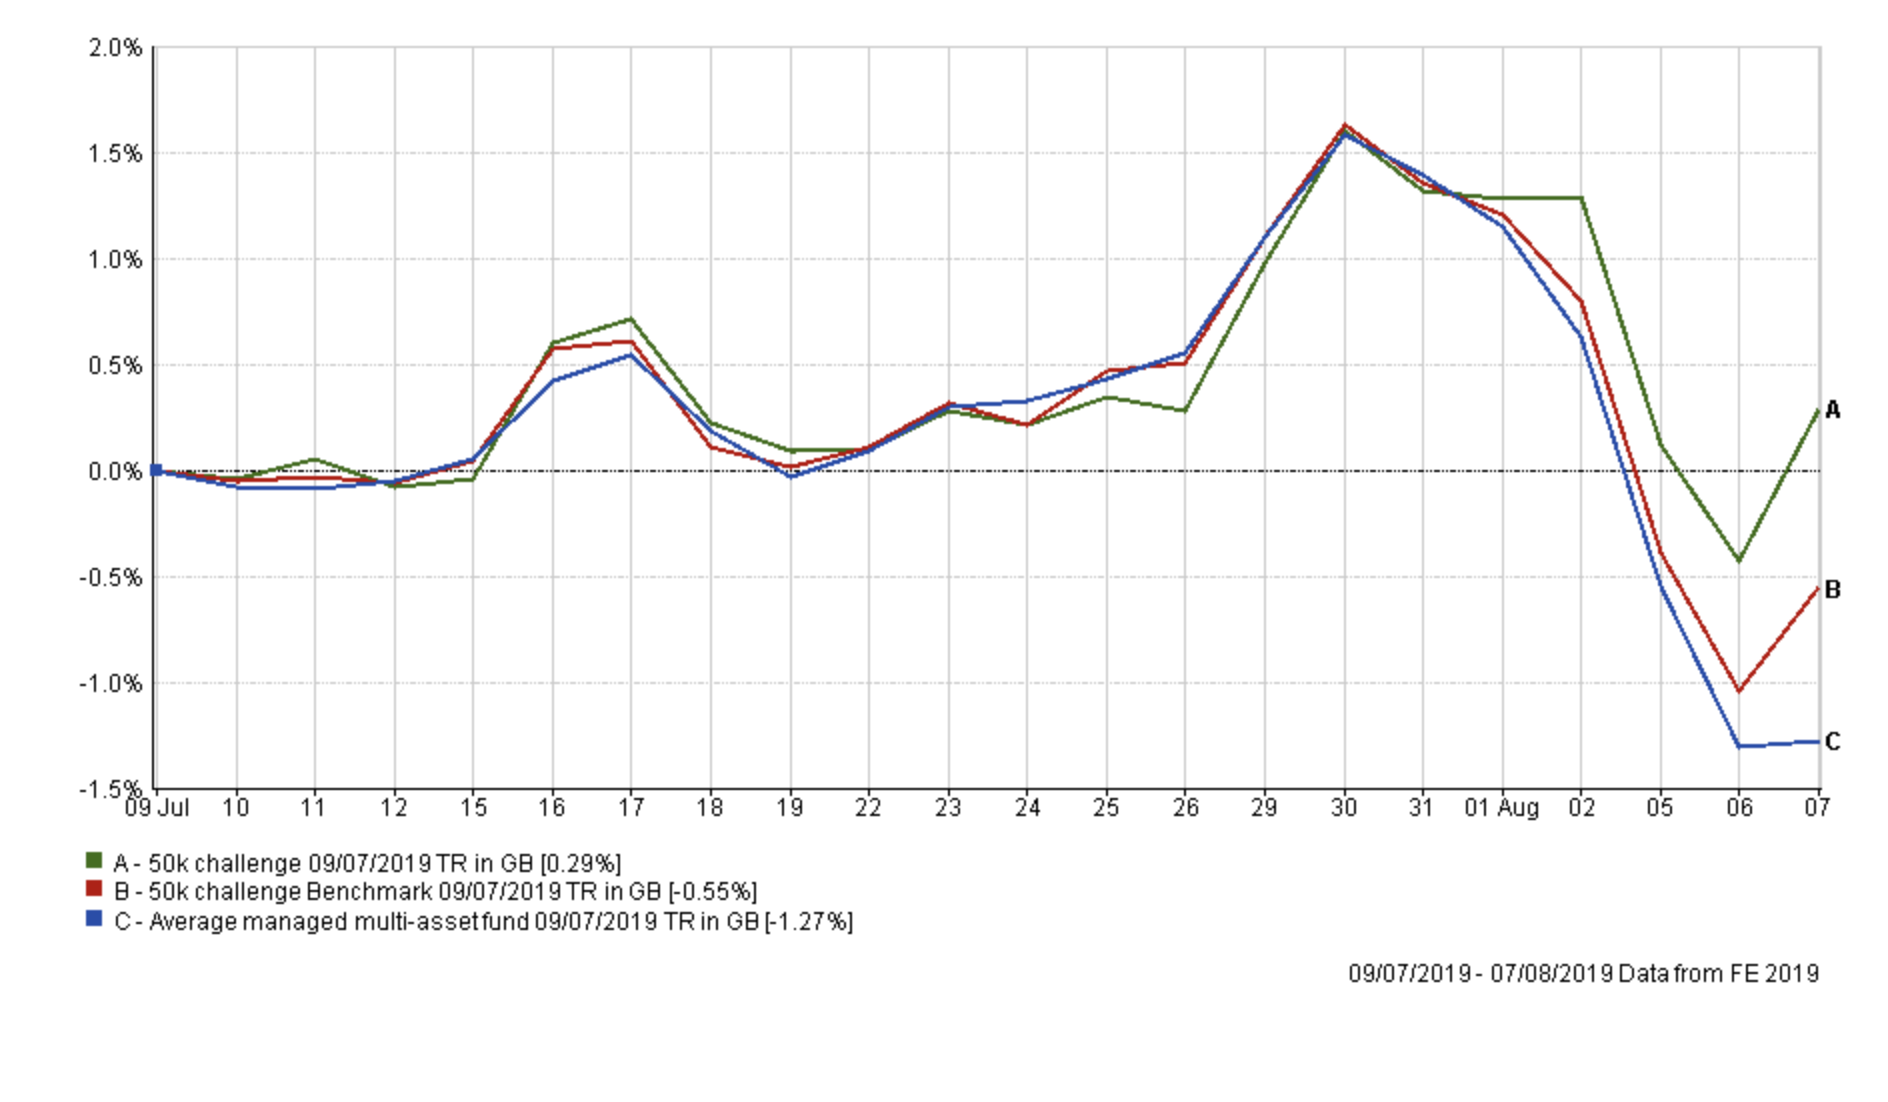
As is usual in my portfolio reviews, the chart below shows how my portfolio has outperformed since I started the challenge in March 2015, four years ago. The green line is the performance of my portfolio while the red line is the benchmark showing the average return achieved by professional fund managers given the same asset mix. To accurately calculate this I have used the average return for each sector in which my portfolio invested. The blue line shows what the average multi-asset fund with comparable equity content achieved. In other words, the red line would show the extra performance added by just the asset mix of my portfolio (where I was invested i.e European equities etc) over picking a typical multi-asset fund (the blue line). While the green line (which is my actual performance) shows the impact of being in the right funds at the right time, as identified by the 80-20 Investor algorithm.

As you can see from the chart above, my portfolio has enjoyed a significant jump in its lead over its benchmarks since my portfolio update a month ago. The chart below shows exactly what happened over the course of the last 30 days. My portfolio captured all of the upside that the benchmarks enjoyed but less of the downside caused by Trump's latest trade war tantrum. In fact my portfolio has made a profit since my last update, despite the stock market sell-off, while the benchmarks have made a loss. To give this some context, over the same period the S&P 500 is down -3.21% and the FTSE 100 is down -4.48%, while European and Asian stocks are down over -5%.
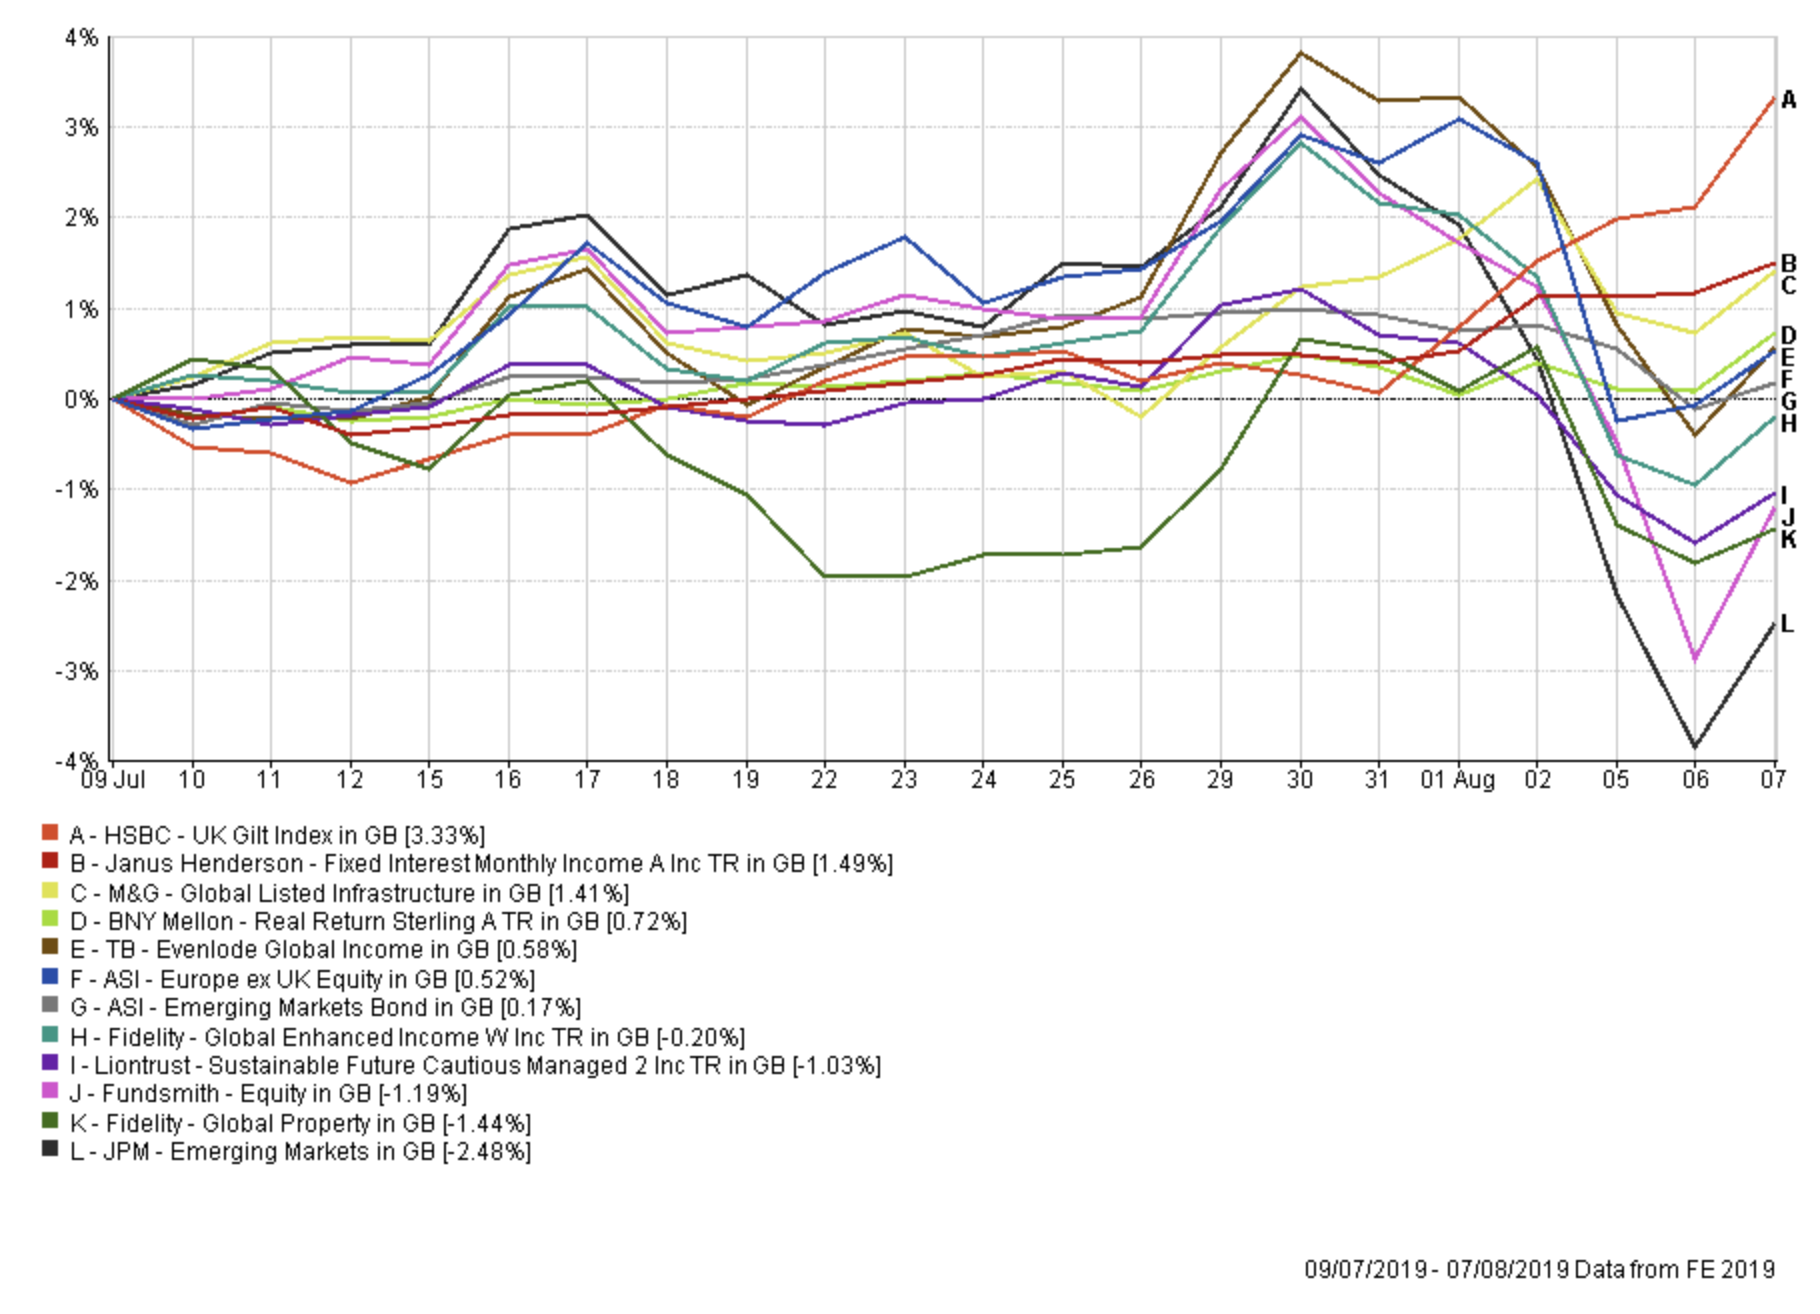
If I drill down further, the (slightly messy) chart below shows how each fund within my portfolio performed during the last month. The key observation is that 53.5% of my portfolio actually made a profit during that period with my gilt/bond exposure, as well as my exposure to M&G Global Infrastructure, posting some impressive gains to counter loses elsewhere.
As I wrote in August's monthly newsletter...
August is ominously starting to feel a lot like May, when Trump last threw a trade war tantrum. During May the S&P 500 tumbled 6.5%, with similar falls in stock markets around the world. It was a month where holding bonds and defensive stocks paid off. Excessive risk was punished.
Therefore during May investing in REITS (think my Fidelity Global Property holding), utilities (think my M&G Global Infrastructure holding) and bonds/gilts paid off. That's why these holdings in my portfolio have performed so well again in the last week.
Once again, avoiding emotional decisions and sticking to a process has proved fruitful, even when that process increased my equity exposure from around 40% to 60% last month. Interestingly the chart below shows how my portfolio (the purple line) fared versus my previous portfolio, assuming that I hadn't made any changes last month (the yellow line). The grey line also shows how my portfolio from May (which only had 40% equity exposure and performed brilliantly during the last Trump trade tantrum) would have performed this month.

It is great to see that despite my current portfolio having a significantly greater equity exposure (around 62%) my portfolio has still managed to preserve capital during the equity sell-off. During my last portfolio review I took a lot of time over back-testing my current portfolio to see how it might have held up during the equity sell-off in May and it's fantastic to see this being borne out in reality during the latest sell-off.
So applying the process as usual, the table below shows my portfolio's current allocation, with those funds in green still in the BOTB while those in yellow are not in the BOTB but remain in the BFBS list. Meanwhile, any funds in red have dropped out of both shortlists.
| Fund | Allocation % | Risk | Sector | ISIN Code |
| Fidelity Global Enhanced Income | 5 | Medium | Global Equity Income | GB00BD1NLJ41 |
| Fidelity Global Property | 12 | High | Property Other | GB00B7K2NZ09 |
| M&G Global Listed Infrastructure | 14 | Medium | Global | GB00BF00R928 |
| HSBC UK Gilt Index | 6 | Low | UK Gilts | GB00B4581C50 |
| Janus Henderson Fixed Interest Monthly Income | 10 | Low | Sterling Strategic Bond | GB0001920486 |
| BNY Mellon Real Return (formerly Newton Real Return) | 11 | Low | Targeted Absolute Return | GB0001642635 |
| Aberdeen Emerging Markets Bond | 9.5 | Low | Global Emerging Markets Bond | GB00B5L9HN22 |
| Liontrust Sustainable Future Cautious Managed | 6 | Medium | Mixed Investment 40-85% Shares | GB00BMN90304 |
| Aberdeen European Equity | 3 | High | Europe Excluding UK | GB00B0LG6P37 |
| Fundsmith Equity | 5 | High | Global | GB00B4Q5X527 |
| JPM Emerging Markets | 6 | High | Global Emerging Markets | GB0030881550 |
| TB Evenlode Global Income | 12.5 | Medium | Global Equity Income | GB00BF1QMV61 |
Only two funds have fallen completely out of the 80-20 Investor tables and are coloured red. All of the others remain within the BOTB or the BFBS tables. As such I wouldn't ordinarily be looking to alter any of the latter funds, especially given the performance of the portfolio in the recent bout of market weakness.
If we consider the two funds in red then both were on my watchlist already. Last month I judged it too soon to ditch the Liontrust Sustainable Future Cautious Managed despite it falling out of the BOTB. As you can see from the chart below the Liontrust fund (green line) has still performed in line with the Mixed Investment 40-85% Shares sector average (the pink line) so it is not a disaster by any stretch.

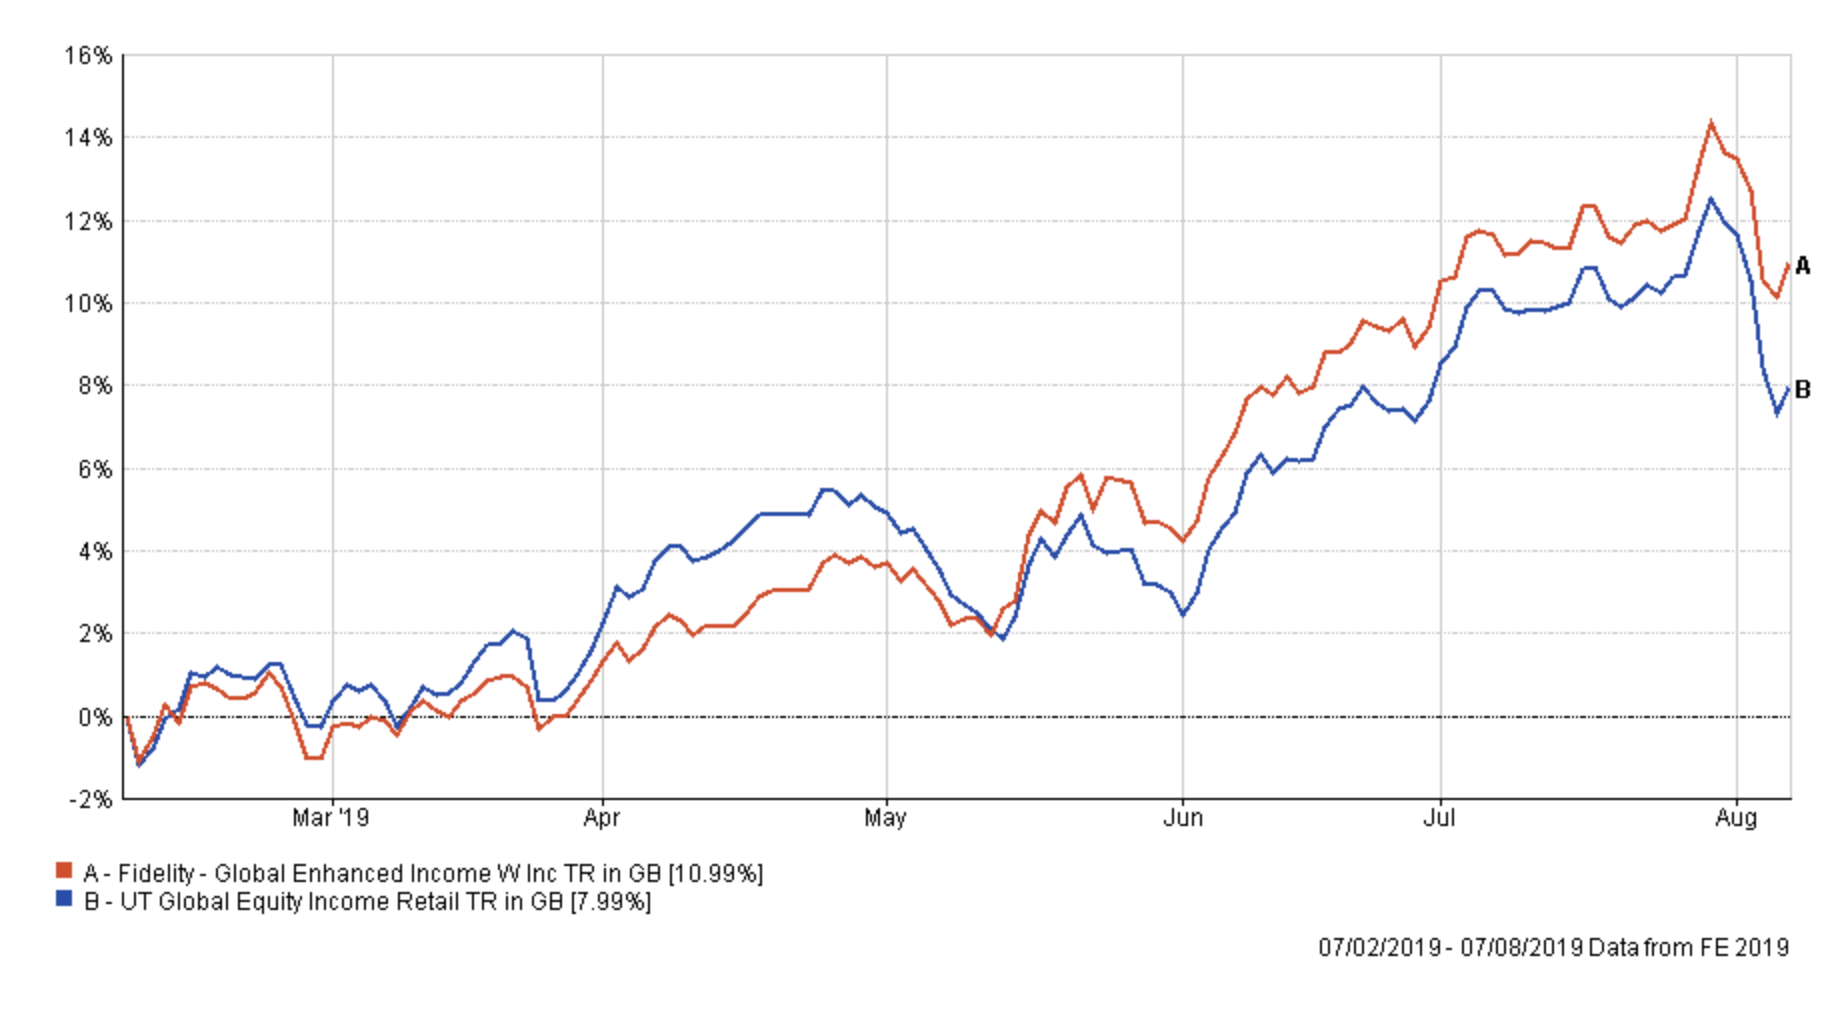
Meanwhile, the Fidelity Global Enhanced Income continues to outperform its peers (the chart below shows the performance since I've held the fund) and it actually made money during May's trade tantrum while its peers, on the whole, lost money.
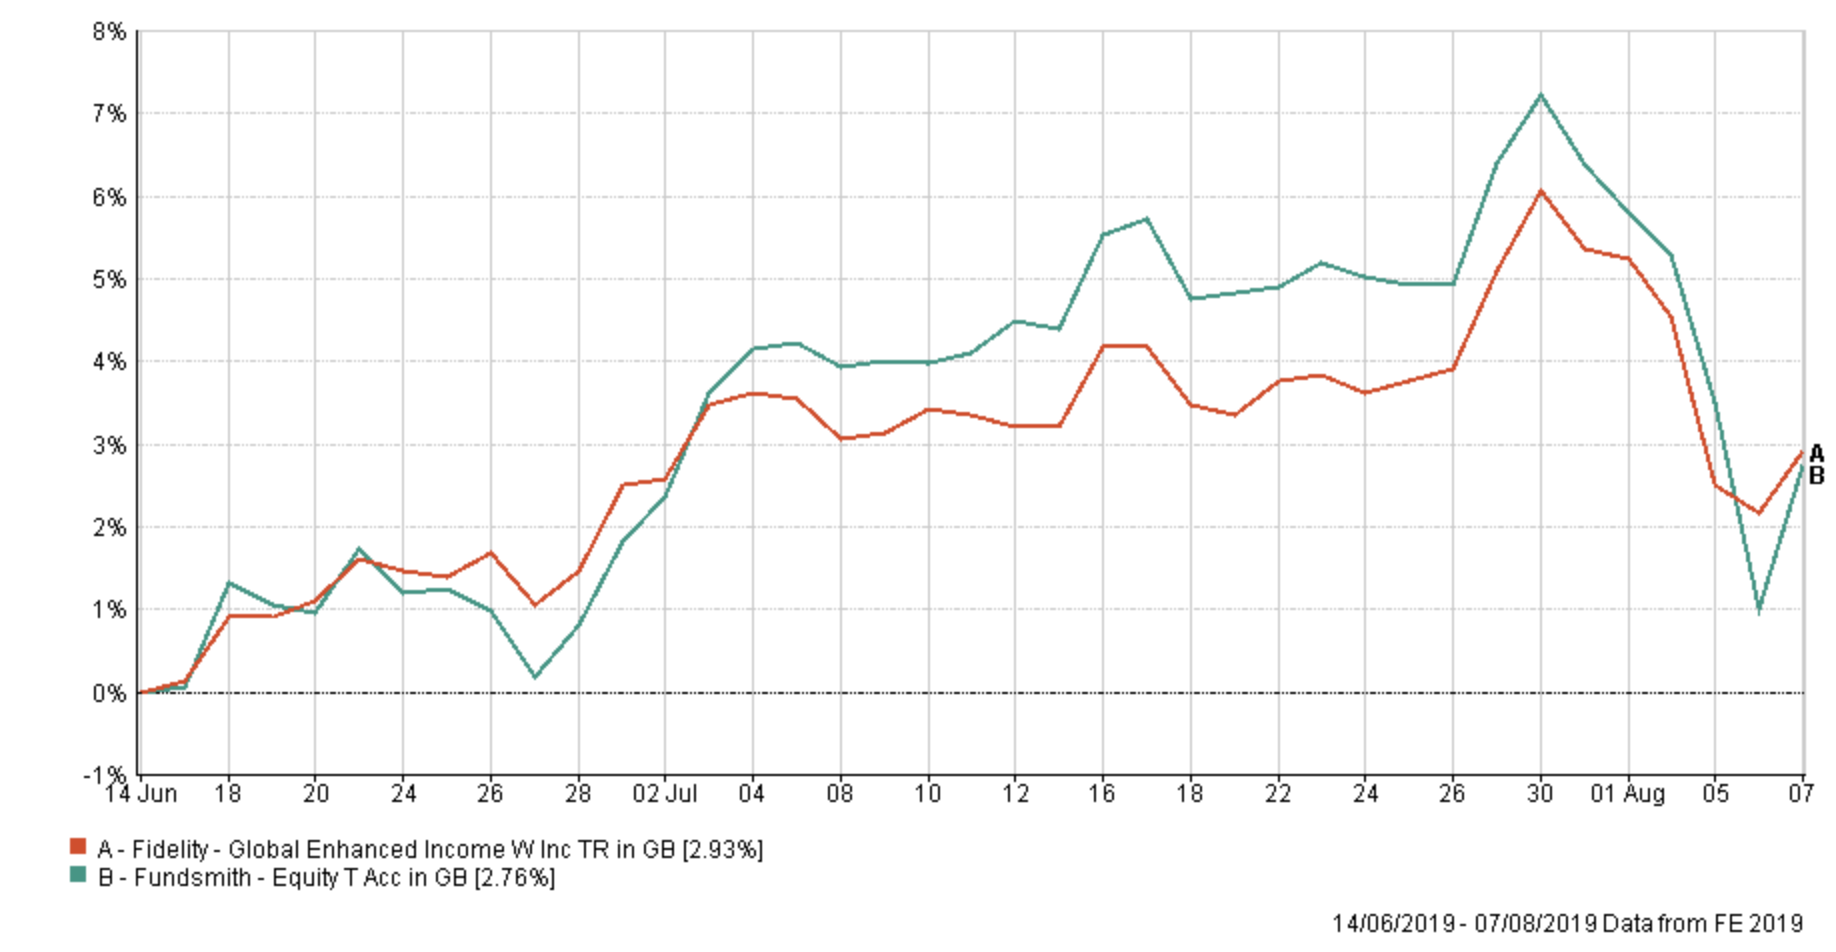
Last time I considered the possible alternatives from the BOTB, namely the Fundsmith Equity fund, and compared their recent performance to that of the Fidelity Global Enhanced Income fund. Interestingly the Fidelity fund has marginally outperformed the Fundsmith Equity fund since my last update, as a result of the latter's technology exposure which has been particularly hit by the renewed trade tensions.
Taking into account the spike in market volatility (in recent days we've experienced some of the worst so far this year) I see no rush to ditch either fund. Particularly if you take into account how the portfolio has performed so far in August. Just like I mentioned in my review in May titled 'The process pays off' there is, of course, the possibility that the market rebounds from here with the defensive part of my portfolio proving a drag on performance. However, with my higher equity exposure, compared to my portfolio in May, this seems less of a risk.
For now I see no reason to change my portfolio until market volatility has died down and a trend established (up or down). Interestingly it does mean that my asset mix differs from the BOTB a little more than usual. The main difference is that the BOTB has removed all Asian and Emerging Market equity exposure instead favouring developed world equities, while my portfolio has around 10% exposure across the two. Also the BOTB does not have any UK Gilt exposure and currently favours UK corporate bonds instead, but these two asset types are similar so I am comfortable with this. Also my portfolio has 12% exposure to property equities, around half of which are in the US and the rest are spread across the globe. The BOTB instead has a higher US equity and global equity exposure (labelled international equities in the breakdown), it's just that the companies invested in are not property companies. Geographically at least the difference is minimal. So overall this means that the equity/bond profile of my portfolio and the BOTB is still similar with the exception of the emerging market/Asian exposure. This is something I will look at once market volatility has subsided and I next review my portfolio.
Remember there is no compulsion to always make changes to a portfolio as shown in my research piece 'The lazy 80-20 Investor – how often should you change funds?', especially when it is performing well.
My portfolio
My portfolio therefore remains:
| Fund | Allocation % | Risk | Sector | ISIN Code |
| Fidelity Global Enhanced Income | 5 | Medium | Global Equity Income | GB00BD1NLJ41 |
| Fidelity Global Property | 12 | High | Property Other | GB00B7K2NZ09 |
| M&G Global Listed Infrastructure | 14 | Medium | Global | GB00BF00R928 |
| HSBC UK Gilt Index | 6 | Low | UK Gilts | GB00B4581C50 |
| Janus Henderson Fixed Interest Monthly Income | 10 | Low | Sterling Strategic Bond | GB0001920486 |
| BNY Mellon Real Return (formerly Newton Real Return) | 11 | Low | Targeted Absolute Return | GB0001642635 |
| Aberdeen Emerging Markets Bond | 9.5 | Low | Global Emerging Markets Bond | GB00B5L9HN22 |
| Liontrust Sustainable Future Cautious Managed | 6 | Medium | Mixed Investment 40-85% Shares | GB00BMN90304 |
| Aberdeen European Equity | 3 | High | Europe Excluding UK | GB00B0LG6P37 |
| Fundsmith Equity | 5 | High | Global | GB00B4Q5X527 |
| JPM Emerging Markets | 6 | High | Global Emerging Markets | GB0030881550 |
| TB Evenlode Global Income | 12.5 | Medium | Global Equity Income | GB00BF1QMV61 |
My asset mix
This means my asset mix is as follows:
-
- UK Equities 9%
- North American Equities 18%
- Global Fixed Interest 9%
- Japanese Equities 0%
- Other International Equities 0%
- Emerging market equities 5%
- European Equities 13%
- UK Fixed Interest 0%
- Cash 4%
- Alternative Investment Strategies 9% (including absolute return)
- Emerging Market Fixed Interest 10%
- Gilts 6%
- Asian equities 5%
- Property 12% - most of which is equities in the US.
Damien's higher risk and low risk portfolios
Using the logic described in my post: Damien’s Higher Risk Portfolio I created higher and lower risk versions of my portfolio by popular demand.
Higher risk
| Fund | Allocation |
| Fidelity Global Enhanced Income | 8 |
| Fidelity Global Property | 19 |
| M&G Global Listed Infrastructure | 22 |
| Liontrust Sustainable Future Cautious Managed | 10 |
| Aberdeen European Equity | 5 |
| Fundsmith Equity | 8 |
| JPM Emerging Markets | 9 |
| TB Evenlode Global Income | 19 |
Lower risk
| Fund | Allocation |
| Fidelity Global Enhanced Income | 7 |
| M&G Global Listed Infrastructure | 19 |
| HSBC UK Gilt Index | 8 |
| Janus Henderson Fixed Interest Monthly Income | 14 |
| BNY Mellon Real Return (formerly Newton Real Return) | 15 |
| Aberdeen Emerging Markets Bond | 13 |
| Liontrust Sustainable Future Cautious Managed | 8 |
| TB Evenlode Global Income | 16 |

£200 Pension Cashback Offer
Make a qualifying deposit or transfer a pension to our partner Interactive Investor.
- Deposit or transfer a pension of at least £20k and you could earn £200 cashback
- Terms and Fees apply, Capital at risk
- New & Existing customers opening a SIPP
- Offer ends 31st July 2026
Before starting your transfer, check you won't lose any valuable benefits (such as guaranteed annuity rates or a lower protected pension age) and find out what exit fees you might have to pay
