

As I mentioned in a previous note I have been waiting to make some wholesale fund switches once market volatility settled down a bit. As it was this didn't really happen so I am going ahead and making a number of switches now following the publication of the latest Best of the Best Selection.
Interestingly it is also one year since I started my £50,000 challenge. If you recall my aim was:
- To invest £50,000 using 80-20 Investor
- To regularly update you with my progress
- To show you how I get the best from 80-20 Investor and the features I use
- To show you how I build a portfolio and...
- How and when I decide to sell funds
At the time I said...
"I am a brave man as I am investing my money right at the point when stock markets are at all time highs. Is that because I think markets are only going upwards? Far from it, if anything they are due a correction. [EDIT: How right I was!]
However, this is a long term project and I expect to be down initially but to outperform the market over the long term. A sensible strategy would be to drip the funds in over time (i.e. put in £10,000 a month) to minimise the impact of a market correction. But as I say I am investing for 10 years plus so am comfortable taking risk and short term falls. Remember it is a paper loss unless I crystallise it."
Now that we have the power of hindsight we can see how the markets tumbled after I started the project, as shown in the chart below (click to enlarge):
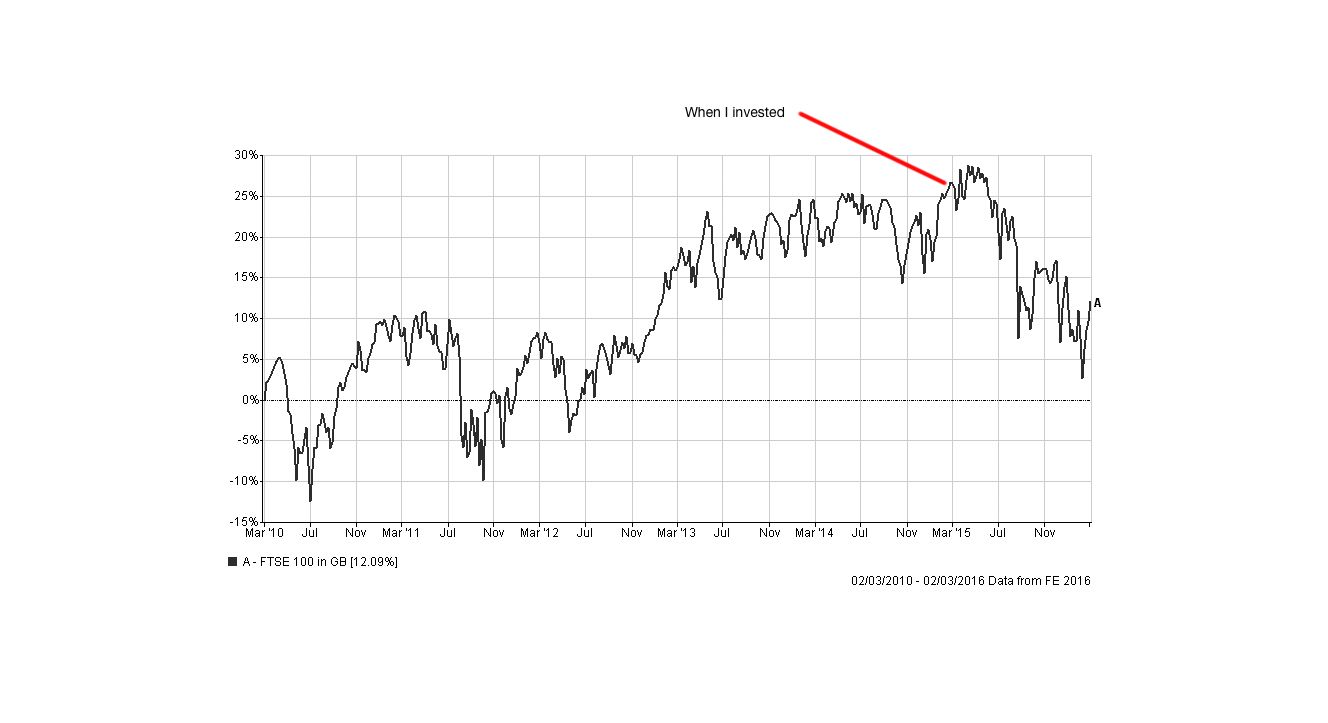
So after a year if you had invested in a FTSE 100 tracker, as is often recommended in the press, you would be down by - 7.82% in terms of total return.
At my last update in mid January you can see how my portfolio was doing in the chart below, which I was pleased with.

In the six weeks that have since passed markets sold off and then we've experienced an epic bounce with many global indices rallying strongly in the last two weeks of February, typically by over 10%.
So how did my £50,000 portfolio fare in the first year? The table below shows the final total return and a few key statistics:
| Name | Total return | Alpha | Max Drawdown | Max Gain | Max Loss | Volatility |
| 80-20 portfolio | 1.57% | 4.49 | -8.88 | 5.14 | -3.52 | 8.16 |
| 50k challenge | -1.99% | 2.33 | -11.86 | 5.61 | -4.32 | 9.17 |
| Passive Vanguard benchmark | -2.66% | 1.25 | -12.11 | 5.32 | -5.3 | 11.17 |
| Average fund manager | -4.84% | -3.09 | -12.15 | 4.42 | -4.64 | 8.19 |
| FTSE 100 | -7.82% | 0 | -17.21 | 7.28 | -7.33 | 17.98 |
What you see from the above chart is firstly the stellar performance from the 80-20 Investor portfolio which made a profit in a falling market.
With my £50k portfolio I deliberately pick only a handful of funds (usually around 7) and make fund changes periodically. The reason is that I am trying to demonstrate that even if you use the 80-20 Investor to take a more 'relaxed' approach to investing you could still benefit. You don't have to follow the shortlists religiously.
My portfolio finished down on the year but still ahead of the benchmarks. It's good to see that I'm still ahead of the tracker funds given the 10% equity rally allowed them to close the gap on my portfolio in the last two weeks. Of course when markets fall the opposite will happen and the gap we saw in January will likely remerge.
You will recall that after just two weeks of starting the experiment I made back the cost of an 80-20 Investor subscription and I advised you at the time that had I been a normal 80-20 Investor I would have taken the profit to cover the two year membership, so effectively making my 80-20 Investor membership free for two years.
Setting that aside in my first year:
- I outperformed the typical fund managers
- I outperformed the passive vanguard portfolio
- I outperformed the market
- I did so with less volatility than all the others and with smaller drawdowns
- And my alpha figure (which shows the value your decisions add vs the market) is good
Also the outperformance of my portfolio over the others exceeds the cost of a biennial 80-20 Investor membership. To achieve all that when I invested at the top of the market is not bad at all. Obviously I would prefer to not be sitting on a paper loss but I look forward to the next market upswing as that is where we will reap the benefits. 80-20 Investor is all about the warts and all and not sugar coating things. The first year is largely here nor there as it is over the long term that we will see the greatest benefit. On that note it has been great to hear from those of you who have outperformed my portfolio over the last year and are sitting in profit. I will share one or two of these stories with you in the coming weeks.
Going forward I will look to be a bit more disciplined with the timings of my portfolio changes and obviously try and track the 80-20 Investor portfolio more. Up until October 2015 my £50k portfolio and the 80-20 Investor portfolio moved in tandem. However, I allowed things to drift as we headed in to the New Year with a greater exposure to European and UK equities which held back my returns.
Latest portfolio changes:
As I've mentioned, over the past few months the asset allocation of my portfolio has drifted away from that of the 80-20 Investor portfolio and as such it hasn't enjoyed as much of the upside. Previously you may recall that I warned against making wholesale changes to the portfolio as you can get caught should the market rally while the trades are actioned (as I did back in October).
However my portfolio became far more exposed to European and UK equities than the 80-20 Portfolio. While this may prove beneficial should the European Central Bank unveil more quantitative easing this week, there's no guarantee that they will. On the flip side the impending UK EU referendum could be bad for UK equities European equities. So I am happy to limit any potential damage and move my asset allocation back in line with the 80-20 Investor Portfolio's.
Below I list my current portfolio, the fund switches which I've made and the new portfolio. I have deliberately kept the number of funds down to 10 (although that is the highest number I've held to date). You will also see that there has been a move away from hedged currency exposure (such as the Artemis Pan-European Absolute Return fund) to unhedged exposure. The new Japanese fund in my portfolio has an unhedged as well as a hedged version and I've chosen the former.
A big theme in the coming months will be currency exposure. Often it is best to hedge out currency exposure so you only get exposure to the underlying asset and not any currency moves. For example in Japan the main equity indices tend to move in the opposite direction to the strength of the yen. So when the Yen weakens the Japanese stock market rallies because exporters have a strong influence on the economy. A weaker yen makes their exports cheaper in 'foreigners' eyes and so they will buy more - hence the Japanese stock market tends to rally. The problem is that normally if you have an unhedged Japanese equities fund then what you make on the stock market you lose on the falling currency. Think about it..... lets say you bought 100 yen's worth of Japanese equities by converting your english pounds in yen. Now lets say the value of those shares in yen terms remained the same but the yen fell against the pound. When you sell your 100 yen's worth of shares and convert the proceeds back into pounds you will lose money as your yen will buy less pounds. So even if your shares go up in value in yen terms, if the currency depreciates more quickly you will still make a loss.
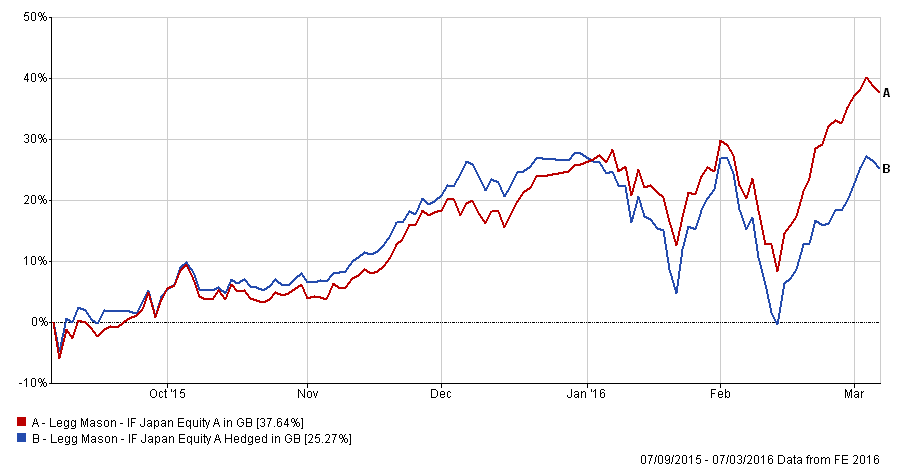
However, the impending UK EU referendum has caused the pound to tumble against most major currencies. Therefore those who had unhedged Japan funds made greater profits. The chart below shows how the unhedged version of the same Japan fund, which I've switched into, has outperformed the hedged version. Obviously this differential won't necessarily always persist and when it's better to hedge once again the 80-20 Investor algorithm will pick this up.
Looking at my new portfolio you will notice that there is also a move out of the riskier high yield bonds and into global bonds which again can benefit from a currency kicker. Alongside the re-introduction of Japanese equities into my portfolio there is a focus on the few absolute return funds that have genuinely provided downside protection when markets have tumbled.
A couple of funds have remained, most notably Fundsmith Equity and Vanguard LifeStrategy 20% Equity. I have in fact increased their share of my portfolio, essentially backing my winners which is usually a good move.
Old portfolio
| Fund | % allocation |
| Aberdeen European High Yield Bond | 17.18% |
| Aberdeen Property Trust | 4.82% |
| Artemis Pan-European Absolute Return Hedged | 5.06% |
| Fundsmith Equity Fund | 11.34% |
| JPM UK Smaller Companies | 15.21% |
| Jupiter European Fund | 16.95% |
| Rathbone Global Opportunities | 17.87% |
| Vanguard LifeStrategy 20% Equity | 11.56% |
Fund switches
| Old fund | % of fund swithced | Fund(s) siwthced into | % of switch proceeds |
| Aberdeen European High Yield Bond I Acc | 100% | Vanguard Lifestrategy 20% Equity | 50% |
| Threadneedle Global Bond | 50% | ||
| Artemis Pan-European Absolute Return Hgd | 100% | Troy Trojan | 100% |
| JPM UK Smaller Companies | 100% | Newton UK Income | 50% |
| Legg Mason Japan Equity | 50% | ||
| Jupiter European | 100% | GLG Continental European Growth | 60% |
| Jupiter Absolute Return | 40% | ||
| Rathbone Global Opportunities | 100% | Fundsmith Equity Fund | 50% |
| Fidelity Global Dividend | 50% |
New portfolio
| Fund | % allocation |
| Fundsmith Equity Fund | 20.27% |
| Fidelity Global Dividend | 8.93% |
| Aberdeen Property Trust | 4.82% |
| Newton UK Income | 7.61% |
| Legg Mason Japan Equity | 7.61% |
| GLG Continental European Growth | 10.17% |
| Jupiter Absolute Return | 6.78% |
| Troy Trojan | 5.06% |
| Threadneedle Global Bond | 8.59% |
| Vanguard Lifestrategy 20% Equity | 20.16% |
This gives an asset allocation of approximately:
- Global fixed interest - 20%
- US equities - 17%
- European equities - 16%
- UK equities - 15%
- Japanese equities - 9%
- Other international equities - 7%
- Cash - 4%
- Property - 4%
- UK Gilts - 4%
- Alternative assets/strategies - 8%
The ISIN codes for the funds in my portfolio are as below:
| Name | ISIN Code |
| Aberdeen - Property Trust | GB00B036Z329 |
| Fidelity - Global Dividend | GB00B7FQHJ97 |
| Fundsmith - Equity | GB00B4LPDJ14 |
| Jupiter - Absolute Return | GB00B5129B32 |
| Legg Mason - IF Japan Equity | GB0033507467 |
| Man GLG - Continental European Growth | GB00B0119370 |
| Newton - UK Income | GB0006779218 |
| Threadneedle - Global Bond | GB0001533685 |
| Troy Asset Management Ltd - Trojan | GB0034243732 |
| Vanguard - LifeStrategy 20% Equity | GB00B4NXY349 |

£200 Pension Cashback Offer
Make a qualifying deposit or transfer a pension to our partner Interactive Investor.
- Deposit or transfer a pension of at least £20k and you could earn £200 cashback
- Terms and Fees apply, Capital at risk
- New & Existing customers opening a SIPP
- Offer ends 31st July 2026
Before starting your transfer, check you won't lose any valuable benefits (such as guaranteed annuity rates or a lower protected pension age) and find out what exit fees you might have to pay
