

The background to my portfolio
Back in March 2015 I decided to invest £50,000 of my own money using 80-20 Investor. The purpose was twofold, firstly to show how you can use 80-20 Investor to invest and outperform the market with only a few minutes effort every now and then. Secondly, no other investment commentator, journalist or research provider invests their own money for fear of failing. This is a sorry state of affairs and is precisely why I committed to openly running my own portfolio for 80-20 Investor members to see.
Since then I have periodically changed my portfolio using the fund suggestions provided by the 80-20 Investor algorithm and associated research. I always disclose the changes at the time they are made.
Performance update
As is usual in my portfolio reviews, the chart below shows how my portfolio has outperformed since I started the challenge in March 2015, which is over seven years ago. The green line is the performance of my portfolio while the red line is the benchmark showing the average return achieved by professional fund managers given the same asset mix. To accurately calculate this I have used the average return for each sector in which my portfolio invested. The blue line shows what the average multi-asset fund with comparable equity content achieved. In other words, the red line would show the extra performance added by just the asset mix of my portfolio (where I was invested i.e European equities etc) over picking a typical multi-asset fund (the blue line). While the green line (which is my actual performance) shows the impact of being in the right funds at the right time, as identified by the 80-20 Investor algorithm.
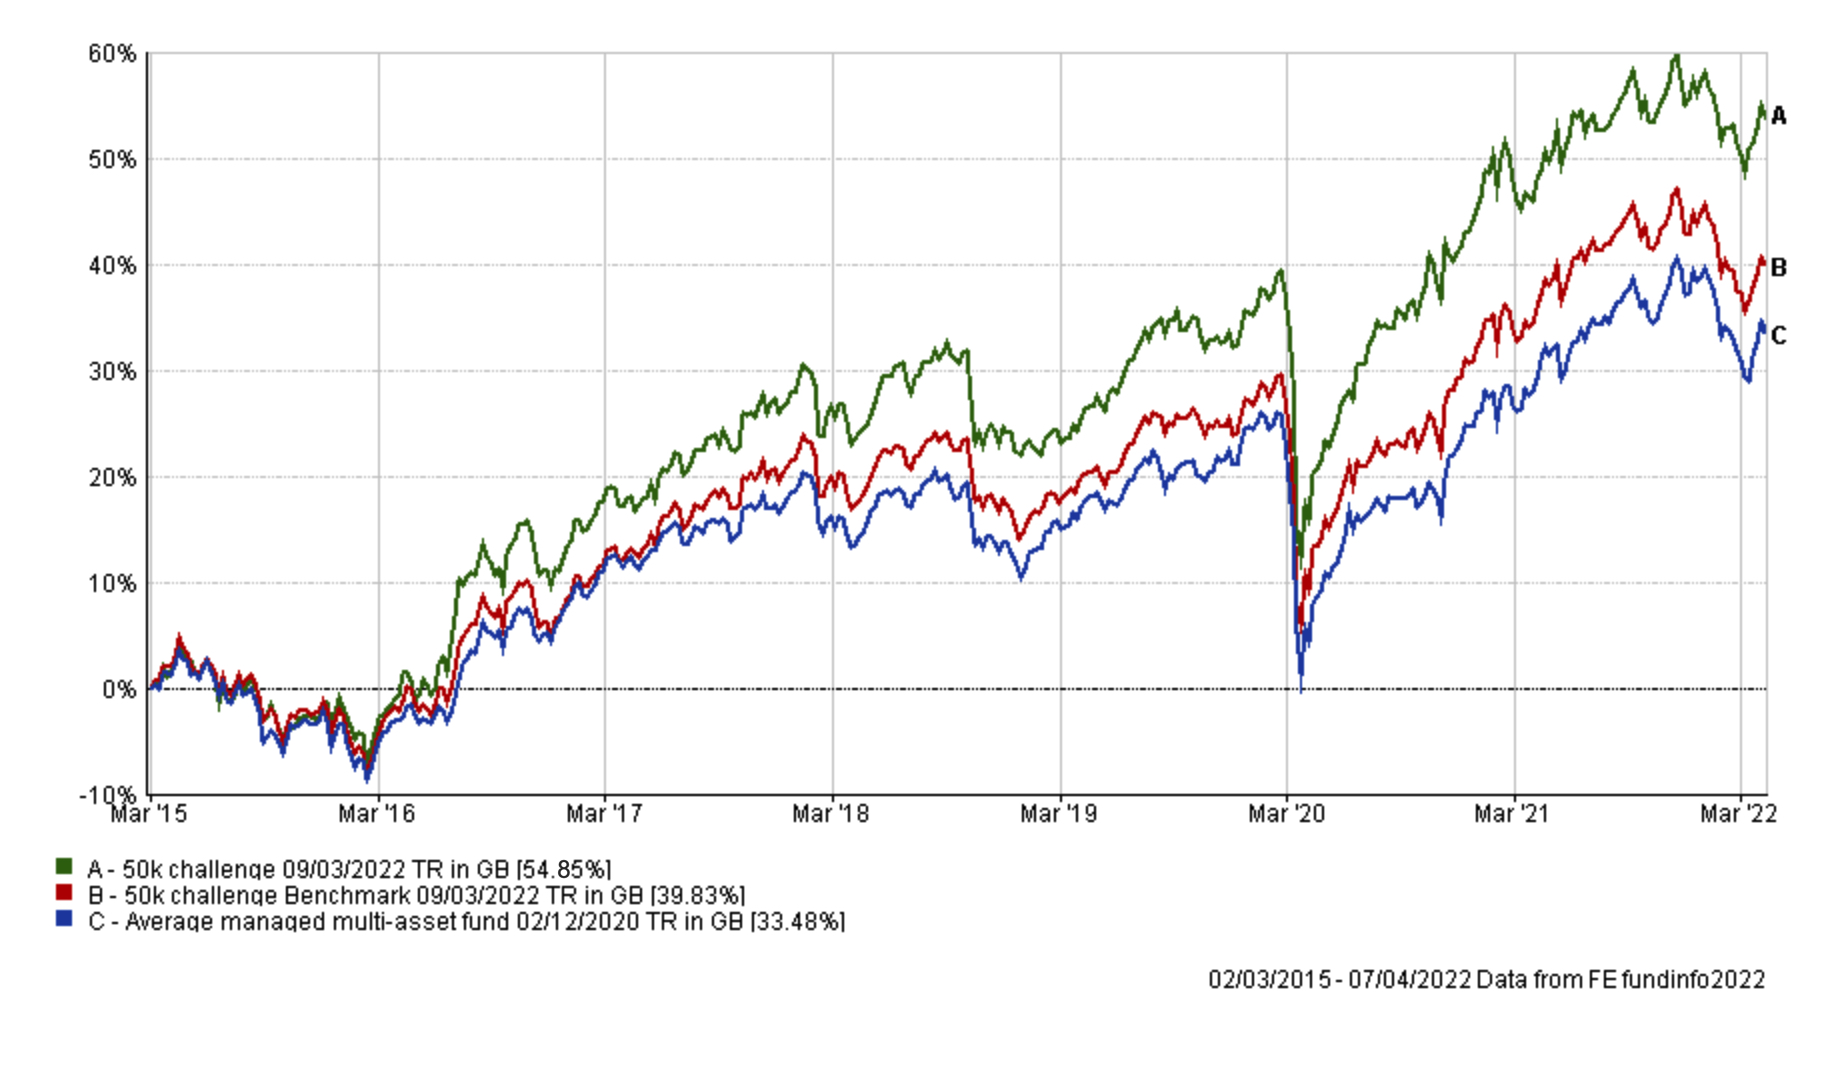
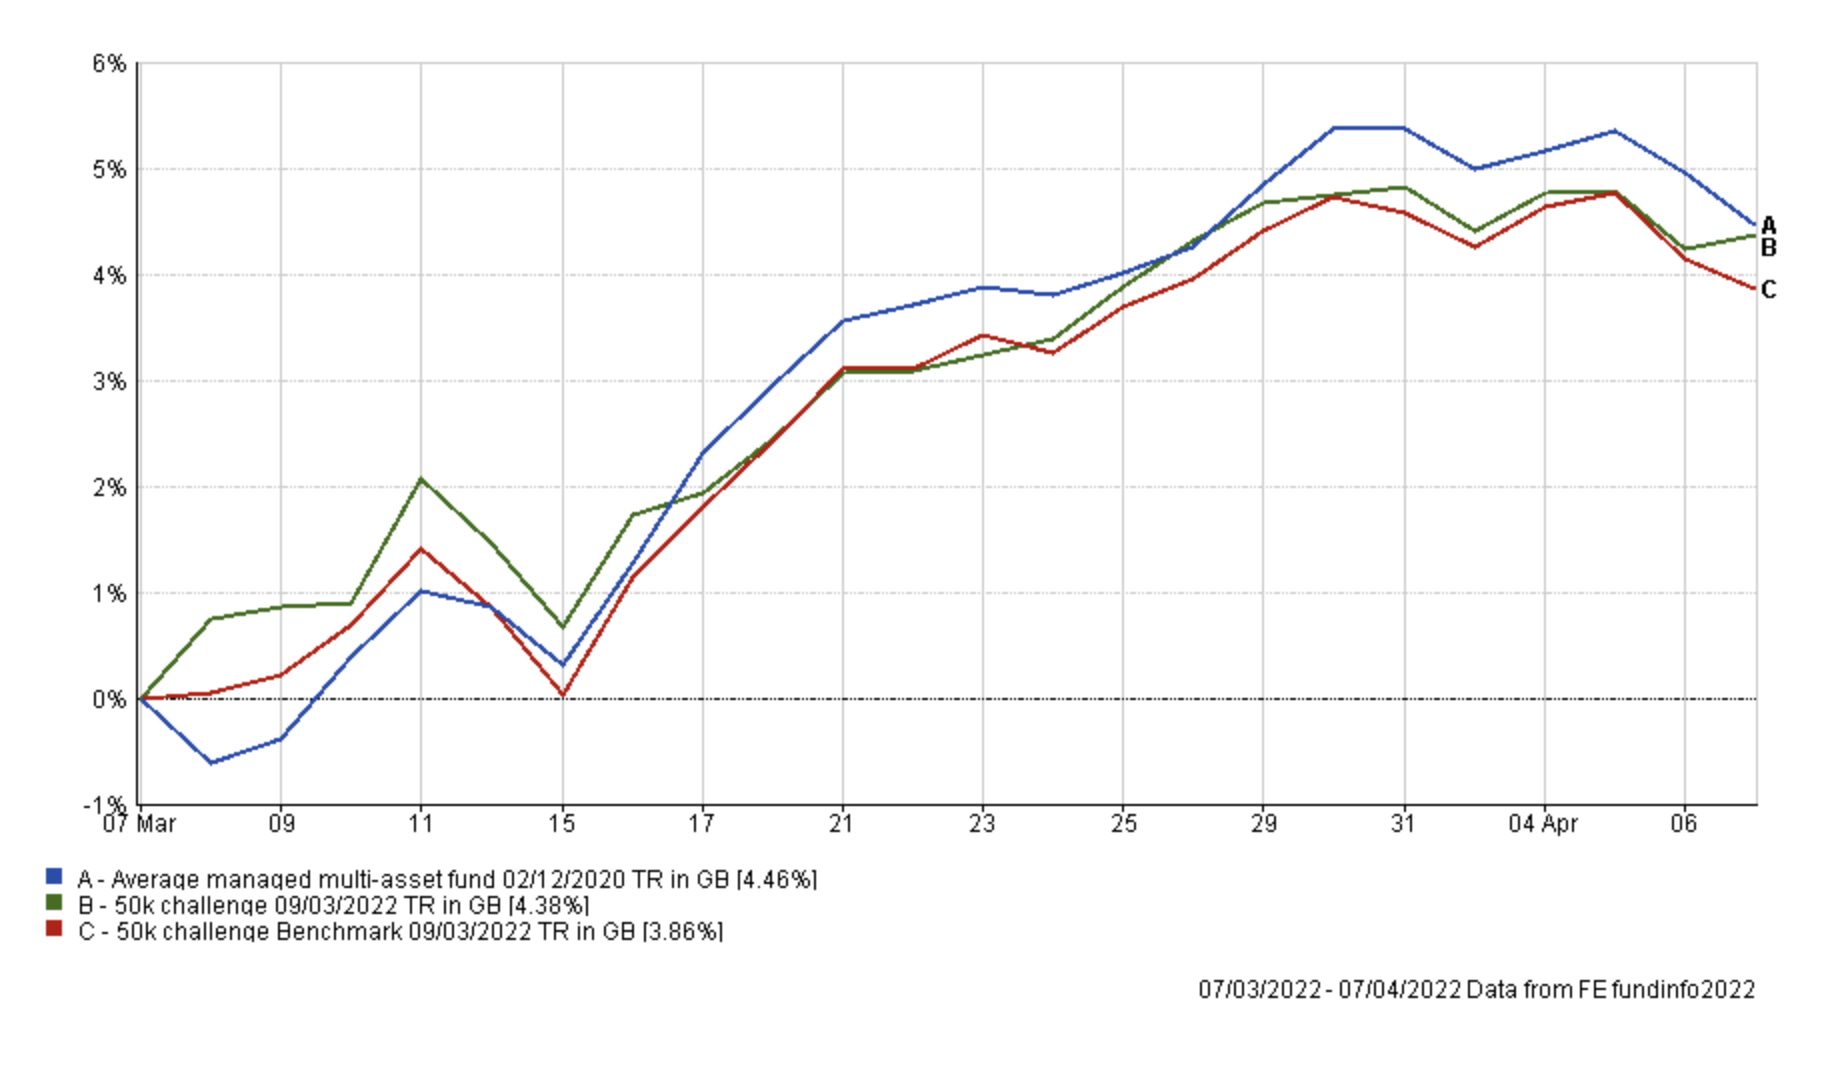
As you can see, during a month where equity markets rebounded strongly it's pleasing to see that my £50k portfolio still extended its lead over its benchmarks despite reducing risk last time. The chart below shows how my portfolio performed versus its benchmarks since my last review, a month ago.
The table below shows the individual performance of each holding in my portfolio since my last review a month ago. As you can see equities were the strongest performers while gold was the weakest performer as stock markets rebounded aggressively.
| Name | % return |
| Invesco UK Opportunities (UK) | 7.75 |
| M&G Global Dividend | 7.2 |
| Fidelity Index US | 6.63 |
| Fidelity Global Property | 6.55 |
| BlackRock Natural Resources Growth & Income | 5.77 |
| Fidelity American Special Situations | 5.2 |
| BM SVS Brooks Macdonald Defensive Capital | 4.59 |
| Premier Miton Defensive Growth | 1.67 |
| Troy Asset Management Ltd Trojan Ethical | 1.43 |
| Invesco High Yield (UK) | 1.09 |
| Thesis TM Tellworth UK Select | 0.66 |
| Cash | 0.04 |
| iShares Physical Gold ETC | -4.92 |
Interestingly the changes last month almost coincided with the equity market low following Russia's invasion of Ukraine. While it is pleasing to see the new addition M&G Global Dividend make a staggering 7.2%, technically had I not made the changes last time my portfolio would have made an additional 2% over the last month thanks to a strong rebound in European equities and UK Smaller Companies funds, which rebounded over 10%.
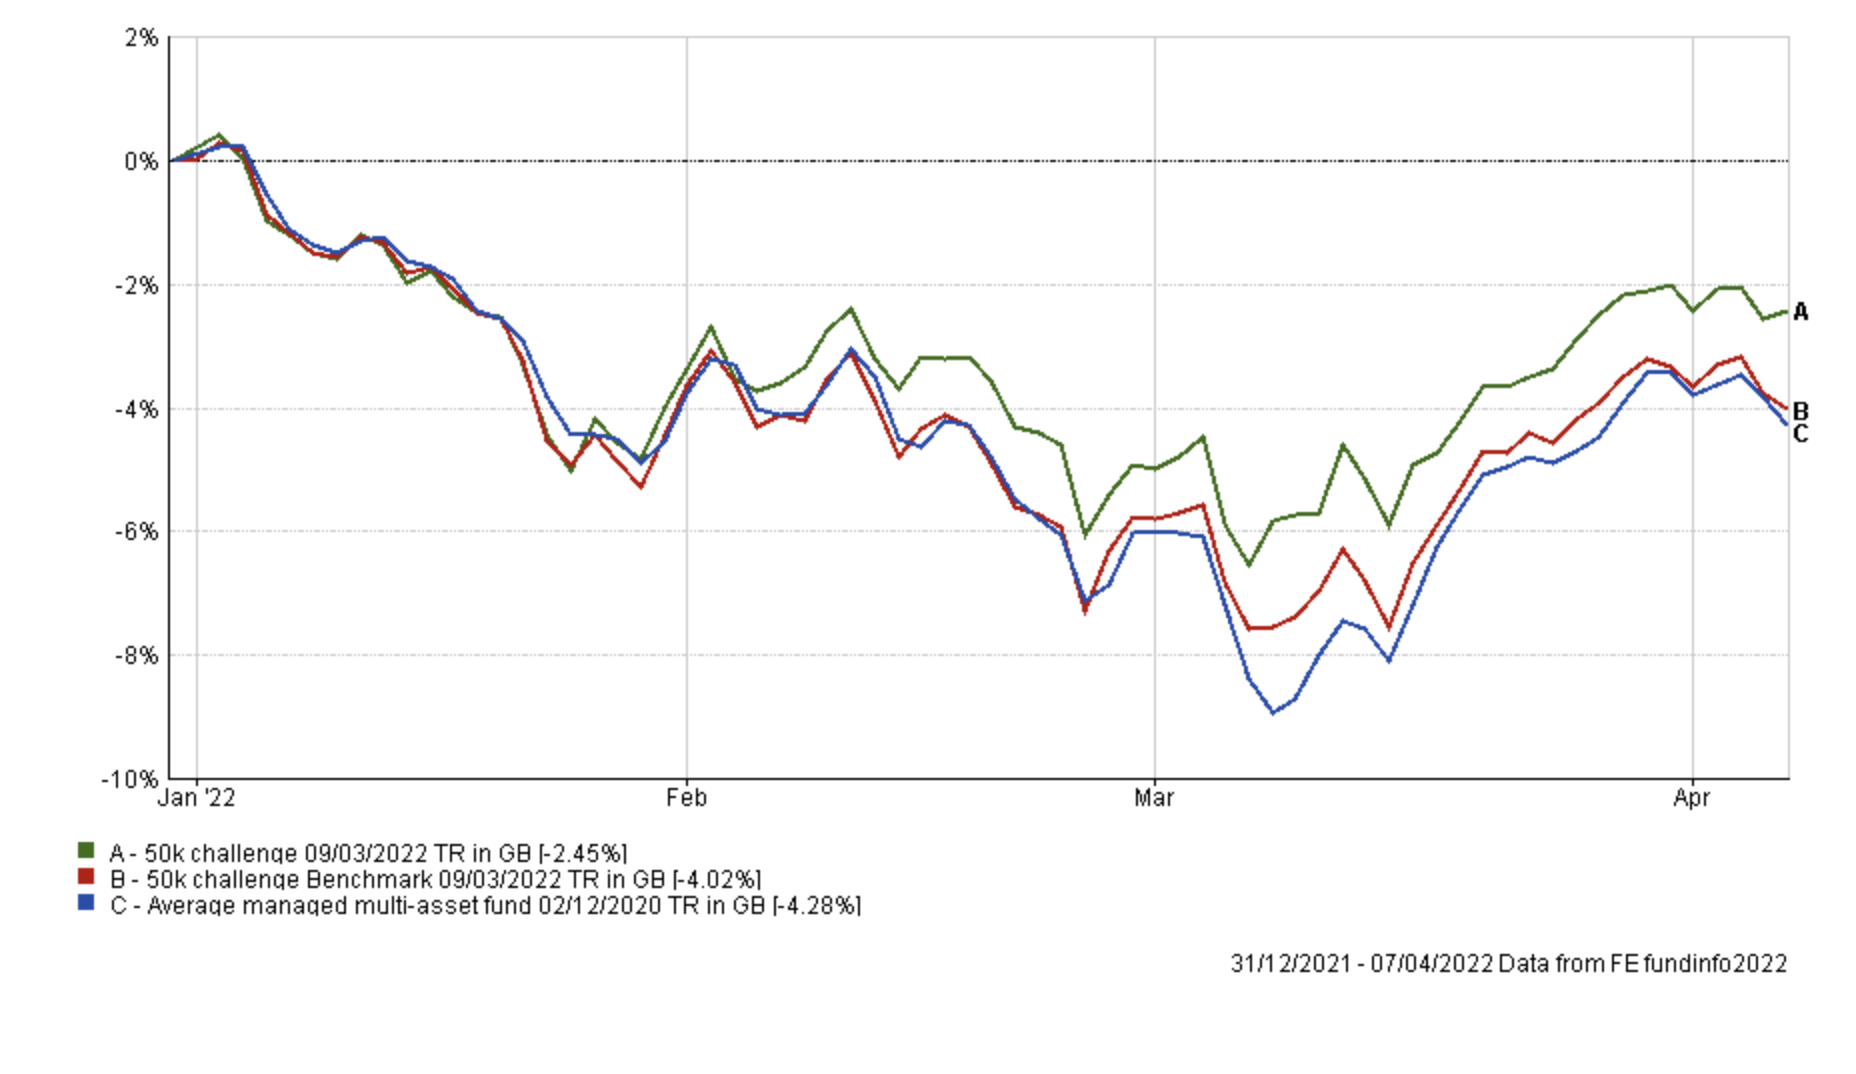
However, hindsight is a wonderful thing and the chart below shows the performance of my portfolio year to date and how it continues to outperform its benchmarks regardless. It has so far managed to benefit from limiting drawdowns while capturing almost all of the market upside. Also its lack of bond exposure has helped the portfolio avoid the worst of the bond market turmoil.
But it's by following a process that I make decisions, and ultimately whether they prove beneficial or not can sometimes only be determined over a longer timeframe. A good demonstration of that was given last month when I showed how I exited the Fidelity Emerging Europe Middle East and Africa fund, taking a small loss on a previous decision to invest more into the fund at the end of 2021. However, after I exited the fund in January it subsequently plummeted over 40% in value and has since subsequently been closed by Fidelity. Of course, I'm not for one second suggesting that the same will happen to the funds I exited last month, but it shows the benefit of following a process longer term.
As usual, the table below shows which funds within my current portfolio are in the current BOTB or BFBS tables and which are not. Those funds in green are still in the BOTB while those in orange are not in the BOTB but remain in the BFBS list. Meanwhile, any funds in red have dropped out of both shortlists.
| Name | Allocation % (rounded) | Risk | Sector | ISIN Code |
| BlackRock Natural Resources Growth & Income | 6.00 | High | Commodity/Natural Resource | GB00B6865B79 |
| BM SVS Brooks Macdonald Defensive Capital | 10.00 | Low | Targeted Absolute Return | GB00B61MR835 |
| Cash | 6 | Low | ||
| Fidelity American Special Situations | 8.00 | Medium | North America | GB00B89ST706 |
| Fidelity Global Property | 5.50 | Medium | Property Other | GB00B7K2NZ09 |
| Fidelity US Index | 11.00 | High | North America | GB00BJS8SH10 |
| Invesco High Yield (UK) | 8.00 | Low | Sterling High Yield | GB00B3RW7649 |
| Invesco UK Opportunities (UK) | 7.00 | Medium | UK All Companies | GB00B1W7HM62 |
| iShares Physical Gold ETC | 5.00 | Medium | Commodity & Energy ETF | IE00B4ND3602 |
| M&G Global Dividend | 8.5 | Medium | Global | GB00B46J9127 |
| Premier Miton Defensive Growth | 12 | Low | Targeted Absolute Return | GB00B832BD89 |
| Thesis TM Tellworth UK Select | 5 | Low | Targeted Absolute Return | GB00BNY7YM73 |
| Troy Asset Management Ltd Trojan Ethical | 8.00 | Medium | Flexible Investment | GB00BJP0XX17 |
As you can see nearly all of the funds are still in the BOTB or BFBS tables. Indeed Fidelity Global Property enjoyed a strong month so by keeping faith with it after it dropped out of both the BOTB and BFBS last month my portfolio has benefited. Currently, there are now only two funds that have fallen outside of the BOTB and BFBS and are highlighted in red above. These are:
- Invesco High Yield (UK)
- Troy Asset Management Ltd Trojan Ethical
Given the performance of the portfolio, and the level of volatility in the market (both bonds and equities) at the moment, I don't want to make radical changes to the portfolio. Indeed as last month reminds us, sometimes if it's not broken perhaps it's best to not to try and always fix things. Such has been the performance of my portfolio while reducing risk, that if it were to reside in the Mixed Investment 40-85% Shares sector of professionally managed funds it would be ranked in the top quartile for Alpha and Sharpe ratios since the portfolio's inception 7 years ago.
Just as a reminder, Alpha is a figure which measures a manager’s apparent skill at picking winning investments versus their benchmark. Alpha is the excess return versus the return of a fund’s benchmark (i.e the market). So a fund with a positive alpha indicates that the fund manager has outperformed through skill. While a negative alpha figure would indicate underperformance.
The Sharpe ratio is not a widely known statistic yet it indicates how much extra return a fund manager has achieved for the increased risk they have taken. There is nothing wrong with fund managers taking calculated investment risks if they result in additional returns for investors. So the higher a fund’s Sharpe ratio the better.
Performing so well for these metrics is pleasing and further confirms that continuing to manage risk and managing the portfolio in the current style is prudent. As such Invesco High Yield will remain in my portfolio but on my watchlist, as it once again sits outside of the 80-20 Investor tables. Having said that it remains one of the best performing high yield bond funds in spite of this. Obviously Troy Trojan Ethical only recently entered my portfolio and while its performance has been lacklustre it's too early to make a decision on it at the moment.
Last time I switched some money temporarily into cash as the number of funds with positive momentum was declining as markets tumbled. However, the situation has begun to improve slightly and as such I'm going to put half of the cash back to work.
Fund switches
The fund switch below brings my portfolio slightly more in line with the BOTB, in terms of total equity exposure and exposure to property. As mentioned in my research article Investing for inflation – Equity funds, REITS can also be a good way to try and inflation-proof your portfolio. So I have decided to redeploy half the cash I have sitting on the sidelines into the Fidelity Global Property fund for this reason. Also by doing so I am backing one of the strongest performing funds within my portfolio in the current environment. `
- 50% out of cash and 100% into Fidelity Global Property
Overall it means that the equity exposure within my portfolio has increased from 59% to around 61%. The changes only affect around 3% of my portfolio.
My portfolio
My portfolio now looks like this:
| Name | Allocation % (rounded) | Risk | Sector | ISIN Code |
| BlackRock Natural Resources Growth & Income | 6% | High | Commodity/Natural Resource | GB00B6865B79 |
| BM SVS Brooks Macdonald Defensive Capital | 10% | Low | Targeted Absolute Return | GB00B61MR835 |
| Cash | 3% | Low | ||
| Fidelity American Special Situations | 8% | Medium | North America | GB00B89ST706 |
| Fidelity Global Property | 8.5% | Medium | Property Other | GB00B7K2NZ09 |
| Fidelity US Index | 11% | High | North America | GB00BJS8SH10 |
| Invesco High Yield (UK) | 7.5% | Low | Sterling High Yield | GB00B3RW7649 |
| Invesco UK Opportunities (UK) | 7.5% | Medium | UK All Companies | GB00B1W7HM62 |
| iShares Physical Gold ETC | 5% | Medium | Commodity & Energy ETF | IE00B4ND3602 |
| M&G Global Dividend | 9% | Medium | Global | GB00B46J9127 |
| Premier Miton Defensive Growth | 11.5% | Low | Targeted Absolute Return | GB00B832BD89 |
| Thesis TM Tellworth UK Select | 5% | Low | Targeted Absolute Return | GB00BNY7YM73 |
| Troy Asset Management Ltd Trojan Ethical | 8% | Medium | Flexible Investment | GB00BJP0XX17 |
My Portfolio asset mix
My portfolio asset mix now has around 61% exposure to equities. Last month's figures are shown in brackets
-
- UK Equities 13% (12%)
- North American Equities 17% (14%)
- Asian/Emerging Market Equities 0% (0%)
- Japanese Equities 0% (0%)
- European Equities 0% (0%)
- Chinese equities 0% (0%)
- Other equity 13% (17%)
- Commodities and energy 15% (15%)
- UK Fixed Interest 0% (0%)
- Global Fixed Interest 11% (11%)
- Cash 3% (6%)
- Alternative Investment Strategies 20% (20%)
- Property 8% (5%)
Damien's higher risk and lower risk portfolios
Using the logic described in my post: Update to Damien’s alternative risk portfolios I created hypothetical higher and lower risk versions of my portfolio below:
Lower risk
| Fund | Allocation % |
| Fidelity American Special Situations | 10 |
| Fidelity Global Property | 10 |
| Invesco High Yield (UK) | 9 |
| Invesco UK Opportunities (UK) | 9 |
| iShares Physical Gold ETC | 6 |
| Premier Miton Defensive Growth | 14 |
| M&G Global Dividend | 11 |
| BM SVS Brooks Macdonald Defensive Capital | 12 |
| Thesis TM Tellworth UK Select | 6 |
| Troy Asset Management Ltd Trojan Ethical | 10 |
| Cash | 3 |
Higher risk
| Fund | Allocation % |
| BlackRock Natural Resources Growth & Income | 10 |
| Fidelity American Special Situations | 13 |
| Fidelity Global Property | 13 |
| Fidelity US Index | 18 |
| Invesco UK Opportunities (UK) | 12 |
| iShares Physical Gold ETC | 8 |
| M&G Global Dividend | 14 |
| Troy Asset Management Ltd Trojan Ethical | 12 |

£200 Pension Cashback Offer
Make a qualifying deposit or transfer a pension to our partner Interactive Investor.
- Deposit or transfer a pension of at least £20k and you could earn £200 cashback
- Terms and Fees apply, Capital at risk
- New & Existing customers opening a SIPP
- Offer ends 31st July 2026
Before starting your transfer, check you won't lose any valuable benefits (such as guaranteed annuity rates or a lower protected pension age) and find out what exit fees you might have to pay
