

The background to my portfolio
Back in March 2015 I decided to invest £50,000 of my own money using 80-20 Investor. The purpose was twofold, firstly to show how you can use 80-20 Investor to invest and outperform the market with only a few minutes effort every now and then. Secondly, no other investment commentator, journalist or research provider invests their own money for fear of failing. This is a sorry state of affairs and is precisely why I committed to openly running my own portfolio for 80-20 Investor members to see.
Since then I have periodically changed my portfolio using the fund suggestions provided by the 80-20 Investor algorithm and associated research. I always disclose the changes at the time they are made.
Performance update
As is usual in my portfolio reviews, the chart below shows how my portfolio has outperformed since I started the challenge in March 2015. The green line is the performance of my portfolio while the red line is the benchmark showing the average return achieved by professional fund managers given the same asset mix. To accurately calculate this I have used the average return for each sector in which my portfolio invested. The blue line shows what the average multi-asset fund with comparable equity content achieved. In other words, the red line would show the extra performance added by just the asset mix of my portfolio (where I was invested i.e European equities etc) over picking a typical multi-asset fund (the blue line). While the green line (which is my actual performance) shows the impact of being in the right funds at the right time, as identified by the 80-20 Investor algorithm.
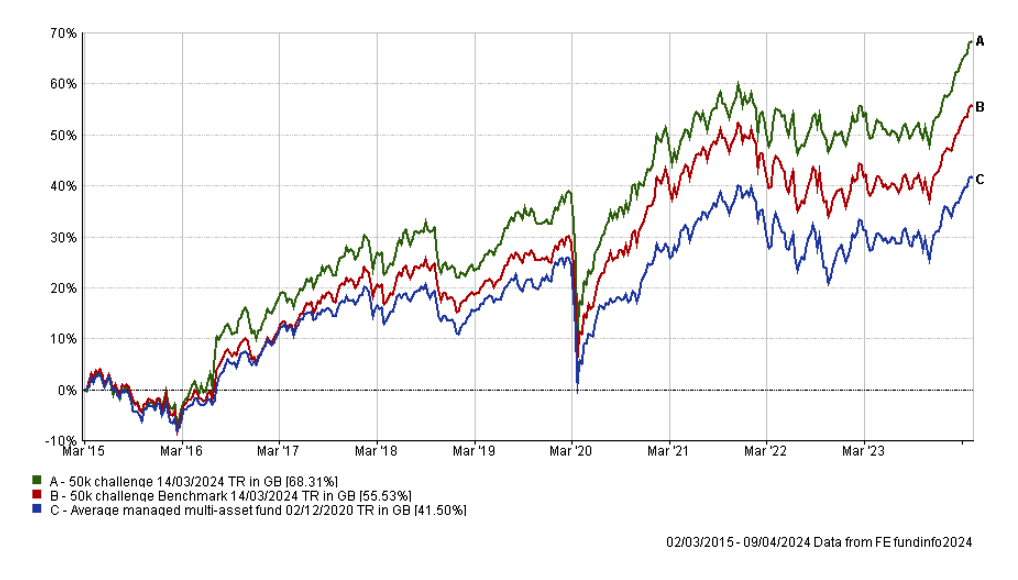
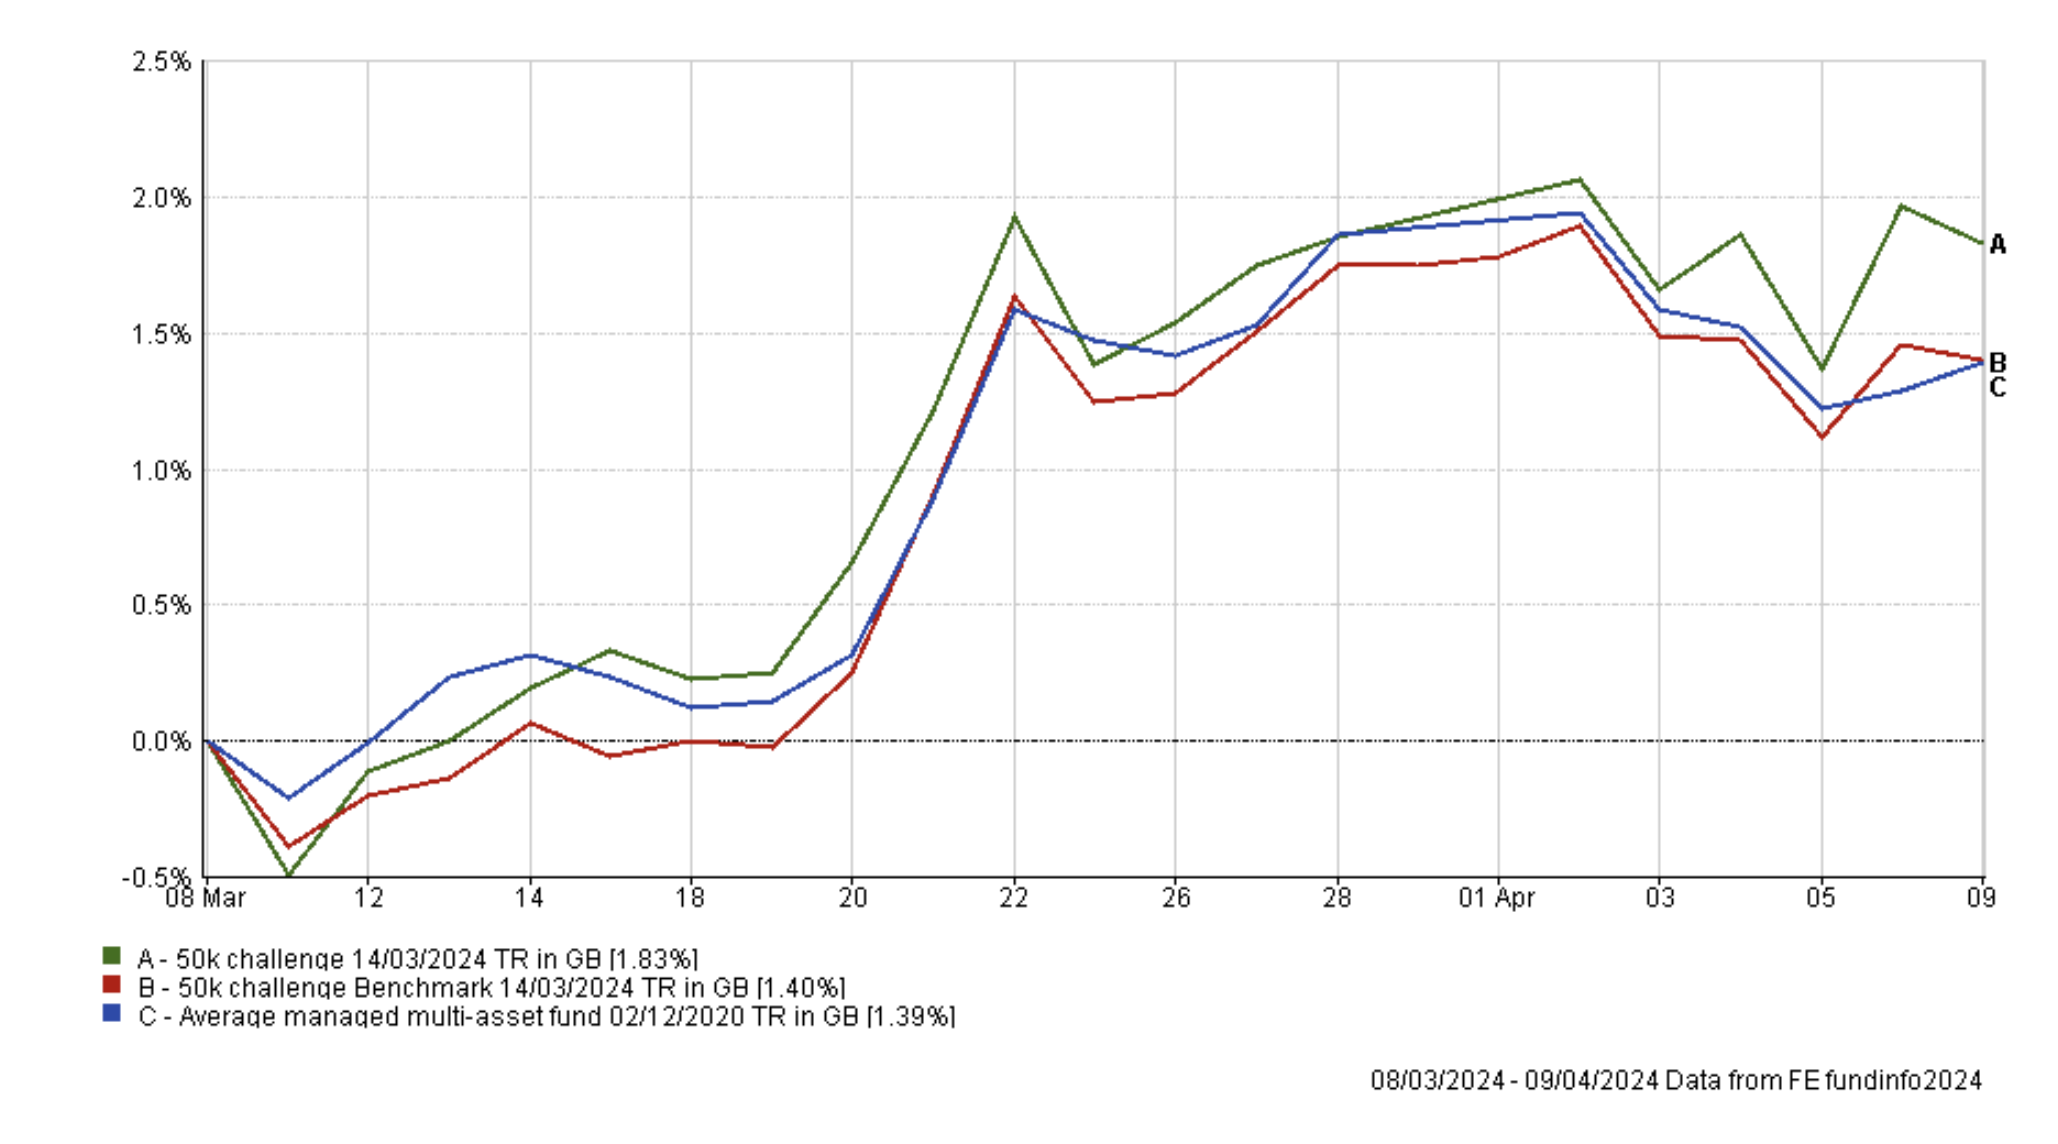
You can see how my portfolio has continued to push towards new all-time highs and has extended its lead over its benchmarks. The chart below shows the outperformance from my portfolio since my last review, a month ago.
My £50,000 portfolio is now worth £84,155 which equates to a profit of 68.31% after 9 years, which is a result I'm proud of. But as I keep reminding you it's not just the profit that is important, so is the management of risk over that time.
Turning my attention to how individual funds have been performing over the last month, the table below shows the performance of the individual funds within my portfolio since my last review. As you can see WS Saracen Global Income and Growth has continued to excel after a turnaround in fortunes during February. However, my gold holding produced a return of over 10% in the last month, which is incredible. This has been a result of investors anticipating interest rate cuts in the US as early as June. It is pleasing to see that only two funds lost money, namely Fidelity Index Japan and abrdn High Yield Bond but both remain in the BOTB following months of strong performance.
| Name | % return over the last month (since March's review) | |
| iShares Physical Gold ETC | 10.27 | |
| WS Saracen Global Income and Growth | 4.57 | |
| Ninety One UK Special Situations | 3.82 | |
| Artemis European Select | 2.36 | |
| T. Rowe Price US Large Cap Growth Equity | 1.93 | |
| Liontrust India | 1.78 | |
| Fidelity American | 1.74 | |
| Troy Asset Management Ltd Trojan Global Equity | 1.57 | |
| BNY Mellon Multi-Asset Balanced | 1.02 | |
| Schroder Strategic Credit | 0.68 | |
| Thesis TM Tellworth UK Select | 0.22 | |
| Fidelity Index Japan | -0.09 | |
| abrdn High Yield Bond | -0.7 |
As usual, the table below shows which funds within my portfolio are in the current BOTB or BFBS tables and which are not. Those funds in blue are still in the BOTB while those in orange are not in the BOTB but remain in the BFBS list. Meanwhile, any funds in red have dropped out of both shortlists.
| Fund | Allocation (%) | Risk | Sector | ISIN |
| abrdn High Yield Bond | 14.5 | Lower | Sterling High Yield | GB00B79RR984 |
| Artemis European Select | 5 | Medium | Europe Excluding UK | GB00B6WFCR53 |
| BNY Mellon Multi-Asset Balanced | 8 | Medium | Mixed Investment 40-85% Shares | GB00B8K9JZ06 |
| Fidelity American | 5 | Medium | North America | GB00B8GPC429 |
| Fidelity Index Japan | 6 | Medium | Japan | GB00BHZK8872 |
| iShares Physical Gold ETC | 5 | Medium | Commodity & Energy ETF | IE00B4ND3602 |
| Liontrust India | 6 | Higher | India/Indian Subcontinent | GB00B1L6DV51 |
| Ninety One UK Special Situations | 5 | Higher | UK All Companies | GB00B1XFJS91 |
| Schroder Strategic Credit | 8 | Lower | Sterling Strategic Bond | GB00BJZ2ZC09 |
| T. Rowe Price US Large Cap Growth Equity | 11 | Higher | North America | GB00BD5FHW12 |
| Thesis TM Tellworth UK Select | 5.5 | Lower | Targeted Absolute Return | GB00BNY7YM73 |
| Troy Asset Management Ltd Trojan Global Equity | 11 | Medium | Global | GB00B0ZJ5S47 |
| WS Saracen Global Income & Growth | 10 | Medium | Global Equity Income | GB00B5B35X02 |
There are five funds that have fallen out of the BOTB and BFBS tables and are coloured in red. They are:
- BNY Mellon Multi-Asset Balanced
- Fidelity American
- Troy Asset Management Ltd Trojan Global Equity
- Thesis TM Tellworth UK Select
- Schroder Strategic Credit
The first three listed were in the 'red' list last month too, while Thesis TM Tellworth UK Select and Schroder Strategic Credit are new additions. However, both of the latter two funds made the BOTB list as recently as last month so I will give them a stay of execution. Furthermore, bond funds as a whole have endured a difficult month, as yields have risen. This is demonstrated by the weak performance of abrdn High Yield Bond over the last month, so the alternative low-risk fund options are not that enticing. I will keep an eye on the performance of both funds going forward to ensure that the recent slump doesn't escalate. This is especially true of the abrdn fund as it is the largest constituent of my portfolio.
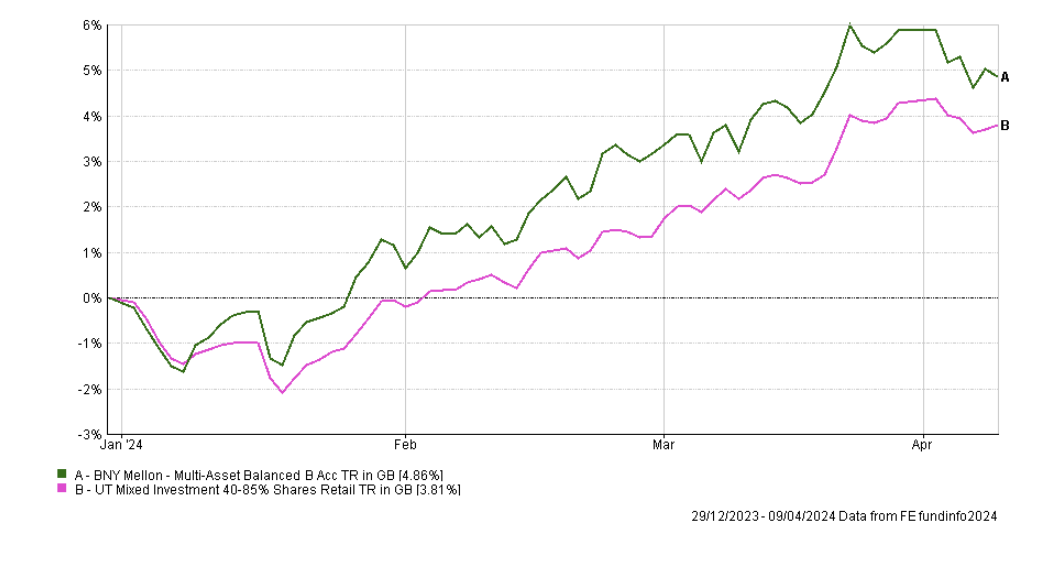
BNY Mellon Multi-Asset Balanced is a fund that has sat at the core of my portfolio since June 2023 and soon after its introduction it appeared in the Consistent funds shortlist. The chart below shows the fund's performance since the start of 2024 versus its peer group average. The fund had been among its sector's top quartile of performers going into March and, following last month's decision to keep it, the fund rallied strongly but dipped as we moved into the start of April. The fund currently accounts for 8% of my portfolio and I will keep an eye on it with a view to potentially replacing it in the future if the recent slump becomes entrenched. However, the overall performance of my portfolio has been strong in recent months so I favour pruning and tweaking the portfolio in stages rather than making large drastic alterations.
That then leaves me with Fidelity American and Troy Asset Management Ltd Trojan Global Equity. Both have made appearances in the red list in recent months, and while they have been steady performers within my portfolio, they have seldom topped my portfolio's monthly performance table. However, it's time for a change. That doesn't mean they have suddenly become bad funds but there are opportunities elsewhere with more momentum. You may recall that back in January I halved my exposure to Fidelity American, so this month I will finally remove it entirely.
But, as I expressed last month, Fidelity American has been a good diversifier within the US equity portion of the portfolio because it is underweight in some of the Magnificent 7 stocks, such as Nvidia. Therefore when choosing alternatives to Fidelity American and Troy Trojan Global Equity I have tried to find funds that wouldn't increase my overall exposure to US tech stocks while not drastically altering my portfolio's asset mix at the same time.
I have therefore chosen to replace the Fidelity American fund with Artemis US Select and switch Trojan Global Equity for Artemis Global Equity income, both of which have been regulars in the BOTB of late. The Artemis Global Equity Income has a lower US equity exposure than many of its peers and limited exposure to the Magnificent 7. It is also much more globally diversified containing emerging market, European, Japanese and UK stocks.
The fund switches will mean that my portfolio has a higher UK equity exposure than the BOTB and a marginally lower US equity exposure than the BOTB but this is something that I will review in the future. My overall equity exposure will increase and will be more in line with that of the BOTB.
Fund switches
The fund switches I plan to make this month are listed below, and affect 15% of my portfolio.
- 100% out of Fidelity American and 100% into Artemis US Select
- 100% out of Troy Asset Management Ltd Trojan Global Equity and 100% into Artemis Global Income
My portfolio
My portfolio now looks like this:
| Fund | Allocation | Risk | Sector | ISIN |
| abrdn High Yield Bond | 14 | Lower | Sterling High Yield | GB00B79RR984 |
| Artemis European Select | 5 | Medium | Europe Excluding UK | GB00B6WFCR53 |
| Artemis Global Income | 11 | Medium | Global Equity Income | GB00B5N99561 |
| Artemis US Select | 5 | Medium | North America | GB00BMMV5105 |
| BNY Mellon Multi-Asset Balanced | 8 | Medium | Mixed Investment 40-85% Shares | GB00B8K9JZ06 |
| Fidelity Index Japan | 5.5 | Medium | Japan | GB00BHZK8872 |
| iShares Physical Gold ETC | 5.5 | Medium | Commodity & Energy ETF | IE00B4ND3602 |
| Liontrust India | 6 | Higher | India/Indian Subcontinent | GB00B1L6DV51 |
| Ninety One UK Special Situations | 5 | Higher | UK All Companies | GB00B1XFJS91 |
| Schroder Strategic Credit | 8 | Lower | Sterling Strategic Bond | GB00BJZ2ZC09 |
| T. Rowe Price US Large Cap Growth Equity | 11 | Higher | North America | GB00BD5FHW12 |
| Thesis TM Tellworth UK Select | 5.5 | Lower | Targeted Absolute Return | GB00BNY7YM73 |
| WS Saracen Global Income & Growth* | 10.5 | Medium | Global Equity Income | GB00B5B35X02 |
My Portfolio asset mix
My portfolio asset mix has approximately 65% exposure to equities. Last month's figures are shown in brackets.
-
- UK Equities 12% (8%)
- North American Equities 25% (24%)
- Asian/Emerging Market Equities 6% (6%)
- Japanese Equities 7% (6%)
- European Equities 13% (11%)
- Chinese equities 0% (0%)
- Other equity 2% (7%)
- Commodities and energy 5% (5%)
- UK Fixed Interest 4% (4%)
- Global Fixed Interest 18% (20%)
- Cash 1% (2%)
- Alternative Investment Strategies 7% (7%)
- Property 0% (0%)
Damien's higher risk and lower risk portfolios
Using the logic described in my post: Update to Damien’s alternative risk portfolios I created hypothetical higher and lower risk versions of my portfolio below:
Lower risk
| Fund | Allocation % |
| abrdn High Yield Bond | 19 |
| Artemis European Select | 6 |
| Artemis Global Income | 14 |
| Artemis US Select | 6 |
| BNY Mellon Multi-Asset Balanced | 10 |
| Fidelity Index Japan | 7 |
| iShares Physical Gold ETC | 7 |
| Schroder Strategic Credit | 11 |
| Thesis TM Tellworth UK Select | 7 |
| WS Saracen Global Income & Growth* | 13 |
Higher risk
| Fund | Allocation % |
| Artemis European Select | 7 |
| Artemis Global Income | 15 |
| Artemis US Select | 7 |
| BNY Mellon Multi-Asset Balanced | 11 |
| Fidelity Index Japan | 8 |
| iShares Physical Gold ETC | 8 |
| Liontrust India | 8 |
| Ninety One UK Special Situations | 7 |
| T. Rowe Price US Large Cap Growth Equity | 15 |
| WS Saracen Global Income & Growth* | 14 |

£200 Pension Cashback Offer
Make a qualifying deposit or transfer a pension to our partner Interactive Investor.
- Deposit or transfer a pension of at least £20k and you could earn £200 cashback
- Terms and Fees apply, Capital at risk
- New & Existing customers opening a SIPP
- Offer ends 31st July 2026
Before starting your transfer, check you won't lose any valuable benefits (such as guaranteed annuity rates or a lower protected pension age) and find out what exit fees you might have to pay
