

The background to my portfolio
Back in March 2015 I decided to invest £50,000 of my own money using 80-20 Investor. The purpose was twofold, firstly to show how you can use 80-20 Investor to invest and outperform the market with only a few minutes effort every now and then. Secondly, no other investment commentator, journalist or research provider invests their own money for fear of failing. This is a sorry state of affairs and is precisely why I committed to openly running my own portfolio for 80-20 Investor members to see.
Since then I have periodically changed my portfolio using the fund suggestions provided by the 80-20 Investor algorithm and associated research. I always disclose the changes at the time they are made.
Performance update
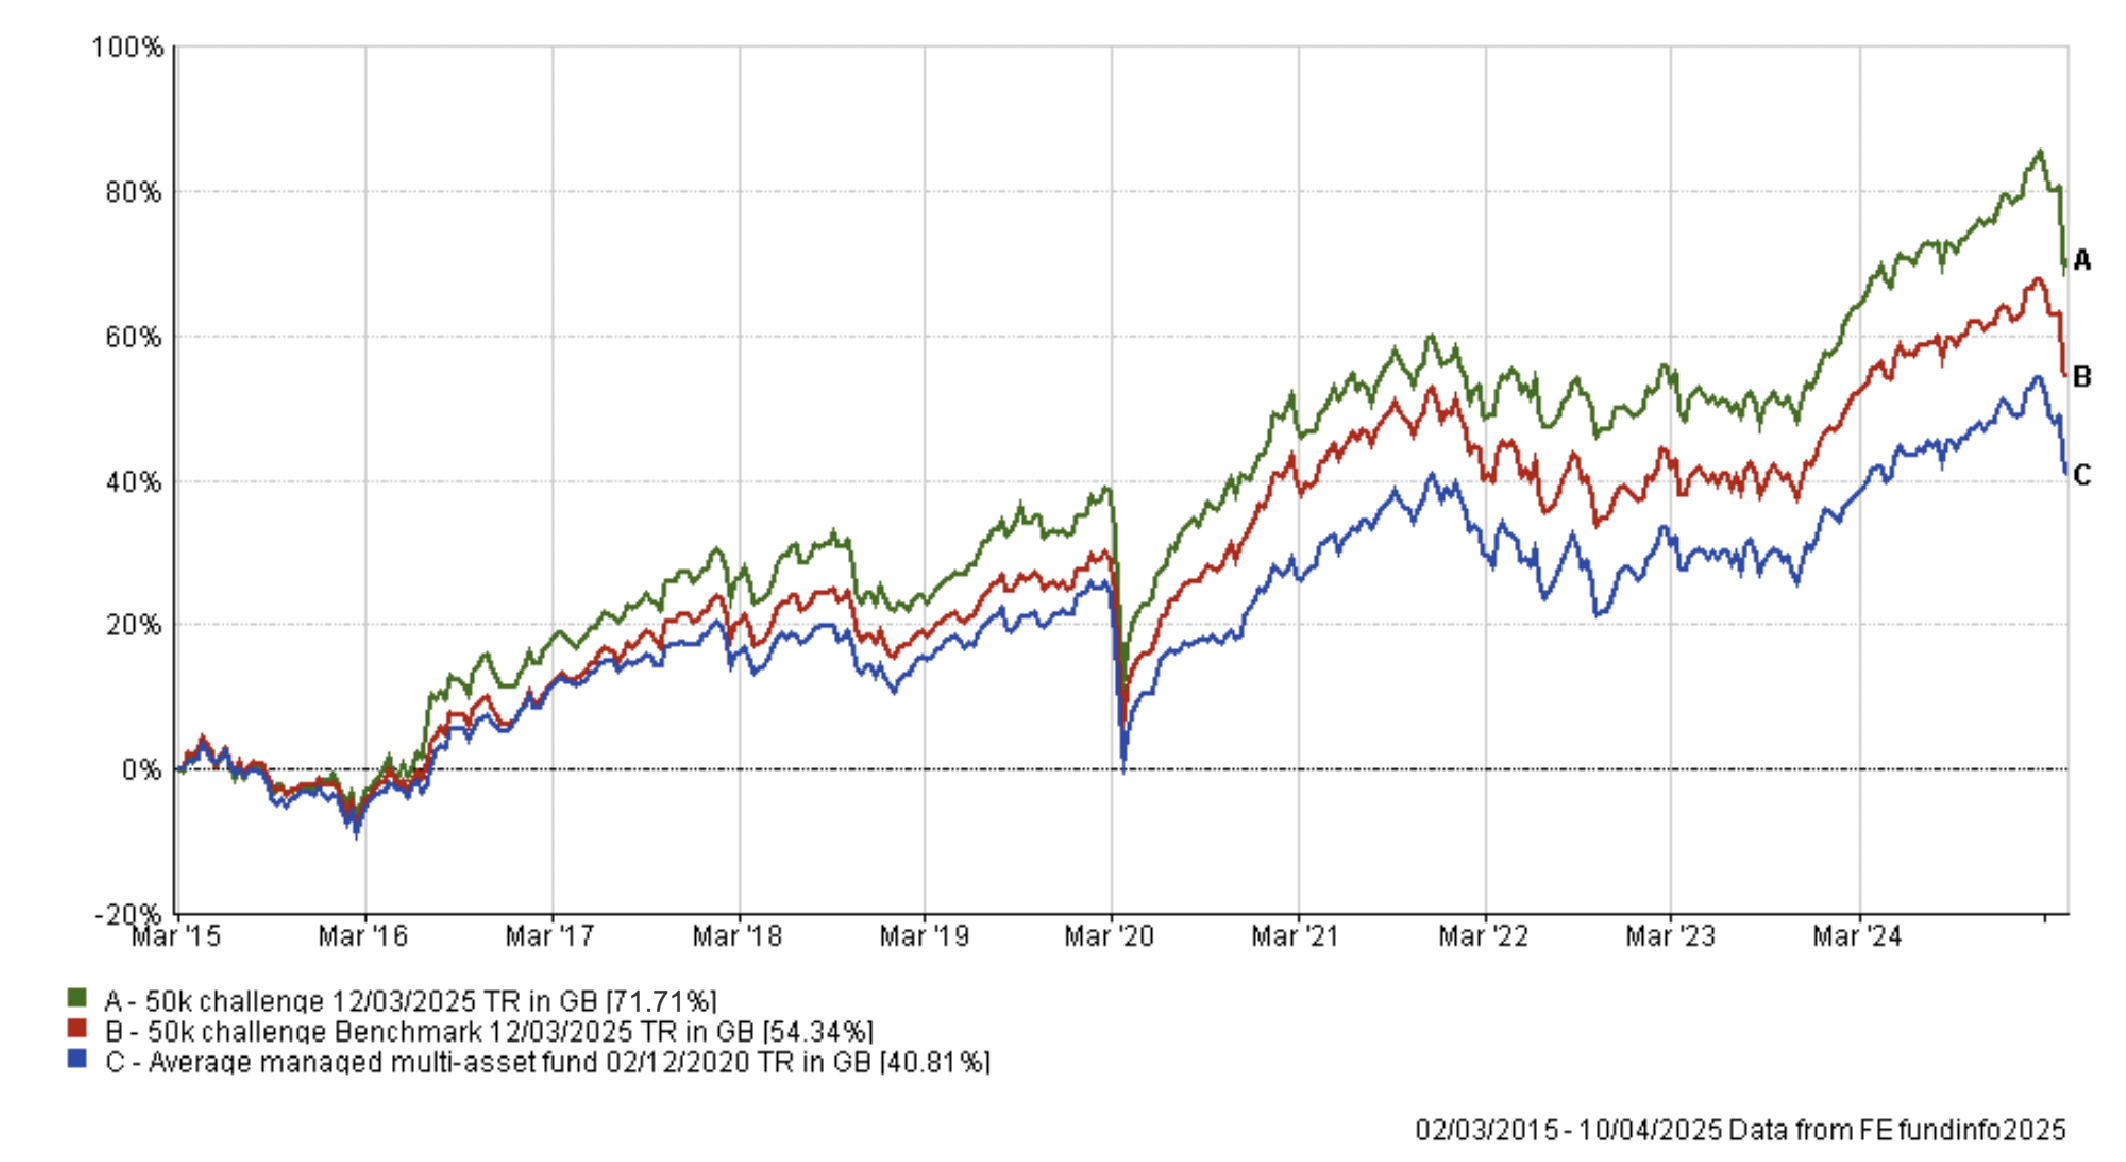
As is usual in my portfolio reviews, the chart below shows how my portfolio has outperformed since I started the challenge in March 2015. The green line is the performance of my portfolio while the red line is the benchmark showing the average return achieved by professional fund managers given the same asset mix. To accurately calculate this I have used the average return for each sector in which my portfolio invested. The blue line shows what the average multi-asset fund with comparable equity content achieved. In other words, the red line would show the extra performance added by just the asset mix of my portfolio (where I was invested i.e. European equities etc) over picking a typical multi-asset fund (the blue line). While the green line (which is my actual performance) shows the impact of being in the right funds at the right time, as identified by the 80-20 Investor algorithm.
As you can see my portfolio continues to outperform its benchmarks even after the Trump tariff market crash.
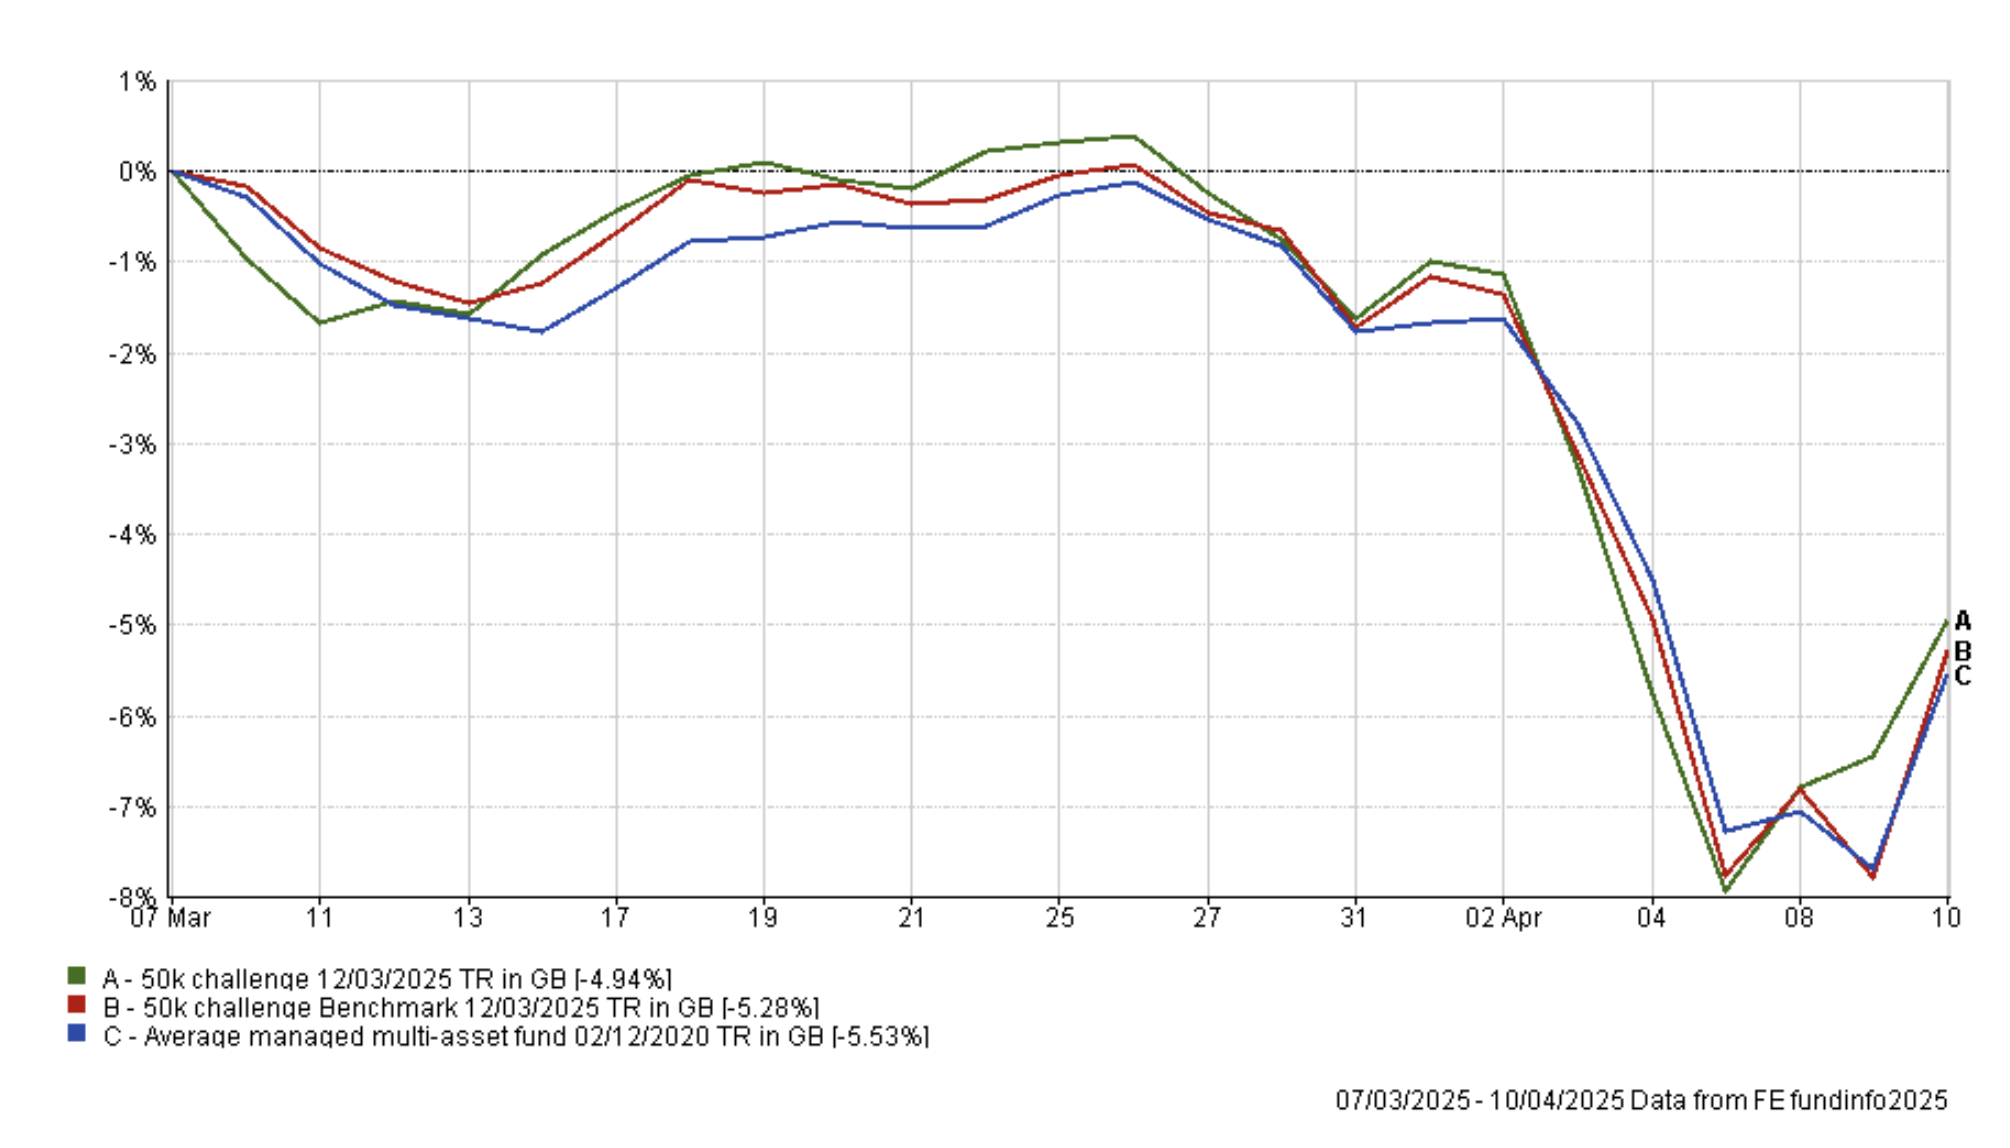
The chart below shows that while my portfolio fell, along with everything else in the investment world, it still extended its outperformance over its benchmarks during what was a historically difficult month for investment markets.
The table below shows how the only way I could have avoided losing money was to be invested in gold or cash over the last month. Premier Miton Tellworth UK Select also performed well as it tends to outperform during market sell-offs.
The worst performing funds are not unsurprising as they focused on US and Chinese/Asian equities, which have been hurt most by the tariff war.
| Name | % return over the last month (since March review) |
| iShares Physical Gold | 6.91 |
| Premier Miton Tellworth UK Select | 0.68 |
| Schroder Strategic Credit | -0.98 |
| abrdn High Yield Bond | -1.94 |
| Ninety One UK Special Situations | -5.72 |
| Man Japan Core Alpha | -5.73 |
| Aviva Inv Global Equity Income | -6.46 |
| T. Rowe Price US Large Cap Growth Equity | -6.87 |
| Artemis Global Income | -7 |
| Barclays Global Markets Adventurous | -7.64 |
| Vanguard FTSE Developed World ex-UK Equity Index | -8.4 |
| M&G Global Dividend | -9.04 |
| Invesco Asian (UK) | -9.23 |
| Jupiter China | -9.99 |
Now normally I would analyse how many funds within my portfolio are in the BOTB and BFBS tables and review their position accordingly. However, this month's portfolio review is markedly different and follows a deliberate decision to maintain my current holdings without any adjustments. The rationale behind this is a result of the extraordinary market volatility witnessed in the last 10 days as I described in this week's newsletter.
The market's reaction to Trump's announcement of reciprocal trade tariffs, as well as subsequent escalations and de-escalations, has been nothing short of seismic. The sharp declines in equity markets were among the largest on record (hence why every equity fund in the BOTB triggered a stop loss alert) but were followed by equally record-breaking rallies, sometimes within hours. This highlights the precarious nature of market sentiment and momentum right now. The VIX index, a barometer of fear, consistently breaching the 40 level, a feat only seen during the 2008 financial crisis and the 2020 pandemic, serves as a stark reminder of the prevailing unease.
The bond market has also exhibited extraordinary volatility in the last 10 days. The unprecedented surge in 10-year US Treasury yields, the largest three-day rise since 2001, underscores the fragility of fixed-income markets. It means that there will be investors out there licking their wounds after selling out of equity markets during Monday's slump (crystallising losses) to only then lose more money by investing in the perceived safety of bonds just before their yields soared on Wednesday. To make matters worse they probably then had to look on from the sidelines as equity markets rebounded, recouping some of their losses.
We are also seeing the same level of volatility in currency markets, which impacts portfolio returns, and the only determining factor as to which assets are the current winners and losers is Donald Trump's latest whim.
Given this environment, any attempt to time the market or react to short-term fluctuations could prove detrimental, especially given the trading delays involved in switching in and out of unit trusts. The risk of being caught on the wrong side of a sudden momentum shift is substantial.
Therefore, I am taking a wait-and-see approach, which at this moment is a decision made easier by the overall performance of my portfolio since the start of April. Despite the slump in bond and equity markets my portfolio would now be ranked 29th out of 142 funds in the Mixed Investment 40%-85% Shares sector if it resided in it. That is the highest position since I've been running my portfolio. However, I accept that if the trade war escalates then that could all change. I will therefore keep monitoring the situation and of course reserve the right to carry out another portfolio review before the month is out if I feel it is needed.
Fund switches
- None
My portfolio
My portfolio remains:
| Fund | Allocation | Risk | Sector | ISIN Code |
| abrdn High Yield Bond | 14 | Lower | Sterling High Yield | GB00B79RR984 |
| Artemis Global Income | 12.5 | Medium | Global Equity Income | GB00B5N99561 |
| Aviva Inv Global Equity Income | 10 | Medium | Global Equity Income | GB0030441918 |
| Barclays Global Markets Adventurous | 8 | Medium | Flexible Investment | GB00B4YPY060 |
| Invesco Asian (UK) | 5.5 | Higher | Asia Pacific Excluding Japan | GB00B1W7HW60 |
| iShares Physical Gold ETC | 6 | Medium | Commodity & Energy ETF | IE00B4ND3602 |
| Jupiter China | 3 | Higher | China/Greater China | GB00B1DTDX49 |
| M&G Global Dividend | 5.5 | Medium | Global Equity Income | GB00B46J9127 |
| Man Group Man Japan CoreAlpha | 3 | Higher | Japan | GB00B0119B50 |
| Ninety One UK Special Situations | 4 | Higher | UK All Companies | GB00B1XFJS91 |
| Schroder Strategic Credit | 8 | Lower | Sterling Strategic Bond | GB00BJZ2ZC09 |
| T. Rowe Price US Large Cap Growth Equity | 6 | Higher | North America | GB00BD5FHW12 |
| Thesis TM Tellworth UK Select | 5.5 | Lower | Targeted Absolute Return | GB00BNY7YM73 |
| Vanguard FTSE Developed World ex-UK Equity Index | 9 | Medium | Global | GB00B59G4Q73 |
My Portfolio asset mix
My portfolio asset mix now has approximately 63% exposure to equities. Last month's figures are shown in brackets.
- UK Equities 12% (12%)
- North American Equities 24% (24%)
- Asian Equities 4% (4%)
- Chinese Equities 5% (5%)
- Emerging Market Equities 0% (0%)
- Japanese Equities 5% (5%)
- European Equities 8% (8%)
- Other International equity 5% (5%)
- Commodities and energy 6% (6%)
- UK Fixed Interest 4% (4%)
- Global Fixed Interest 19% (19%)
- Cash 0% (0%)
- Alternative Investment Strategies 8% (8%)
Damien's higher risk and lower risk portfolios
Using the logic described in my post: Update to Damien’s alternative risk portfolios I created hypothetical higher and lower risk versions of my portfolio below:
Lower risk
| Fund | Allocation % |
| abrdn High Yield Bond | 18 |
| Artemis Global Income | 16 |
| Aviva Inv Global Equity Income | 13 |
| Barclays Global Markets Adventurous | 10 |
| iShares Physical Gold ETC | 8 |
| M&G Global Dividend | 7 |
| Schroder Strategic Credit | 10 |
| Thesis TM Tellworth UK Select | 7 |
| Vanguard FTSE Developed World ex-UK Equity Index | 11 |
Higher risk
| Fund | Allocation % |
| Artemis Global Income | 17 |
| Aviva Inv Global Equity Income | 14 |
| Barclays Global Markets Adventurous | 11 |
| Invesco Asian (UK) | 8 |
| iShares Physical Gold ETC | 8 |
| Jupiter China | 4 |
| M&G Global Dividend | 8 |
| Man Group Man Japan CoreAlpha | 4 |
| Ninety One UK Special Situations | 6 |
| T. Rowe Price US Large Cap Growth Equity | 8 |
| Vanguard FTSE Developed World ex-UK Equity Index | 12 |

£200 Pension Cashback Offer
Make a qualifying deposit or transfer a pension to our partner Interactive Investor.
- Deposit or transfer a pension of at least £20k and you could earn £200 cashback
- Terms and Fees apply, Capital at risk
- New & Existing customers opening a SIPP
- Offer ends 31st July 2026
Before starting your transfer, check you won't lose any valuable benefits (such as guaranteed annuity rates or a lower protected pension age) and find out what exit fees you might have to pay
