

The background to my portfolio
Back in March 2015 I decided to invest £50,000 of my own money using 80-20 Investor. The purpose was twofold, firstly to show how you can use 80-20 Investor to invest and outperform the market with only a few minutes effort every now and then. Secondly, no other investment commentator, journalist or research provider invests their own money for fear of failing. This is a sorry state of affairs and is precisely why I committed to openly running my own portfolio for 80-20 Investor members to see.
Since then I have periodically changed my portfolio using the fund suggestions provided by the 80-20 Investor algorithm and associated research. I always disclose the changes at the time they are made.
Performance update
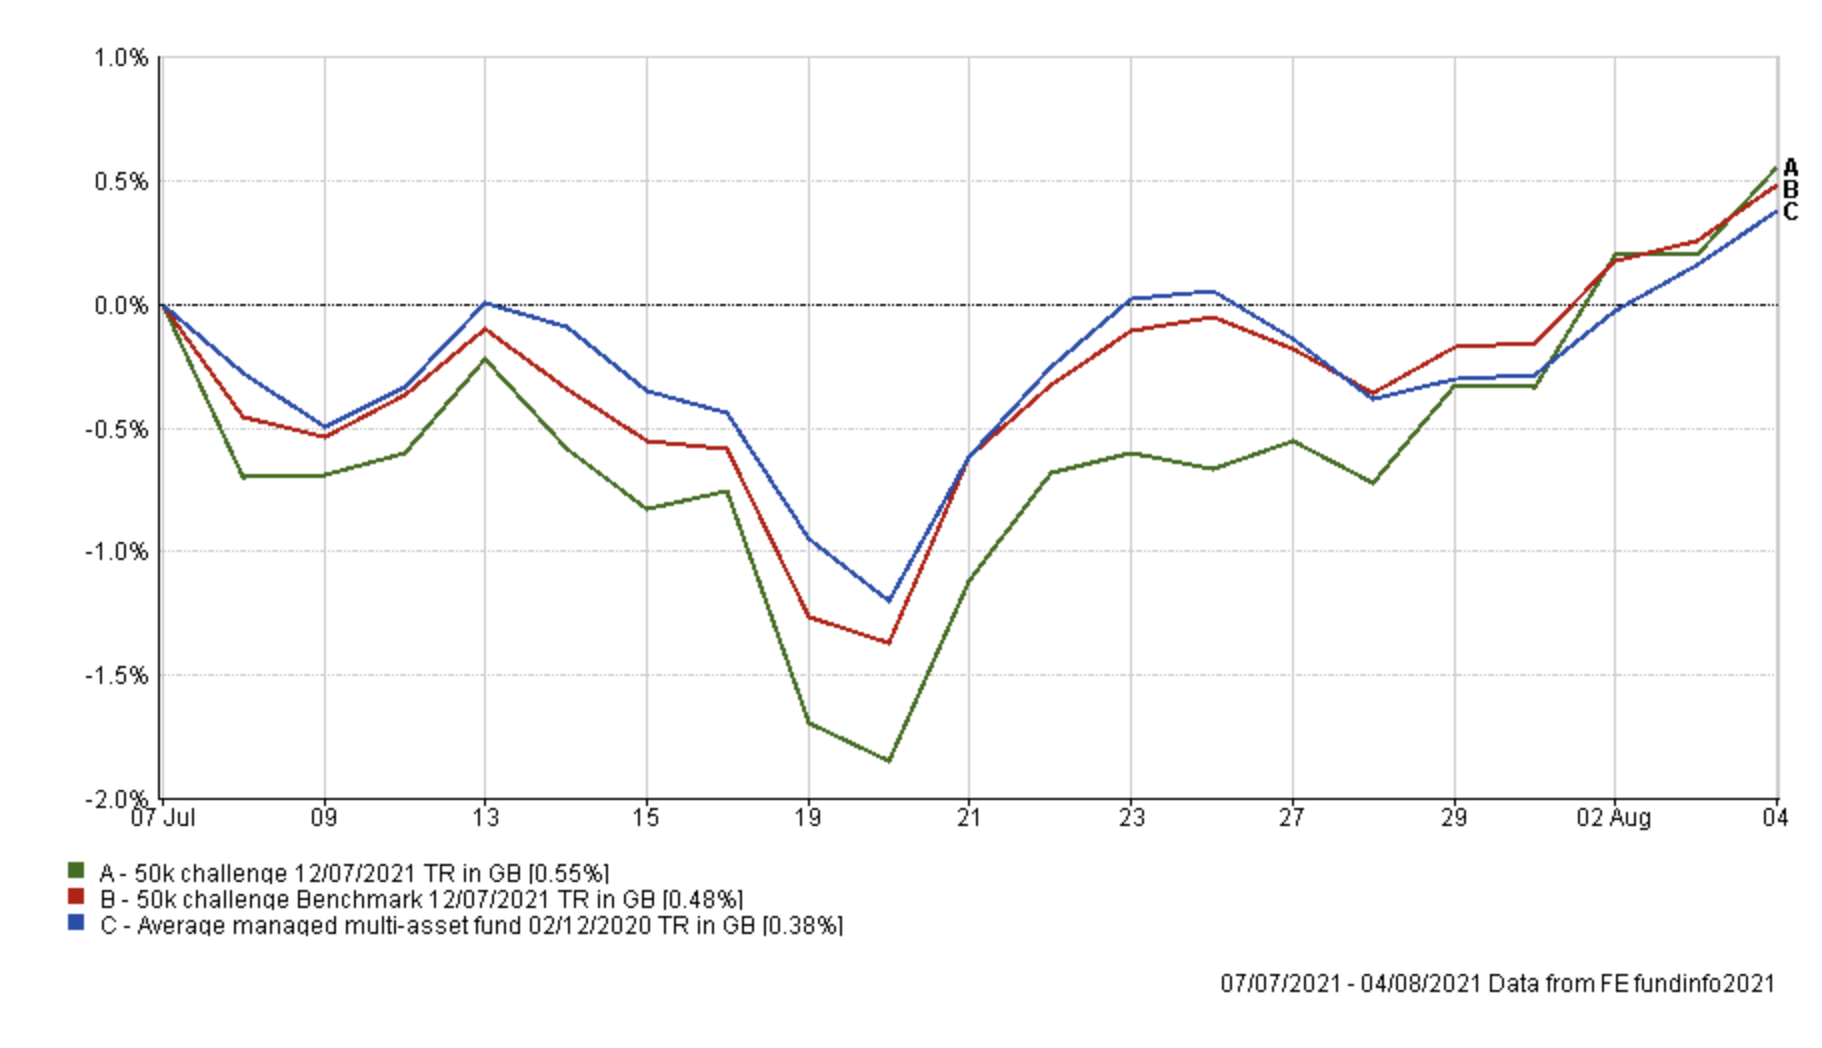
As is usual in my portfolio reviews, the chart below shows how my portfolio has outperformed since I started the challenge in March 2015, which is over six years ago. The green line is the performance of my portfolio while the red line is the benchmark showing the average return achieved by professional fund managers given the same asset mix. To accurately calculate this I have used the average return for each sector in which my portfolio invested. The blue line shows what the average multi-asset fund with comparable equity content achieved. In other words, the red line would show the extra performance added by just the asset mix of my portfolio (where I was invested i.e European equities etc) over picking a typical multi-asset fund (the blue line). While the green line (which is my actual performance) shows the impact of being in the right funds at the right time, as identified by the 80-20 Investor algorithm.

My £50k portfolio remains near its all-time high after navigating another tricky month. As you can see from the chart below my portfolio struggled in the first half of July before surging in the second half to finish marginally above its benchmarks.
If you look at the messy chart below which shows the performance of each fund over the course of the month you can see that my portfolio's resurgence coincided with the upturn in fortunes for smaller companies stocks and UK stocks, but also commodities to a lesser degree. We also saw the value of the pound strengthen. It was the reverse of these trends which hampered my portfolio back in June.
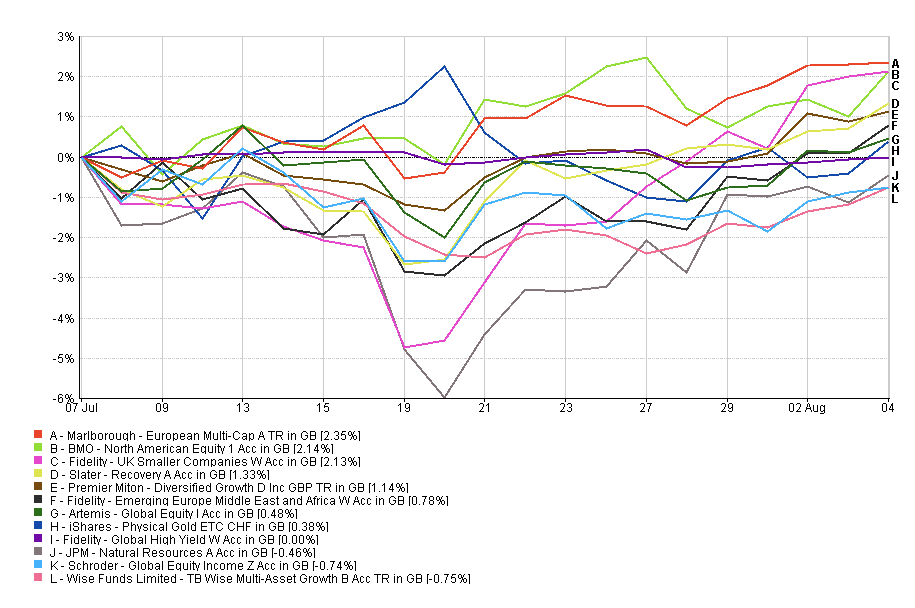
The table below shows the overall performance of each fund within my portfolio since my review last month. There are some strong performances from funds with exposure to smaller companies in the UK and Europe. It is also good to see new additions BMO North American Equity, Slater Recovery and Fidelity Emerging Europe Middle East and Africa performing well. At the opposite end of the table, Schroder Global Equity Income and JPM Natural Resources are propping up the table despite the latter's strong performance in the second half of July.
| Fund | % return since last review (7th July to 4th August) |
| Marlborough European Multi-Cap | 2.35 |
| BMO North American Equity | 2.14 |
| Fidelity UK Smaller Companies | 2.13 |
| Slater Recovery | 1.33 |
| Premier Miton Diversified Growth | 1.14 |
| Fidelity Emerging Europe Middle East and Africa | 0.78 |
| Artemis Global Equity | 0.48 |
| ASI Strategic Bond | 0.38 |
| Fidelity Global High Yield | 0 |
| iShares Physical Gold ETC | -0.41 |
| JPM Natural Resources | -0.46 |
| Schroder Global Equity Income | -0.74 |
| Wise Funds Limited TB Wise Multi-Asset Growth | -0.75 |
As usual, the table below shows which funds within my current portfolio are in the current BOTB or BFBS tables and which are not. Those funds in green are still in the BOTB while those in orange are not in the BOTB but remain in the BFBS list. Meanwhile, any funds in red have dropped out of both shortlists.
|
Name |
Allocation % (rounded) | Risk | Sector | ISIN Code |
| Artemis Global Equity | 5 | Medium | Global | GB00B2PLJP95 |
| ASI Strategic Bond | 15 | Low | Sterling Strategic Bond |
GB00BWK27X12
|
| BMO North American Equity | 5.5 | Medium | North America | GB0030281405 |
| Fidelity Emerging Europe Middle East and Africa | 6.5 | High | Specialist | GB00B87Z7808 |
| Fidelity Global High Yield | 8 | Low | Sterling High Yield |
GB00B7K7SQ18
|
| Fidelity UK Smaller Companies | 9.5 | High | UK Smaller Companies |
GB00B7VNMB18
|
| iShares Physical Gold ETC | 4 | Medium | Commodity & Energy ETF | IE00B4ND3602 |
| JPM Natural Resources | 5 | High | Specialist | GB0031835118 |
| Marlborough European Multi-Cap | 4 | High | Europe Excluding UK | GB0001719730 |
| Premier Diversified Growth | 16 | Medium | Mixed Investment 40-85% Shares | GB00B8BJV423 |
| Schroder Global Equity Income | 7 | Medium | Global Equity Income |
GB00B76V7M69
|
| Slater Recovery | 6 | Medium | UK All Companies | GB0031554248 |
| Wise Multi-Asset Growth | 8.5 | Medium | Flexible Investment | GB0034272533 |
The changes made last month increased the portfolio's exposure to growth stocks, which continue to be rewarded as the reflation trade falters over global growth concerns. The changes proved beneficial as the table below shows. But of course it is just a short period of time so we shouldn't read too much into it, however it is nice to see an occasion when all the changes make an immediate positive impact on the portfolio.
| Old fund | % return since last review (7th July to 4th August) |
| Fidelity American Special Situations | 0.58% (versus 2.14% for BMO North American Equity) |
| ES R&M UK Recovery | -0.01% (versus 1.33% for Slater Recovery) |
| Jupiter Income Trust | -0.69% (versus 1.14% for Premier Diversified Growth) |
| Invesco Global Emerging Markets | -3.18% (versus 0.78% for Fidelity Emerging Europe Middle East and Africa) |
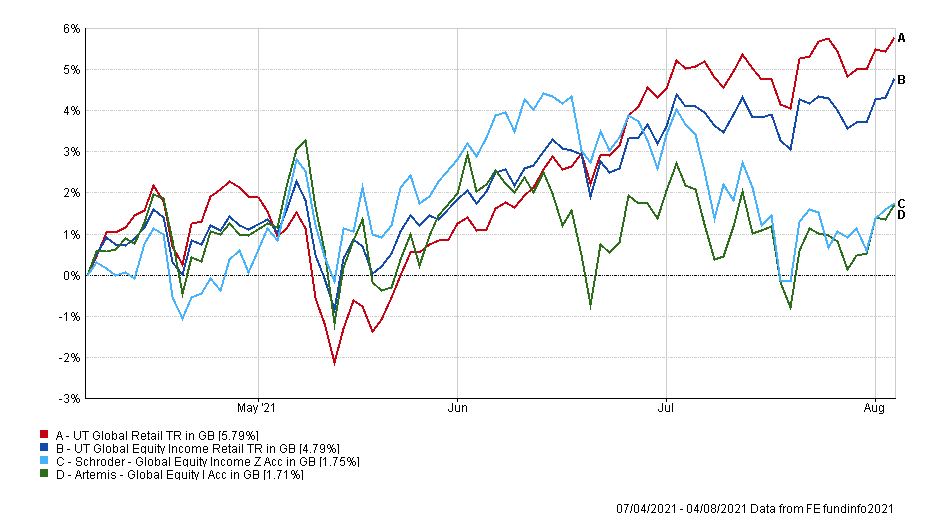
Looking at the colour-coded table above the three funds that are no longer in either the BOTB or BFBS are coloured red. They are Artemis Global Equity, BMO North American Equity and Schroder Global Equity Income. Both the Artemis and Schroder funds have struggled for a couple of months now as shown in the chart below which also includes their respective benchmarks. So I think it is time for a change.
The BMO North American Equity fund has been performing well against its peers as shown in the chart below and as a recent addition, it is far too soon to make a judgement to change it.

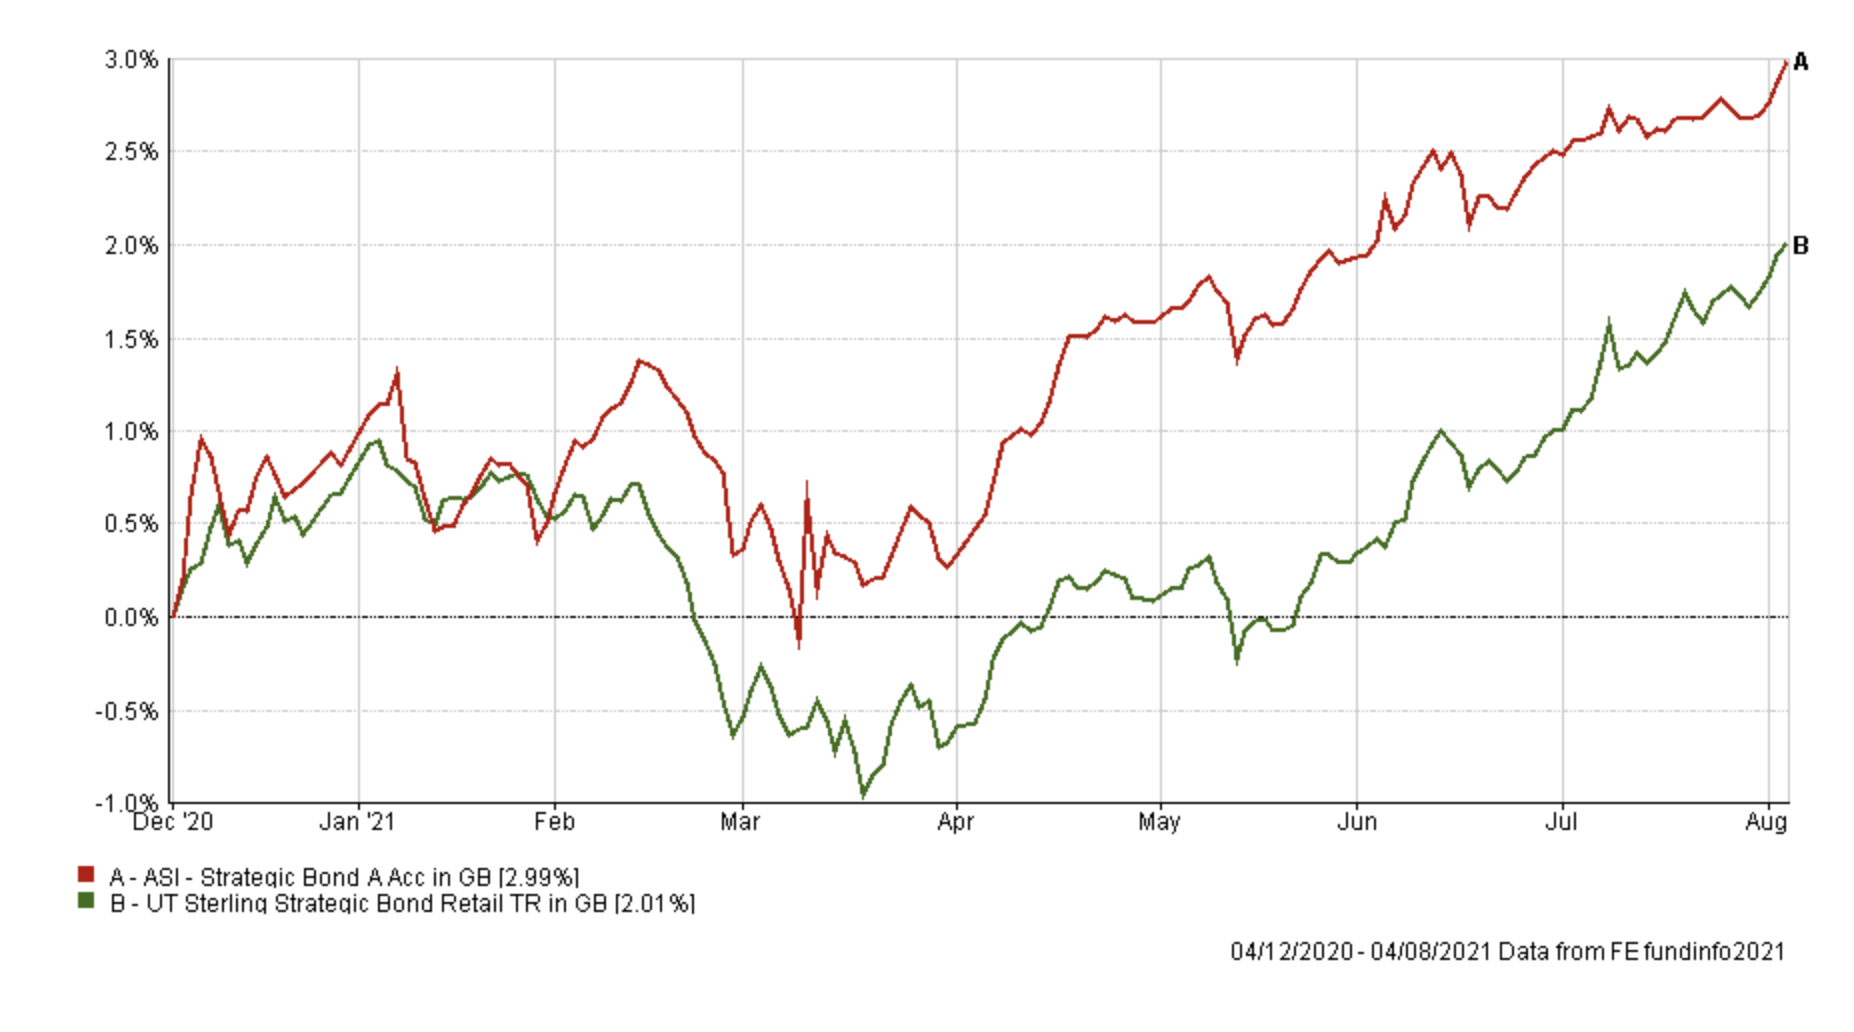
The other funds within my portfolio are either in the BFBS or the BOTB tables. However, I plan to make changes to two of them, namely JPM Natural Resources and ASI Strategic Bond. The latter fund has been on my watchlist for some time and while it has been in my portfolio since 2020 and outperformed the average of its peers in that time (as shown below) there are arguably better alternatives from a momentum perspective. So for that reason, I am going to reduce my holding over time, starting this month.
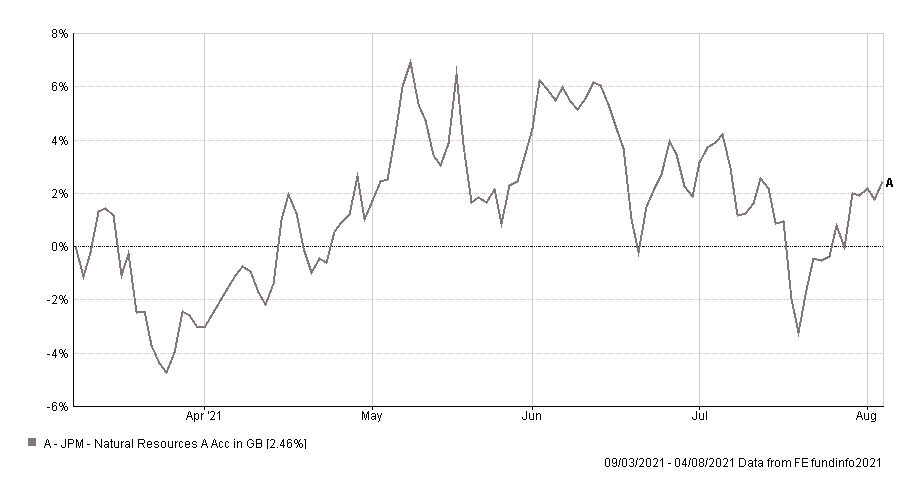
The JPM Natural Resources fund is an interesting one. As the chart below shows while the fund has been a profitable investment, largely thanks to the rally at the end of July, it's been a wild ride and at present remains well below its May high. That doesn't make it a bad fund. It's just that there are arguably other options that are more attractive from a momentum perspective right now. So I will look to remove it from my portfolio. Don't forget I will still maintain some commodity exposure via my holding in gold.
As ever I aim to minimise the number of changes that I make to ensure that most of my portfolio remains in the market. So I intend to make the following switches which only affect just over 20% of my portfolio.
Fund switches
Following this review, I have made the following fund switches:
100% out of Artemis Global Equity and 100% into Fundsmith equity - this is a like for like Global fund switch, but the latter has greater exposure to growth stocks, principally technology stocks.
100% out of JPM Natural Resources and 50% into Fundsmith equity and 50% into Marlborough European Multi-Cap - this switch increases my exposure to one of the best performing funds already within my portfolio (Marlborough European Multi-Cap) and increases my European equity exposure and overall equity exposure in line with that of the BOTB.
33.3% out of ASI Strategic Bond and 100% into BM Brooks Macdonald Defensive Capital - this introduces a non-bond element to the low-risk section of my portfolio, something we've seen increasingly in the BOTB at a time when bonds remain volatile.
100% out of Schroder Global Equity Income and 100% into Fidelity Global Property - this fund gives exposure to Real Estate Investment Trusts (REITs) which have increasingly gained traction in the BOTB as property shares have benefited from the current economic backdrop.
My portfolio
My portfolio now looks like this:
|
Name |
Allocation % (rounded) | Risk | Sector | ISIN Code |
| ASI Strategic Bond | 10 | Low | Sterling Strategic Bond |
GB00BWK27X12
|
| BM Brooks Macdonald Defensive Capital | 5 | Low | Targeted Absolute Return |
GB00B61MR835
|
| BMO North American Equity | 5.5 | Medium | North America | GB0030281405 |
| Fidelity Emerging Europe Middle East and Africa | 6.5 | High | Specialist | GB00B87Z7808 |
| Fidelity Global High Yield | 8 | Low | Sterling High Yield |
GB00B7K7SQ18
|
| Fidelity Global Property | 7 | Medium | Property Other |
GB00B7K2NZ09
|
| Fidelity UK Smaller Companies | 9.5 | High | UK Smaller Companies |
GB00B7VNMB18
|
| Fundsmith Equity | 7.5 | Medium | Global |
GB00B4Q5X527
|
| iShares Physical Gold ETC | 4 | Medium | Commodity & Energy ETF | IE00B4ND3602 |
| Marlborough European Multi-Cap | 6.5 | High | Europe Excluding UK | GB0001719730 |
| Premier Diversified Growth | 16 | Medium | Mixed Investment 40-85% Shares | GB00B8BJV423 |
| Slater Recovery | 6 | Medium | UK All Companies | GB0031554248 |
| Wise Multi-Asset Growth | 8.5 | Medium | Flexible Investment | GB0034272533 |
My Portfolio asset mix
My portfolio asset mix is as shown below which has around a 63% exposure to equities which is up on last month's 59%. The numbers in brackets are last month's equivalent figures.
-
- UK Equities 20% (21%)
- North American Equities 15% (13%)
- Asian/Emerging Market Equities 6% (7%)
- Japanese Equities 0% (0%)
- European Equities 7% (5%)
- Chinese equities 0% (0%)
- Other equity 7% (7%)
- Commodities and energy 5% (9%)
- UK Fixed Interest 4% (6%)
- Global Fixed Interest 14% (16%)
- Cash 5% (5%)
- Alternative Investment Strategies 9% (11%)
- Property 8% (0%)
Damien's higher risk and lower risk portfolios
Using the logic described in my post: Update to Damien’s alternative risk portfolios I created hypothetical higher and lower risk versions of my portfolio below:
Lower risk
| Fund | Allocation % |
| ASI Strategic Bond | 13 |
| BM Brooks Macdonald Defensive Capital | 6 |
| BMO North American Equity | 7 |
| Fidelity Global High Yield | 10 |
| Fidelity Global Property | 9 |
| Fundsmith Equity | 10 |
| iShares Physical Gold ETC | 5 |
| Premier Diversified Growth | 21 |
| Slater Recovery | 8 |
| Wise Multi-Asset Growth | 11 |
Higher risk
| Fund | Allocation % |
| BMO North American Equity | 8 |
| Fidelity Emerging Europe Middle East and Africa | 8 |
| Fidelity Global Property | 9 |
| Fidelity UK Smaller Companies | 12 |
| Fundsmith Equity | 10 |
| iShares Physical Gold ETC | 5 |
| Marlborough European Multi-Cap | 8 |
| Premier Diversified Growth | 21 |
| Slater Recovery | 8 |
| Wise Multi-Asset Growth | 11 |

£200 Pension Cashback Offer
Make a qualifying deposit or transfer a pension to our partner Interactive Investor.
- Deposit or transfer a pension of at least £20k and you could earn £200 cashback
- Terms and Fees apply, Capital at risk
- New & Existing customers opening a SIPP
- Offer ends 31st July 2026
Before starting your transfer, check you won't lose any valuable benefits (such as guaranteed annuity rates or a lower protected pension age) and find out what exit fees you might have to pay
