

The background to my portfolio
Back in March 2015 I decided to invest £50,000 of my own money using 80-20 Investor. The purpose was twofold, firstly to show how you can use 80-20 Investor to invest and outperform the market with only a few minutes effort every now and then. Secondly, no other investment commentator, journalist or research provider invests their own money for fear of failing. This is a sorry state of affairs and is precisely why I committed to openly running my own portfolio for 80-20 Investor members to see.
Since then I have periodically changed my portfolio using the fund suggestions provided by the 80-20 Investor algorithm and associated research. I always disclose the changes at the time they are made.
Performance update
As is usual in my portfolio reviews, the chart below shows how my portfolio has outperformed since I started the challenge in March 2015, which is over seven years ago. The green line is the performance of my portfolio while the red line is the benchmark showing the average return achieved by professional fund managers given the same asset mix. To accurately calculate this I have used the average return for each sector in which my portfolio invested. The blue line shows what the average multi-asset fund with comparable equity content achieved. In other words, the red line would show the extra performance added by just the asset mix of my portfolio (where I was invested i.e European equities etc) over picking a typical multi-asset fund (the blue line). While the green line (which is my actual performance) shows the impact of being in the right funds at the right time, as identified by the 80-20 Investor algorithm.
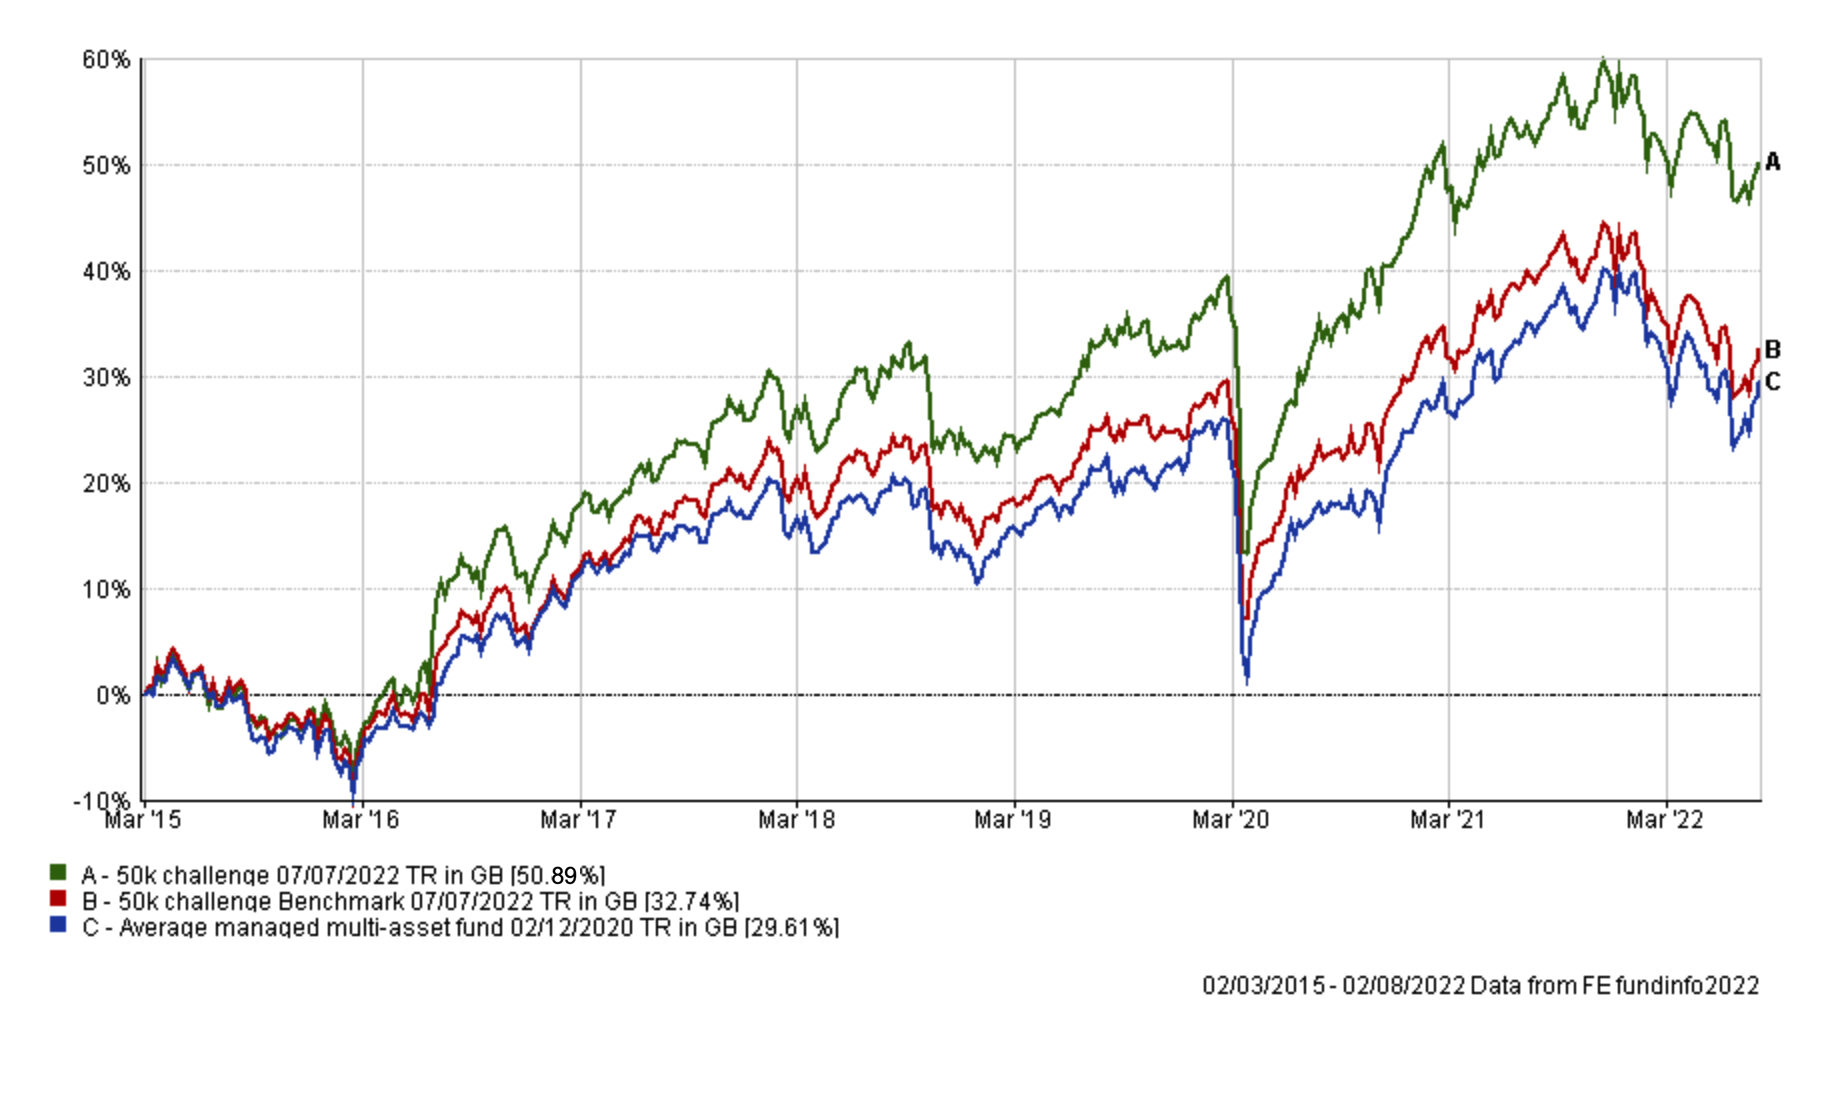
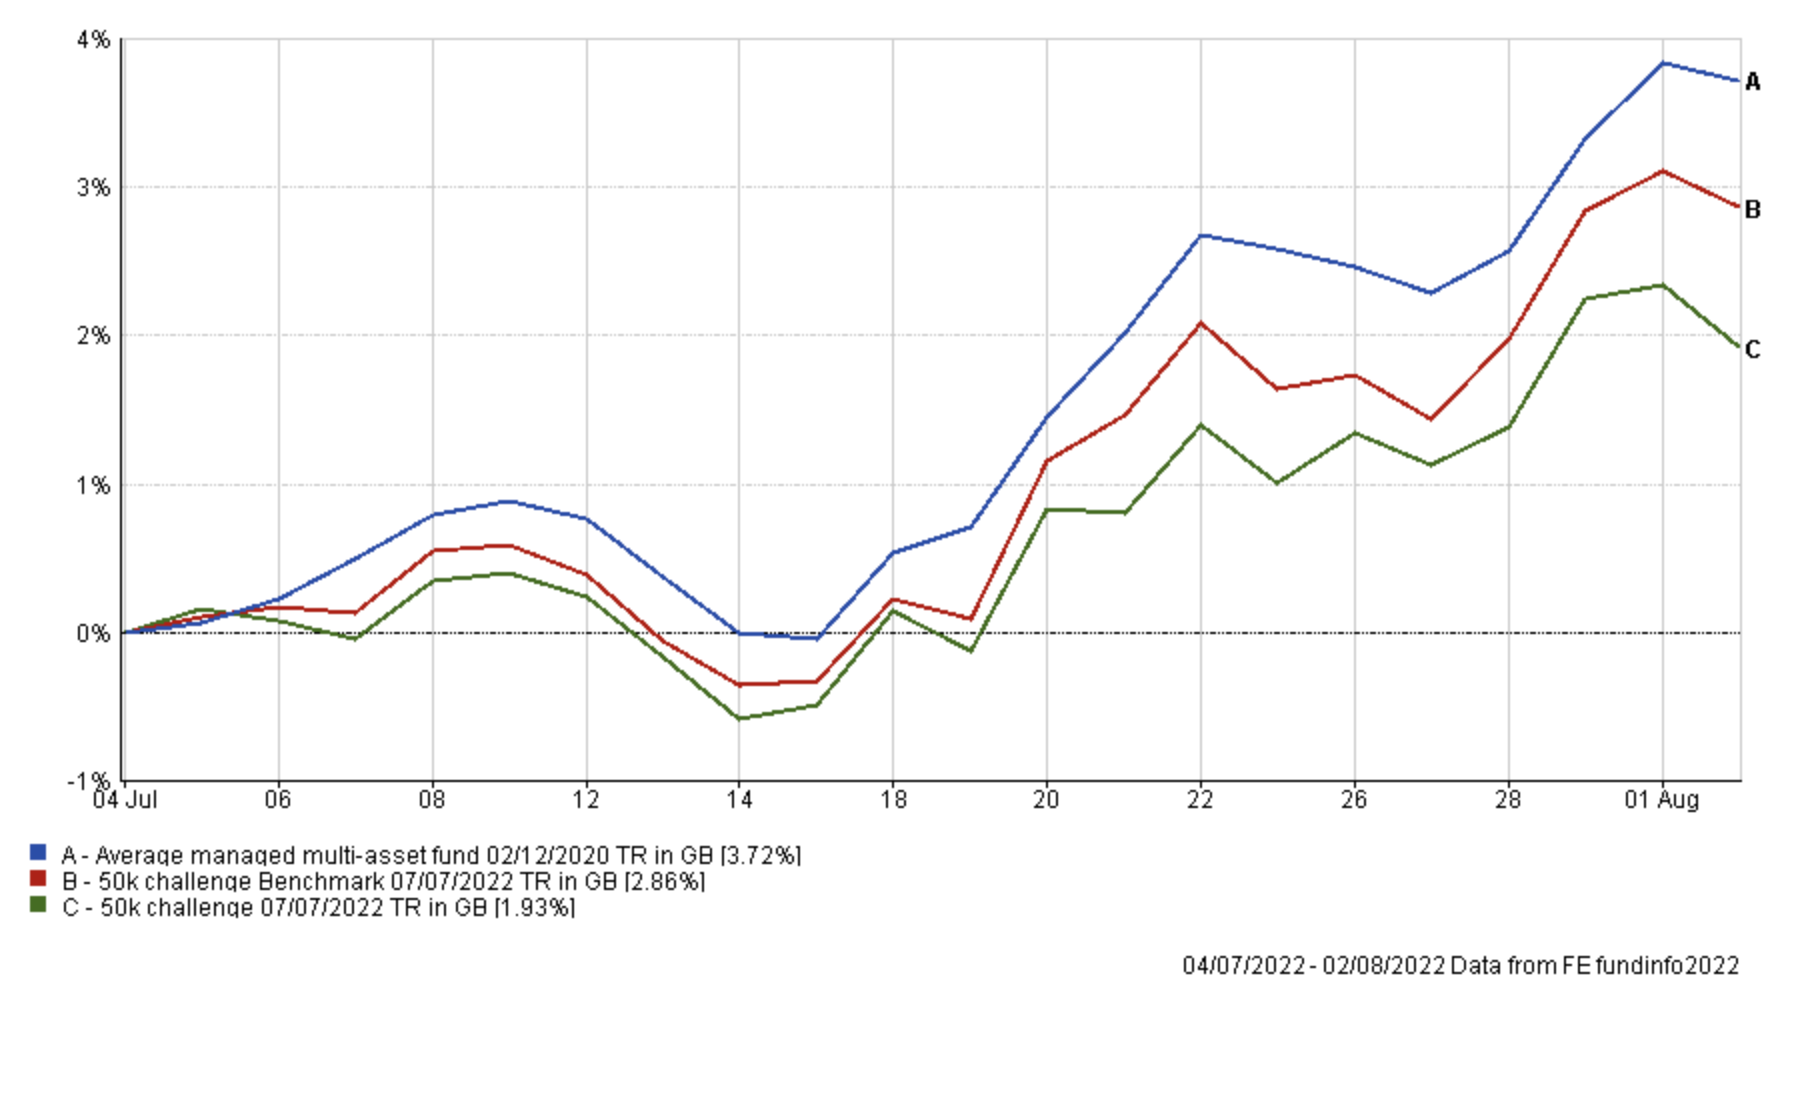
My portfolio continues to outperform its benchmarks over the long term. Since my last update a month ago my £50k portfolio has produced a strong positive return but it has lagged its benchmarks as shown in the chart below.
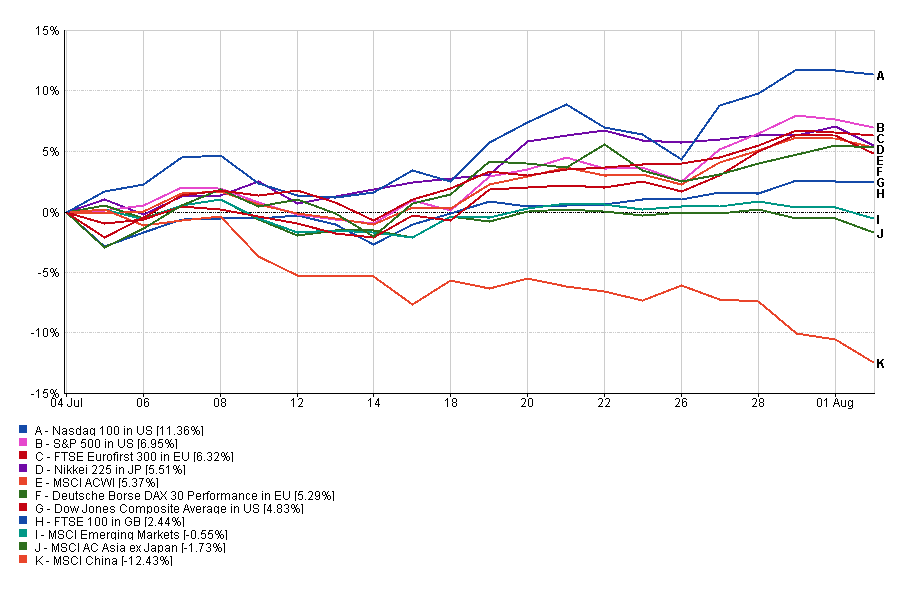
The reason for the lag is because US stock markets, and to a certain extent bond markets. moved aggressively higher during the month. The chart below shows the price moves of key stock markets around the world. Most notably China’s stock market tumbled by more than 12%, partly, thanks to further Covid restrictions so my decision to abstain from adding any exposure to my portfolio last month proved astute.
The table below shows the individual performance of each holding in my portfolio since my last review a month ago. Clearly July was a month when investment risk was rewarded.
| Holding | % return since last review on 4th July |
| Fidelity Index US | 6.38 |
| M&G Global Dividend | 3.57 |
| JOHCM Global Opportunities | 3.48 |
| Fidelity American Special Situations | 2.87 |
| Troy Asset Management Ltd Trojan Ethical | 2.72 |
| Fidelity Global Property | 2.67 |
| BM SVS Brooks Macdonald Defensive Capital | 2.52 |
| Thesis TM Tellworth UK Select | 1.58 |
| Janus Henderson Inst Overseas Bond | 1.27 |
| BlackRock Natural Resources Growth & Income | 1.19 |
| Invesco UK Opportunities (UK) | 1.17 |
| Cash | 0.08 |
| Premier Miton Defensive Growth | -0.08 |
| iShares Physical Gold ETC | -2.42 |
As usual, the table below shows which funds within my portfolio are in the current BOTB or BFBS tables and which are not. Those funds in green are still in the BOTB while those in orange are not in the BOTB but remain in the BFBS list. Meanwhile, any funds in red have dropped out of both shortlists.
| Name | Allocation % (rounded) | Risk | Sector | ISIN Code |
| BlackRock Natural Resources Growth & Income | 4.00% | High | Commodity/Natural Resource | GB00B6865B79 |
| BM SVS Brooks Macdonald Defensive Capital | 5.00% | Low | Targeted Absolute Return | GB00B61MR835 |
| Cash | 6.5% | Low | ||
| Fidelity American Special Situations | 8.5% | Medium | North America | GB00B89ST706 |
| Fidelity Global Property | 8.00% | High | Property Other | GB00B7K2NZ09 |
| Fidelity Index US | 7.5% | High | North America | GB00BJS8SH10 |
| Invesco UK Opportunities (UK) | 7.50% | Medium | UK All Companies | GB00B1W7HM62 |
| iShares Physical Gold ETC | 5.00% | Medium | Commodity & Energy ETF | IE00B4ND3602 |
| Janus Henderson Inst Overseas Bond | 6.50% | Low | Global Bonds | GB0007673055 |
| JOHCM Global Opportunities | 8.00% | Medium | Global | GB00BJ5JMC04 |
| M&G Global Dividend | 6.50% | Medium | Global Equity Income | GB00B46J9127 |
| Premier Miton Defensive Growth | 13.75% | Low | Targeted Absolute Return | GB00B832BD89 |
| Thesis TM Tellworth UK Select | 5.25% | Low | Targeted Absolute Return | GB00BNY7YM73 |
| Troy Asset Management Ltd Trojan Ethical | 8.00% | Low | Flexible Investment | GB00BJP0XX17 |
As I highlighted in my last portfolio review, in the first half of 2022 my portfolio's reduced bond exposure and higher cash weighting proved a positive move as stagflation fears grew. The absolute return funds within my portfolio also helped insulate the lower-risk end of my portfolio from the carnage in bond markets.
But for the month of July when equity markets rallied strongly (5.37% as measured by the MSCI All Country World Index), such a defensive tilt proved a drag on returns, although the portfolio still grew by almost 2% during the month. That's still a good result.
Not only that but almost every fund in the portfolio has now returned to the BFBS or BOTB lists, as signified by the orange and green colours in the chart above. So, just as I wrote last time, my portfolio is not broken, far from it, and there’s no rush to tear it apart. Also the asset mix has actually morphed back more in line with that of the BOTB, after a fairly significant divergence last month. The positive trends in Asian and Emerging market equities (especially China) faltered in July and now no longer feature in the BOTB, or certainly to a much lesser degree. Therefore, my decision to wait for those trends to establish themselves before jumping on board within my own portfolio proved prudent.
It is for similar reasons why I am sticking to my process and not trying to chase the latest rally in stock markets. In time my portfolio will become more aggressive if momentum warrants it. Right now, the portfolio's Alpha and Sharpe ratios have even improved further (see May's review for an explanation of Alpha and Sharpe ratios) meaning that the portfolio is producing even better returns for the level of risk being taken.
Interestingly the only fund in my portfolio not in the BOTB and BFBS tables is BM SVS Brooks Macdonald Defensive Capital. This has been a recurring theme in recent months, despite a relatively good performance in July (see earlier table). I have been dripping out of this fund already and for this reason I plan to finish doing so this month.
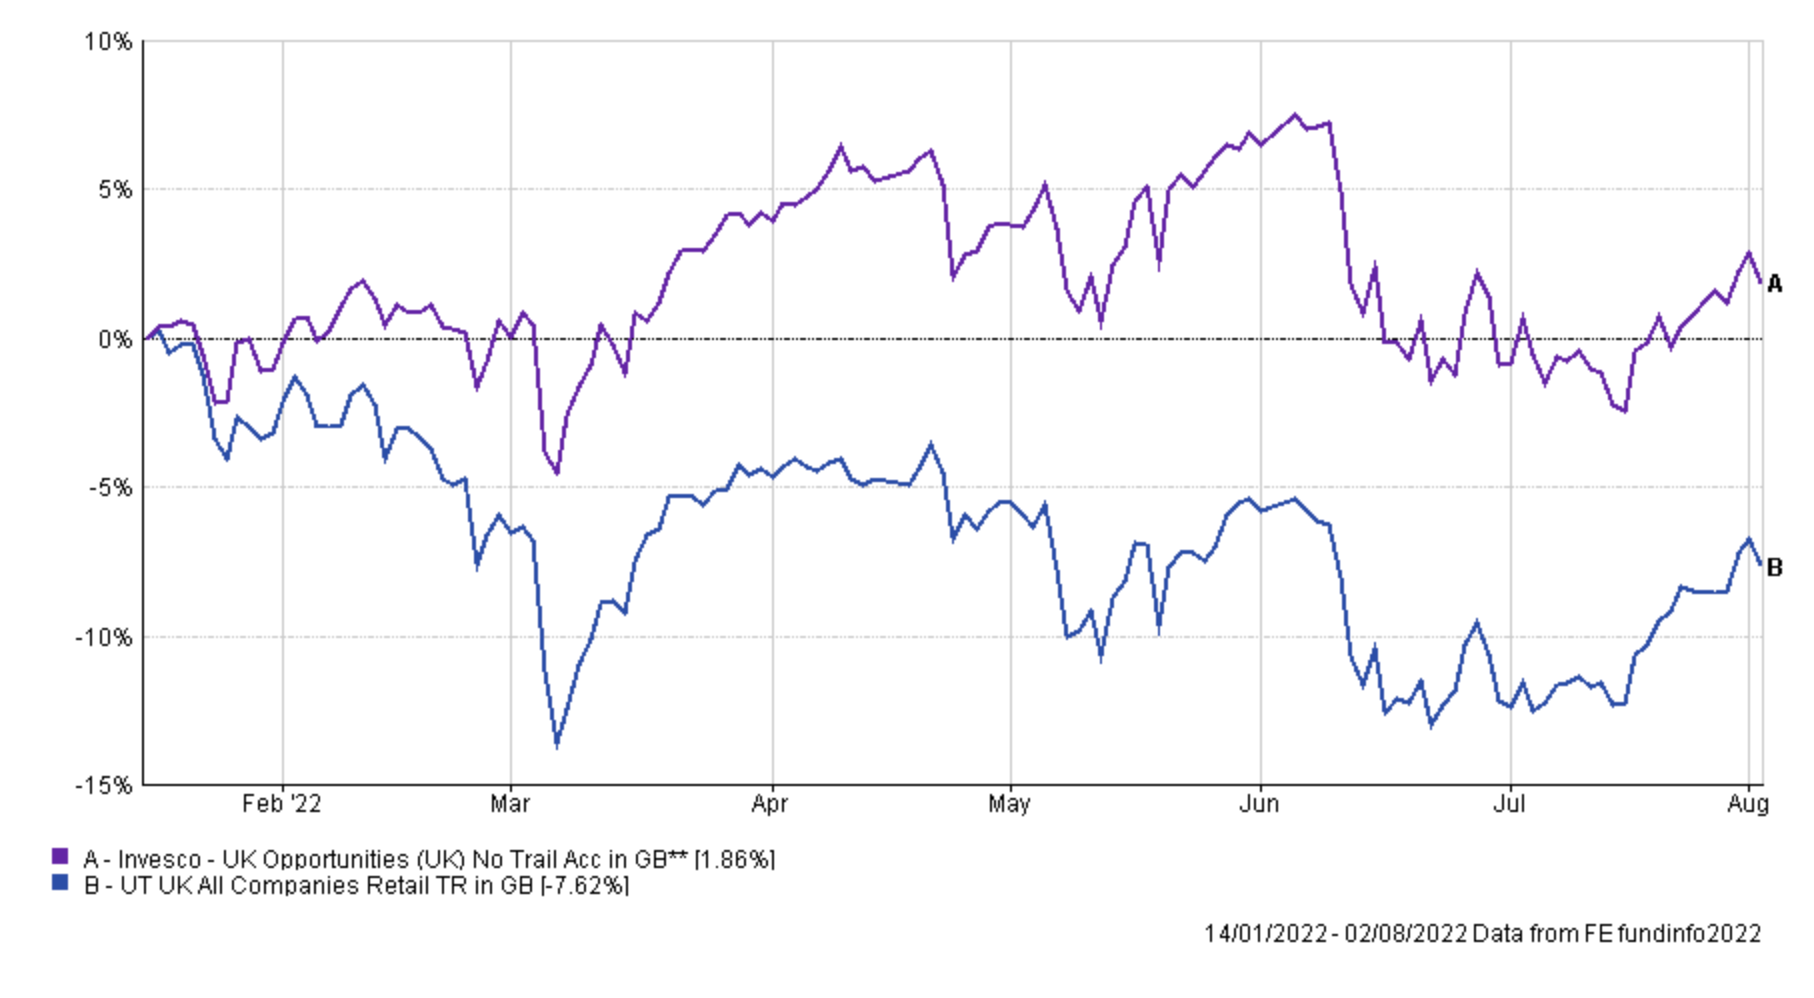
Two funds within my portfolio that I have the highest exposure to are Invesco UK Opportunities (UK) and of course Premier Miton Defensive Growth. Both have been strong performers ever since they entered my portfolio but in the last two months the Invesco fund has underperformed its peer group, partly due to the changing market narrative about the prospect of a global recession. The charts below shows the performance of the fund since I've held it and summarises the situation well.
In the case of the Premier Miton fund its performance versus its peers since I've held it has been impressive, and it remains in the BOTB, however as you can see below the performance has flatlined somewhat since May.
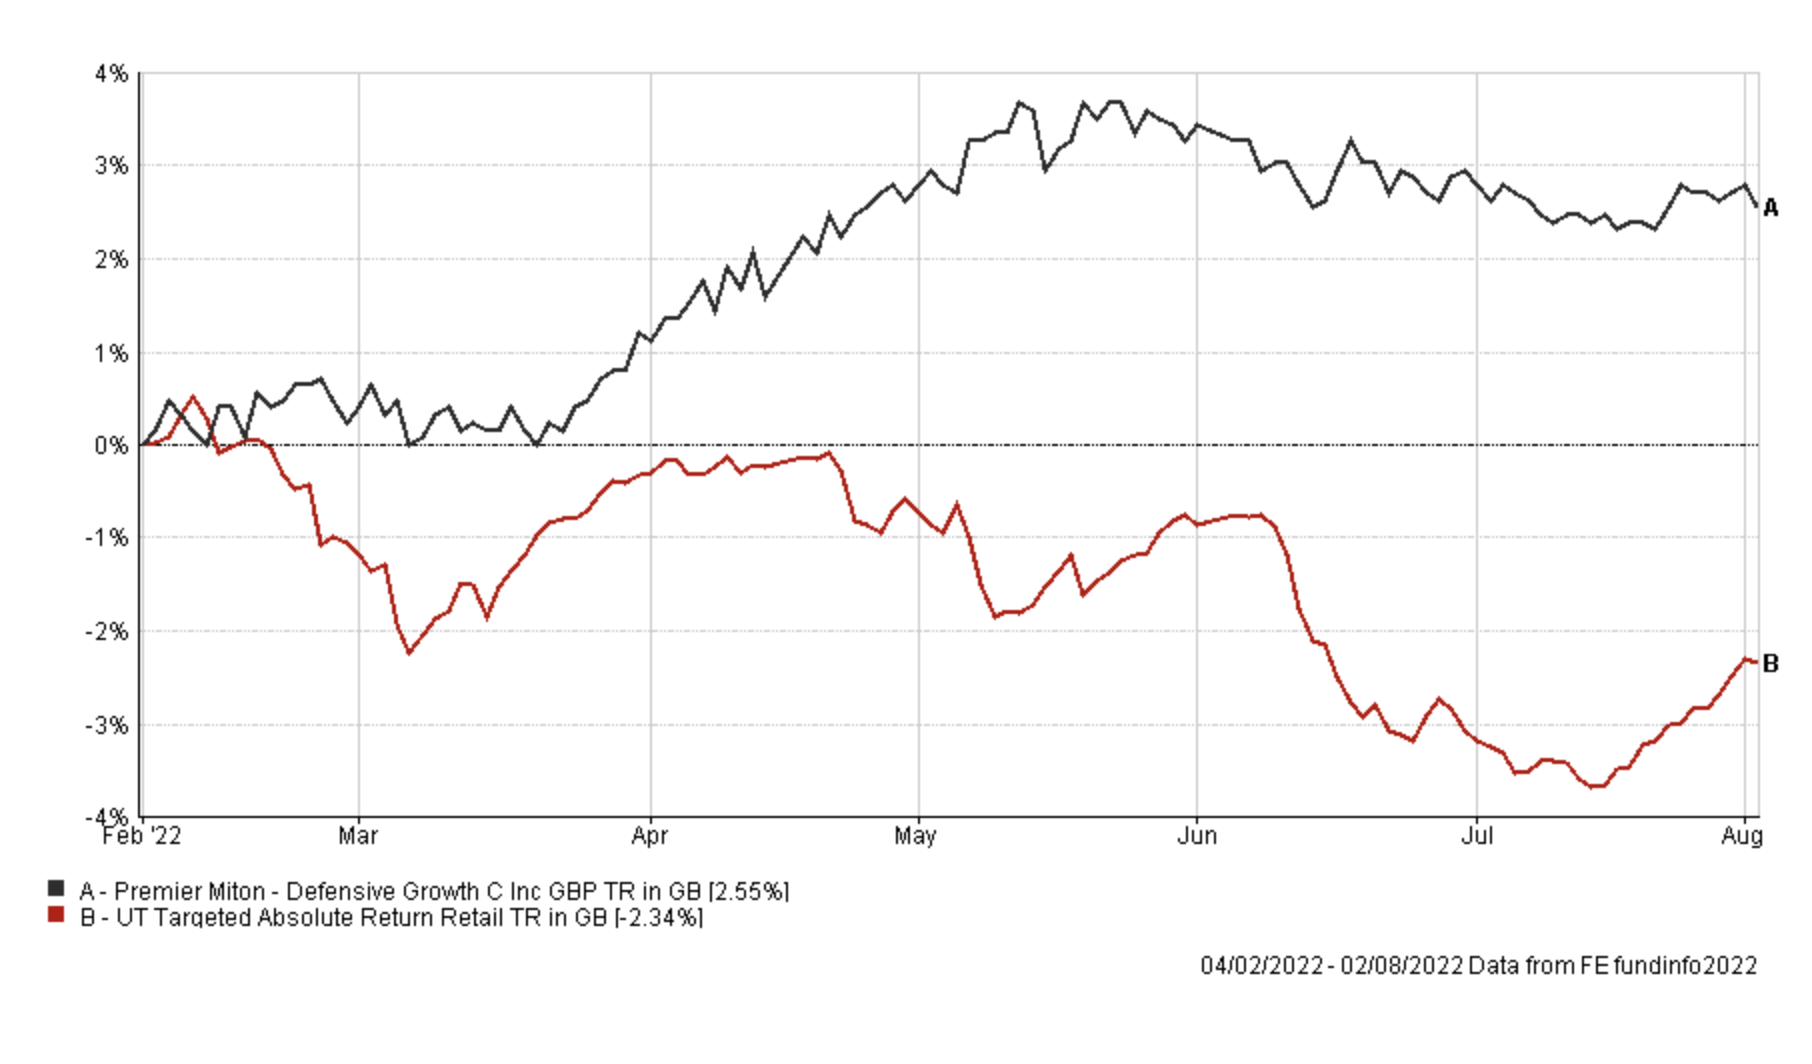
Given the Premier Miton fund makes up by far the largest portion of my portfolio (almost 14%) I've decided to reduce my exposure slightly in favour of a more adventurous diversified fund, from an alternative sector. The Premier Miton fund is still a good fund, but I want to try something different.
So below I list the fund switches I am making this month, which only affect around 11% of my portfolio.
Fund switches
Below I list the fund switches I am making this month.
- 100% out of BM SVS Brooks Macdonald Defensive Capital and 100% into McInroy & Wood Balanced
- 33% out of Premier Miton Defensive Growth and 100% into McInroy & Wood Balanced
- 33% out of Invesco UK Opportunities (UK) and 100% into JOHCM Global Opportunities
In moving out of the Invesco fund and into the JOHCM fund I am backing a fund within the portfolio that is already performing well. The switch also helps reduce my over-exposure to energy stocks (and the fortunes of oil) and replaces that with defensive equity sectors within the JOHCM Global Opportunities. The fund is in the current BOTB but is also featured in my research piece "Funds for a recession". The switch also reduces my UK equity exposure to be more in line with that of the BOTB.
The switches out of BM SVS Brooks Macdonald Defensive Capital and Premier Miton Defensive Growth are to give my portfolio a bit more investment risk to stop my portfolio becoming overly cautious. By moving into the McInroy & Wood Balanced I am investing in a more adventurous fund from the BOTB with a bit more equity exposure. The new fund also does not reside in the Targeted Absolute Return sector but resides in the Mixed Investment 40-85% Shares sector, meaning that the fund is a play on bonds and equities. Of course should bonds and equities collapse, as they did at the start of the year then the fund will fare worse than those which it replaces. Overall, the three fund switches represent another tweak to my portfolio, rather than an overhaul, which helps reduce any over-exposures that I have to certain funds.
My portfolio
My portfolio now looks like this:
| Name | Allocation % (rounded) | Risk | Sector | ISIN Code |
| BlackRock Natural Resources Growth & Income | 4.00% | High | Commodity/Natural Resource | GB00B6865B79 |
| Cash | 6.50% | Low | ||
| Fidelity American Special Situations | 8.50% | Medium | North America | GB00B89ST706 |
| Fidelity Global Property | 8.00% | High | Property Other | GB00B7K2NZ09 |
| Fidelity Index US | 7.50% | High | North America | GB00BJS8SH10 |
| Invesco UK Opportunities (UK) | 5.00% | Medium | UK All Companies | GB00B1W7HM62 |
| iShares Physical Gold ETC | 5.00% | Medium | Commodity & Energy ETF | IE00B4ND3602 |
| Janus Henderson Inst Overseas Bond | 6.50% | Low | Global Bonds | GB0007673055 |
| JOHCM Global Opportunities | 10.25% | Medium | Global | GB00BJ5JMC04 |
| M&G Global Dividend | 6.50% | Medium | Global Equity Income | GB00B46J9127 |
| McInroy & Wood Balanced | 10.00% | Medium | Mixed Investment 40-85% Shares |
GB00B7RRJ163
|
| Premier Miton Defensive Growth | 9.00% | Low | Targeted Absolute Return | GB00B832BD89 |
| Thesis TM Tellworth UK Select | 5.25% | Low | Targeted Absolute Return | GB00BNY7YM73 |
| Troy Asset Management Ltd Trojan Ethical | 8.00% | Low | Flexible Investment | GB00BJP0XX17 |
The change means that my portfolio has the same number of funds as before (a total of 13) which reflects the volatile nature of markets at the moment. In addition, the low risk element of my portfolio has dropped from 45% to 35%.
My Portfolio asset mix
My portfolio asset mix still has around 60% exposure to equities. Last month's figures are shown in brackets.
-
- UK Equities 12% (15%)
- North American Equities 22% (20%)
- Asian/Emerging Market Equities 0% (0%)
- Japanese Equities 0% (0%)
- European Equities 4% (4%)
- Chinese equities 0% (0%)
- Other equity 8% (8%)
- Commodities and energy 9% (10%)
- UK Fixed Interest 0% (0%)
- Global Fixed Interest 11% (10%)
- Cash 6% (6%)
- Alternative Investment Strategies 20% (19%)
- Property 8% (8%)
Damien's higher risk and lower risk portfolios
Using the logic described in my post: Update to Damien’s alternative risk portfolios I created hypothetical higher and lower risk versions of my portfolio below:
Lower risk
| Fund | Allocation % |
| Cash | 8 |
| Fidelity American Special Situations | 11 |
| Invesco UK Opportunities (UK) | 6 |
| iShares Physical Gold ETC | 6 |
| Janus Henderson Inst Overseas Bond | 8 |
| JOHCM Global Opportunities | 13 |
| M&G Global Dividend | 8 |
| McInroy & Wood Balanced | 12 |
| Premier Miton Defensive Growth | 11 |
| Thesis TM Tellworth UK Select | 7 |
| Troy Asset Management Ltd Trojan Ethical | 10 |
Higher risk
| Fund | Allocation % |
| BlackRock Natural Resources Growth & Income | 6 |
| Fidelity American Special Situations | 13 |
| Fidelity Global Property | 12 |
| Fidelity Index US | 12 |
| Invesco UK Opportunities (UK) | 8 |
| iShares Physical Gold ETC | 8 |
| JOHCM Global Opportunities | 16 |
| M&G Global Dividend | 10 |
| McInroy & Wood Balanced | 15 |

£200 Pension Cashback Offer
Make a qualifying deposit or transfer a pension to our partner Interactive Investor.
- Deposit or transfer a pension of at least £20k and you could earn £200 cashback
- Terms and Fees apply, Capital at risk
- New & Existing customers opening a SIPP
- Offer ends 31st July 2026
Before starting your transfer, check you won't lose any valuable benefits (such as guaranteed annuity rates or a lower protected pension age) and find out what exit fees you might have to pay
