

The background to my portfolio
Back in March 2015 I decided to invest £50,000 of my own money using 80-20 Investor. The purpose was twofold, firstly to show how you can use 80-20 Investor to invest and outperform the market with only a few minutes effort every now and then. Secondly, no other investment commentator, journalist or research provider invests their own money for fear of failing. This is a sorry state of affairs and is precisely why I committed to openly running my own portfolio for 80-20 Investor members to see.
Since then I have periodically changed my portfolio using the fund suggestions provided by the 80-20 Investor algorithm and associated research. I always disclose the changes at the time they are made.
Performance update
As is usual in my portfolio reviews, the chart below shows how my portfolio has outperformed since I started the challenge in March 2015. The green line is the performance of my portfolio while the red line is the benchmark showing the average return achieved by professional fund managers given the same asset mix. To accurately calculate this I have used the average return for each sector in which my portfolio invested. The blue line shows what the average multi-asset fund with comparable equity content achieved. In other words, the red line would show the extra performance added by just the asset mix of my portfolio (where I was invested i.e European equities etc) over picking a typical multi-asset fund (the blue line). While the green line (which is my actual performance) shows the impact of being in the right funds at the right time, as identified by the 80-20 Investor algorithm.
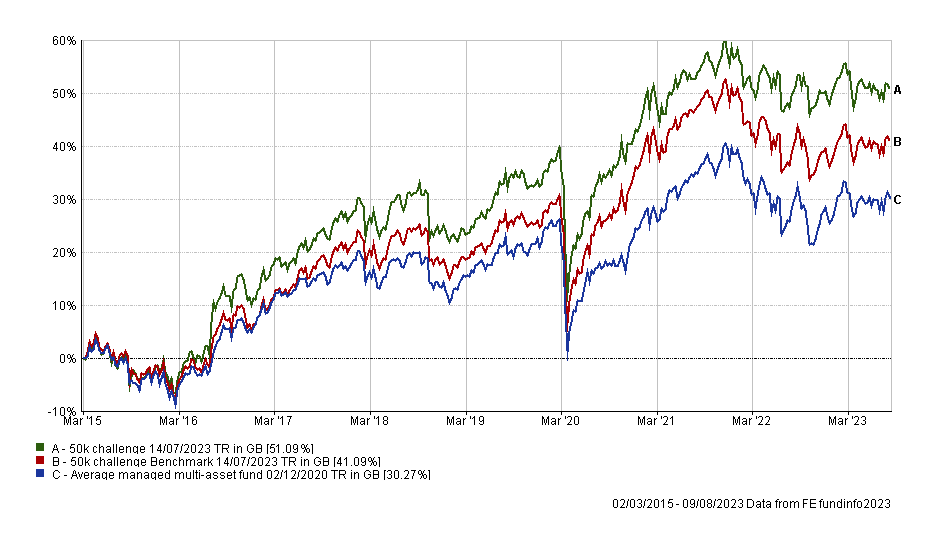
As the chart above shows, my portfolio continues to outperform its benchmarks over the last 8 years. Since my last review, my portfolio has marginally underperformed its benchmarks, largely due to its lower US technology stock exposure.
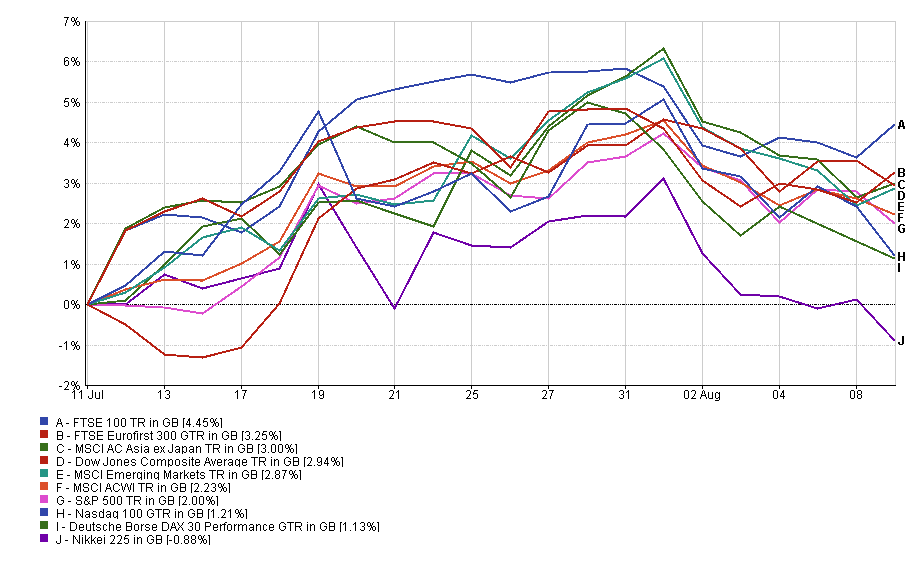
Before I move on to looking at the performance of individual funds within my portfolio it's worth looking at the chart below which shows the return for key stock markets since my last review, which takes into account the weaker pound as well. Or in other words, the chart is reflective of what UK investors experienced when investing in equities over the last month. It is almost the reverse of what we saw the month before, but only because of a shift in regime at the start of August, which is something I will cover in this week's newsletter. It is way too early to say whether this move is going to morph into a more established trend, where Japanese equities and US tech stocks become laggards. Of course, the latter has been due a breather, after the stellar rally that included an almost 10% rise in the Nasdaq 100 during June. August has so far been less kind to tech stocks and we've already seen stop loss alerts being issued on the two tech-focused funds within August's BOTB.
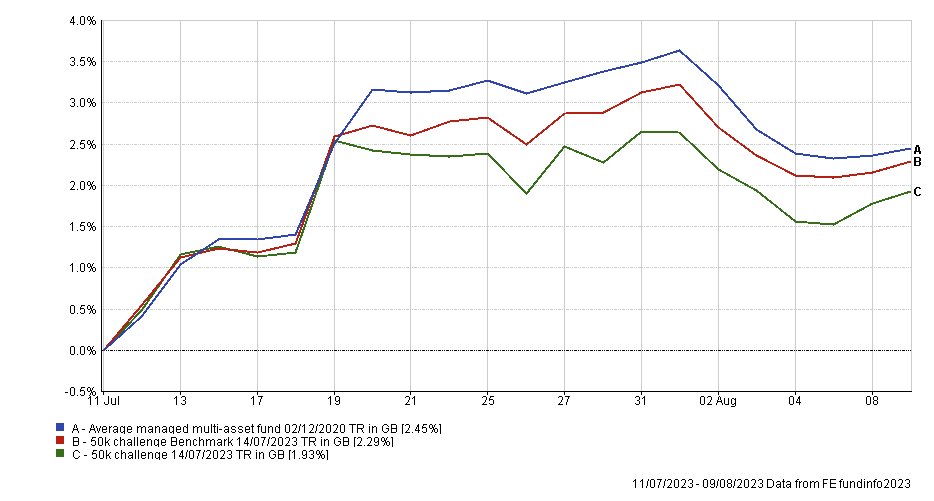
With the above chart in mind, the table below shows the individual performance of each fund in my portfolio since the 11th July (when I carried out my last review).
|
Fund |
Performance % since last review on 11th July |
| TB Saracen Global Income and Growth | 5.33 |
| Fundsmith Equity | 3.66 |
| Troy Asset Management Ltd Trojan Global Equity | 3.19 |
| BNY Mellon Multi-Asset Balanced | 2.48 |
| CT European Select | 2.00 |
| M&G Global Dividend | 1.95 |
| TB Evenlode Global Income | 1.65 |
| Fidelity Index Japan | 1.56 |
| abrdn High Yield Bond | 1.36 |
| iShares Physical Gold ETC | 0.70 |
| BNY Mellon Global Dynamic Bond | 0.51 |
| Cash | 0.24 |
| Thesis TM Tellworth UK Select | -0.4 |
Before I get into any fund changes I will make this month, as usual the table below shows which funds within my portfolio are in the current BOTB or BFBS tables and which are not. Those funds in blue are still in the BOTB while those in orange are not in the BOTB but remain in the BFBS list. Meanwhile, any funds in red have dropped out of both shortlists.
| Fund | Allocation | Risk | Sector | ISIN |
| abrdn High Yield Bond | 12 | Low | Sterling High Yield |
GB00B79RR984
|
| BNY Mellon Global Dynamic Bond | 8.5 | Low | Targeted Absolute Return | GB00B8K10865 |
| BNY Mellon Multi-Asset Balanced | 6 | Medium | Mixed Investment 40-85% Shares | GB00B8K9JZ06 |
| Cash | 7.5 | Low | ||
| CT European Select | 8.5 | High | Europe Excluding UK | GB0001529345 |
| Fidelity Index Japan | 5 | Medium | Japan |
GB00BHZK8872
|
| Fundsmith Equity | 10 | Medium | Global |
GB00B4Q5X527
|
| iShares Physical Gold ETC | 5 | Medium | Commodity & Energy ETF | IE00B4ND3602 |
| M&G Global Dividend | 7 | Medium | Global Equity Income | GB00B46J9127 |
| TB Evenlode Global Income | 7 | Medium | Global Equity Income |
GB00BF1QMV61
|
| TB Saracen Global Income & Growth | 9.5 | Medium | Global Equity Income | GB00B5B35X02 |
| Thesis TM Tellworth UK Select | 5.5 | Low | Targeted Absolute Return |
GB00BNY7YM73
|
| Troy Asset Management Ltd Trojan Global Equity | 8.5 | Medium | Global | GB00B0ZJ5S47 |
Only 2 funds have fallen out of the BOTB and BFBS tables and are coloured in red. These are:
- Fundsmith Equity
- M&G Global Dividend
In my last portfolio review I made a decision to retain two of the funds that had fallen out of the BOTB and BFBS tables at that point. They were Fundsmith Equity and BNY Mellon Multi-Asset Balanced. I kept the latter due to it being a new position in my portfolio (it has also subsequently entered the latest Consistent funds list) , while I kept Fundsmith Equity because it was the strongest performer in my portfolio during June and had only just fallen out of the 80-20 Investor tables at that point. Both decisions were rewarded with both funds being among my most profitable during July/August (see earlier table). Fundsmith Equity in particular performed well and was among the top 25% of all global equity funds, out of a possible 241, for performance during the period.
So yet again while the fund remains on my watchlist I am loathed to change the fund at this point, especially given the volatility we are seeing in equity markets at the moment and the change in sector leadership at the start of August. In addition, its turnaround in momentum sees it now sit just outside of the BFBS shortlist for the global sector so it may well regain a place in the shortlist if its recent form continues into the coming weeks.
If we look at my portfolio as a whole versus the performance of professionally managed funds within the Mixed Investment 40-85% Shares sector then it would be in the top 10% of performers so far in the month of August. This is quite a turnaround from the slightly lacklustre performance during the second half of July. While I don't place too much emphasis on such short time frames, it goes to show that we are seeing some turbulence in momentum right now, not just at an index level but also sector level which has favoured my portfolio's slightly greater exposure to defensive sectors compared to the wider stock market indices and many professionally managed funds. Or in other words, my portfolio's resilience so far in August is not just a function of its lower equity exposure compared to the majority of funds within the Mixed Investment 40-85% Shares sector.
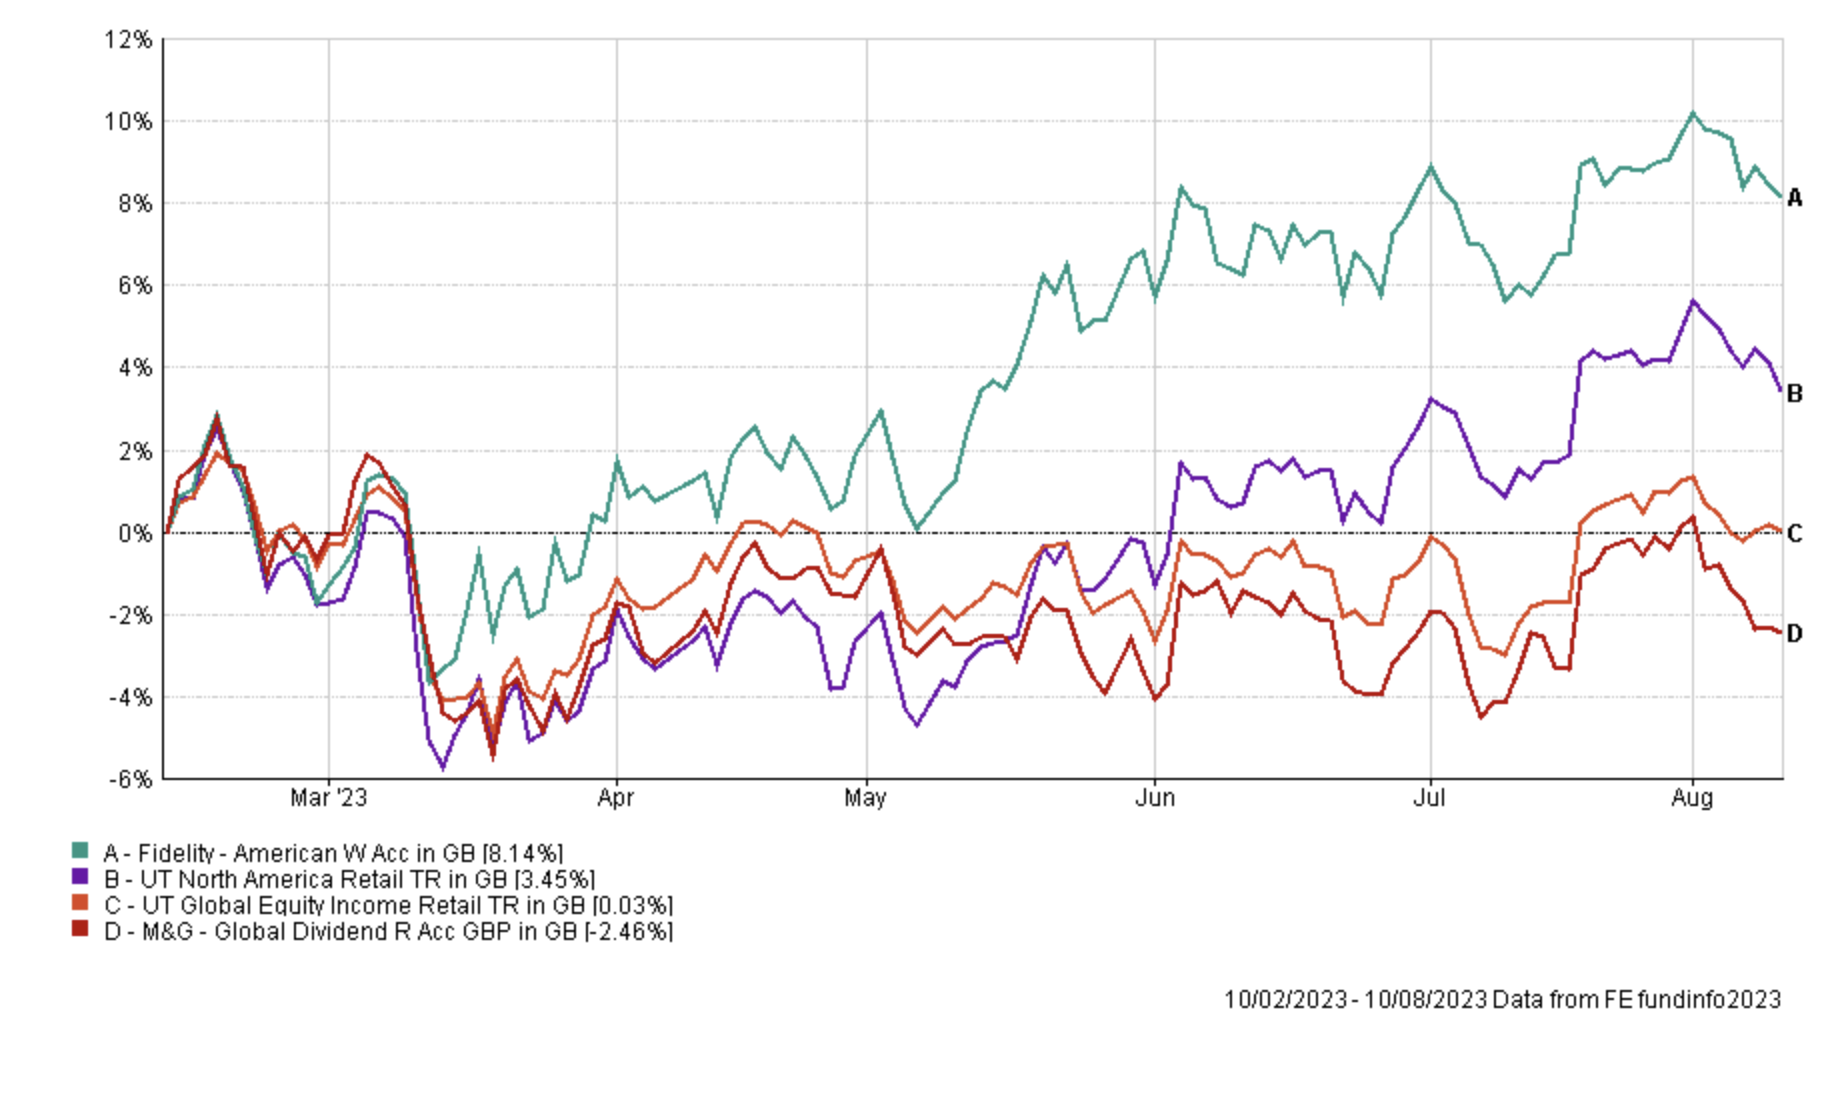
Heading into this month I planned to increase my portfolio's US equity exposure to be more in line with that of the BOTB. More specifically I planned to increase my US tech stock exposure based on the strong momentum within that sector. However, given that the tech-focused funds within August's BOTB have already triggered stop loss alerts this month, ahead of this portfolio review, I have decided against investing in pure tech funds for now. Instead I will switch out of the M&G Global Dividend fund into a more growth focused (but diversified) US equity fund, namely Fidelity American. This will still increase my US tech stock exposure, but to a lesser extent than if I were to invest in funds from the Technology & Technology Innovation sector. The new fund has been a regular of the BOTB and its performance in recent months has been very strong as shown in the chart below which compares it to M&G Global Dividend as well as its peer-group average. M&G Global Dividend has shown signs of life in recent weeks but this has since evaporated.
In last month's portfolio review I also vowed to review my European equity exposure and while it has been a strong contributor to the performance of my portfolio over last month, I will slightly reduce my exposure to CT European Select in favour of the Fidelity American fund. This mirrors a trend that has been unfolding in the BOTB over the last couple of months, whereby European equity exposure is reduced in favour of US equity exposure. The chart below shows how the CT European Select fund has outperformed its peer-group average since I've held it within my portfolio, but that outperformance has started to wane.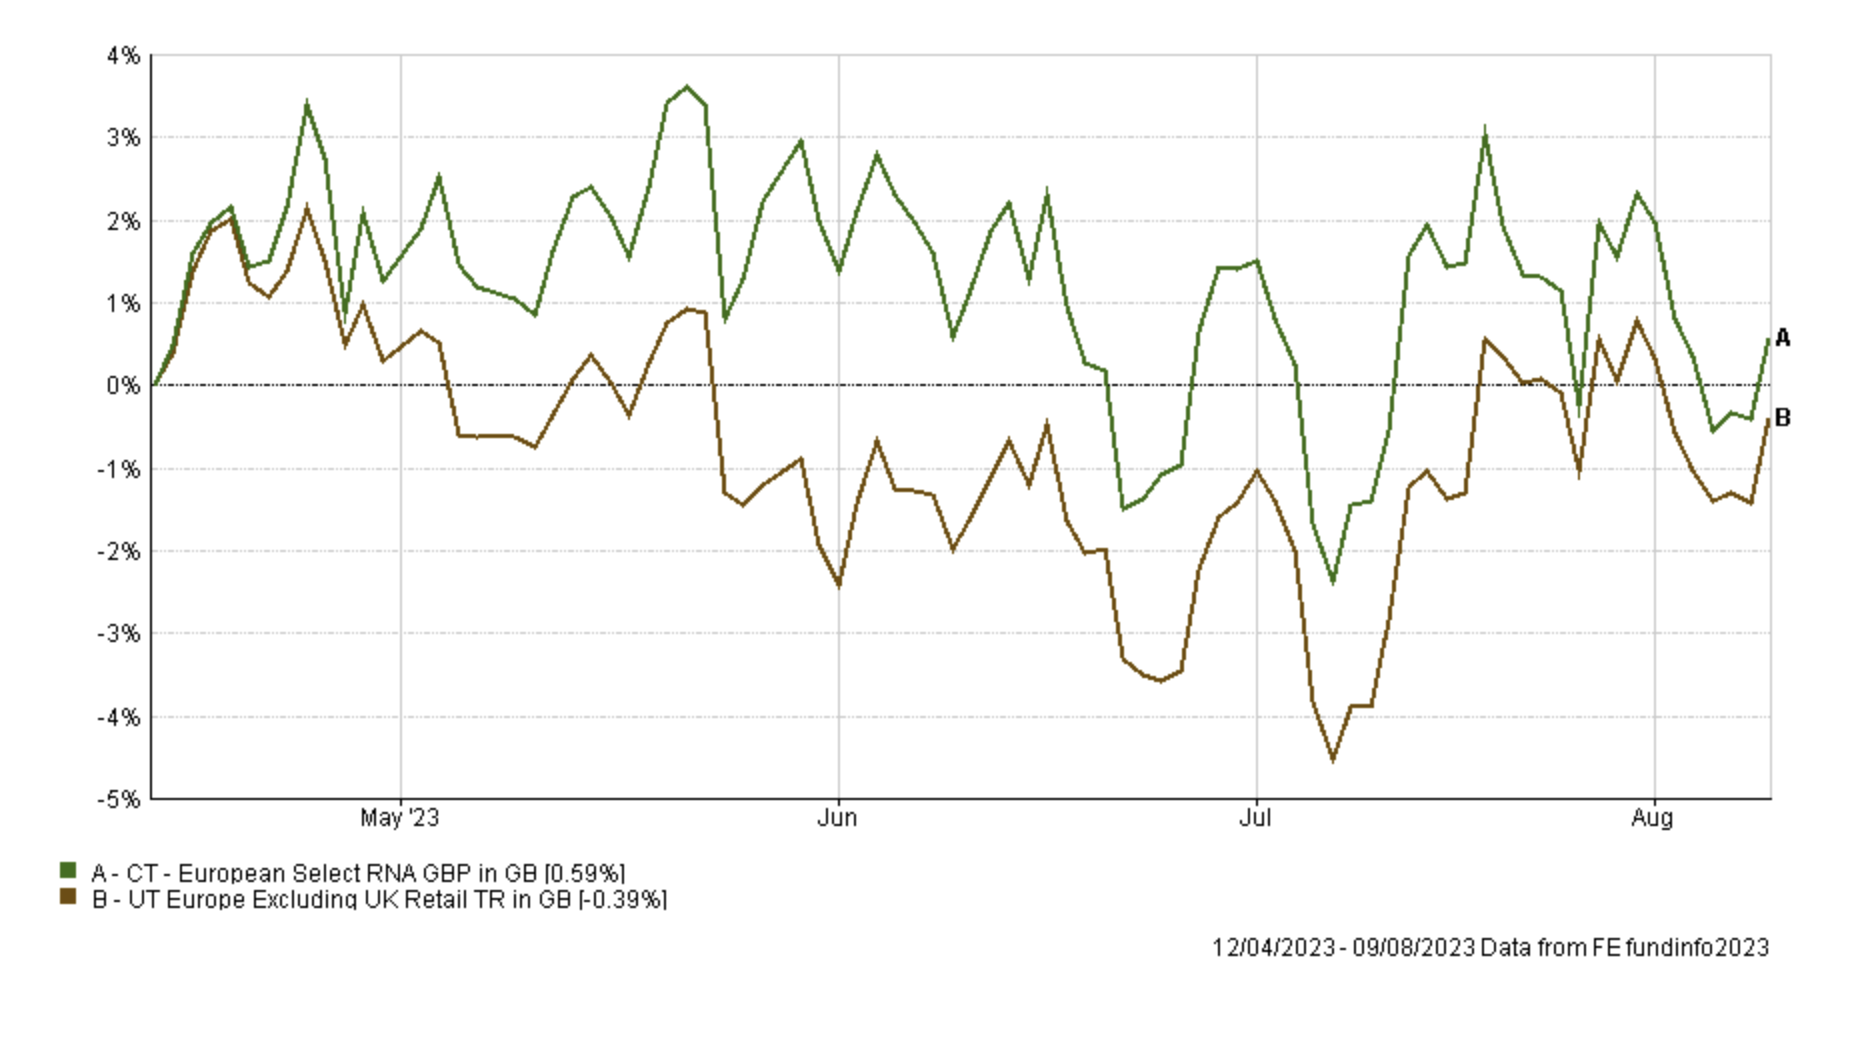
As the rest of the funds within my portfolio remain in the BOTB and BFBS tables, I will leave them be for now. At the low risk end of my portfolio I was looking to reinvest the cash I have sitting on the sidelines but the opportunities are limited right now in bonds and targeted return funds, and cash has proved a viable asset to hold as bond yields begin to rise once again.
Fund switches
- 33% out of CT European Select and 100% into Fidelity American
- 100% out of M&G Global Dividend and 100% into Fidelity American
The fund changes mean that the number of holdings within my portfolio will remain the same. The switches only impact approximately 10% of my portfolio while slightly reducing my portfolio's equity exposure from 64 to 62%.
My portfolio
My portfolio now looks like this:
| Fund | Allocation | Risk | Sector | ISIN |
| abrdn High Yield Bond | 12 | Low | Sterling High Yield |
GB00B79RR984
|
| BNY Mellon Global Dynamic Bond | 8.5 | Low | Targeted Absolute Return | GB00B8K10865 |
| BNY Mellon Multi-Asset Balanced | 6 | Medium | Mixed Investment 40-85% Shares | GB00B8K9JZ06 |
| Cash | 7 | Low | ||
| CT European Select | 6 | High | Europe Excluding UK | GB0001529345 |
| Fidelity American | 10 | Medium | North America |
GB00B8GPC429
|
| Fidelity Index Japan | 5 | Medium | Japan |
GB00BHZK8872
|
| Fundsmith Equity | 10 | Medium | Global |
GB00B4Q5X527
|
| iShares Physical Gold ETC | 5 | Medium | Commodity & Energy ETF | IE00B4ND3602 |
| TB Evenlode Global Income | 7 | Medium | Global Equity Income |
GB00BF1QMV61
|
| TB Saracen Global Income & Growth | 9.5 | Medium | Global Equity Income | GB00B5B35X02 |
| Thesis TM Tellworth UK Select | 5.5 | Low | Targeted Absolute Return |
GB00BNY7YM73
|
| Troy Asset Management Ltd Trojan Global Equity | 8.5 | Medium | Global | GB00B0ZJ5S47 |
My Portfolio asset mix
My portfolio asset mix has around 62% exposure to equities. Last month's figures are shown in brackets.
-
- UK Equities 10% (11%)
- North American Equities 28% (23%)
- Asian/Emerging Market Equities 0% (0%)
- Japanese Equities 5% (6%)
- European Equities 16% (20%)
- Chinese equities 0% (0%)
- Other equity 3% (4%)
- Commodities and energy 5% (5%)
- UK Fixed Interest 0% (0%)
- Global Fixed Interest 20% (20%)
- Cash 8% (8%)
- Alternative Investment Strategies 5% (3%)
- Property 0% (0%)
Damien's higher risk and lower risk portfolios
Using the logic described in my post: Update to Damien’s alternative risk portfolios I created hypothetical higher and lower risk versions of my portfolio below:
Lower risk
| Fund | Allocation % |
| abrdn High Yield Bond | 13 |
| BNY Mellon Global Dynamic Bond | 9 |
| BNY Mellon Multi-Asset Balanced | 6 |
| Cash | 7 |
| Fidelity Index Japan | 5 |
| Fundsmith Equity | 11 |
| iShares Physical Gold ETC | 5 |
| Fidelity American | 11 |
| TB Evenlode Global Income | 8 |
| TB Saracen Global Income & Growth | 10 |
| Thesis TM Tellworth UK Select | 6 |
| Troy Asset Management Ltd Trojan Global Equity O Acc | 9 |
Higher risk
| Fund | Allocation % |
| BNY Mellon Multi-Asset Balanced | 9 |
| CT European Select | 9 |
| Fidelity Index Japan | 8 |
| Fundsmith Equity | 15 |
| iShares Physical Gold ETC | 7 |
| Fidelity American | 15 |
| TB Evenlode Global Income | 10 |
| TB Saracen Global Income & Growth | 14 |
| Troy Asset Management Ltd Trojan Global Equity O Acc | 13 |

£200 Pension Cashback Offer
Make a qualifying deposit or transfer a pension to our partner Interactive Investor.
- Deposit or transfer a pension of at least £20k and you could earn £200 cashback
- Terms and Fees apply, Capital at risk
- New & Existing customers opening a SIPP
- Offer ends 31st July 2026
Before starting your transfer, check you won't lose any valuable benefits (such as guaranteed annuity rates or a lower protected pension age) and find out what exit fees you might have to pay
