

The background to my portfolio
Back in March 2015 I decided to invest £50,000 of my own money using 80-20 Investor. The purpose was twofold, firstly to show how you can use 80-20 Investor to invest and outperform the market with only a few minutes effort every now and then. Secondly, no other investment commentator, journalist or research provider invests their own money for fear of failing. This is a sorry state of affairs and is precisely why I committed to openly running my own portfolio for 80-20 Investor members to see.
Since then I have periodically changed my portfolio using the fund suggestions provided by the 80-20 Investor algorithm and associated research. I always disclose the changes at the time they are made.
Performance update
As is usual in my portfolio reviews, the chart below shows how my portfolio has outperformed since I started the challenge in March 2015, which is over seven years ago. The green line is the performance of my portfolio while the red line is the benchmark showing the average return achieved by professional fund managers given the same asset mix. To accurately calculate this I have used the average return for each sector in which my portfolio invested. The blue line shows what the average multi-asset fund with comparable equity content achieved. In other words, the red line would show the extra performance added by just the asset mix of my portfolio (where I was invested i.e European equities etc) over picking a typical multi-asset fund (the blue line). While the green line (which is my actual performance) shows the impact of being in the right funds at the right time, as identified by the 80-20 Investor algorithm.
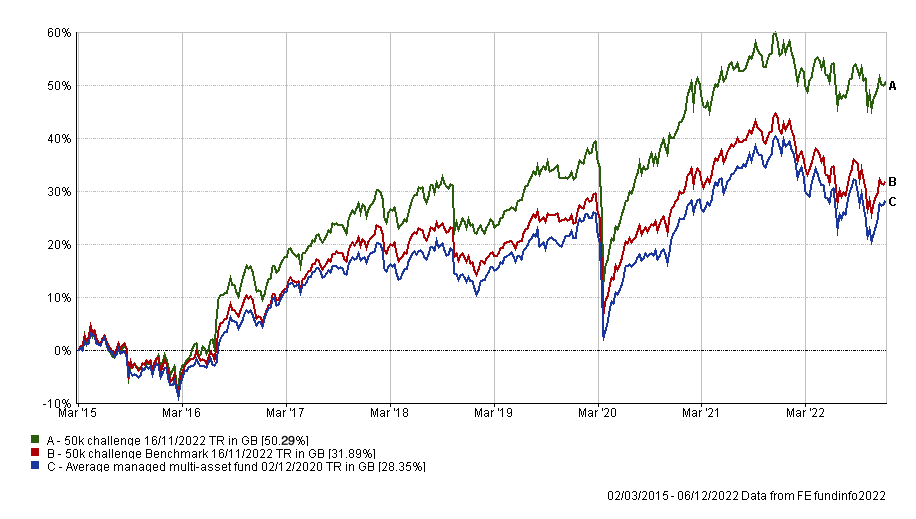
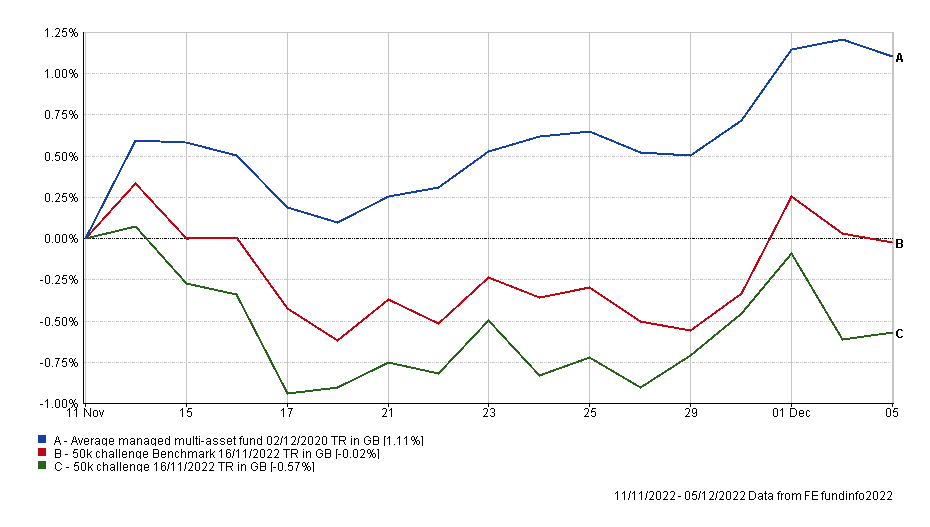
My portfolio continues to outperform its benchmarks over the long term but since my last update in November my £50k portfolio has lagged its benchmarks as shown below.
Taking a closer look at the funds within my portfolio, the table below shows the individual performance of each holding in my portfolio since my last review on 11th November.
|
Fund |
Performance since last review on 11th November to 5th December |
| Invesco UK Opportunities (UK) | 3.61 |
| Thesis TM BennBridge UK Select | 0.85 |
| JOHCM Global Opportunities | 0.54 |
| Cash | 0.15 |
| Jupiter Global Value Equity | 0.14 |
| BlackRock Natural Resources Growth & Income | -0.25 |
| M&G Global Dividend | -0.41 |
| Premier Miton Defensive Growth | -0.56 |
| Janus Henderson Inst Overseas Bond | -1.17 |
| McInroy & Wood Balanced | -1.17 |
| Fidelity Index US | -1.75 |
| iShares Physical Gold ETC | -2.67 |
| Fidelity American Special Situations | -3.31 |
In December's monthly newsletter I highlighted how November's performance rankings were almost the complete reverse of those for January to October. Assets which had struggled in 2022 up until the end of October were the top performers in November and vice versa.
It explains why my portfolio underperformed its benchmarks during November. Bond and equity market moves were aggressive but things were also compounded by the sudden weakening of the US dollar. This was also a headwind for my portfolio, which has previously benefited whenever the dollar strengthened against the pound.
It meant that any funds within my portfolio with US equity or bond exposure struggled, as the pound rallied more than 8% against the US dollar from its November low. Unsurprisingly these funds prop up the performance table above. At the other end of the scale my holdings with limited overseas currency exposure, namely Invesco UK Opportunities (UK) and my cash holding fared the best.
As usual, the table below shows which funds within my portfolio are in the current BOTB or BFBS tables and which are not. Those funds in blue are still in the BOTB while those in orange are not in the BOTB but remain in the BFBS list. Meanwhile, any funds in red have dropped out of both shortlists.
| Name | Allocation % (rounded) | Risk | Sector | ISIN Code |
| BlackRock Natural Resources Growth & Income | 4.50% | High | Commodity/Natural Resource | GB00B6865B79 |
| Cash | 6.50% | Low | ||
| Fidelity American Special Situations | 9.00% | Medium | North America | GB00B89ST706 |
| Fidelity Index US | 7.50% | High | North America | GB00BJS8SH10 |
| Invesco UK Opportunities (UK) | 5.00% | Medium | UK All Companies | GB00B1W7HM62 |
| iShares Physical Gold ETC | 5.00% | Medium | Commodity & Energy ETF | IE00B4ND3602 |
| Janus Henderson Inst Overseas Bond | 9.00% | Low | Global Bonds | GB0007673055 |
| JOHCM Global Opportunities | 10.25% | Medium | Global | GB00BJ5JMC04 |
| Jupiter Global Value Equity | 9.75% | Medium | Global | GB00BF5DRF26 |
| M&G Global Dividend | 7.00% | Medium | Global Equity Income | GB00B46J9127 |
| McInroy & Wood Balanced | 12.00% | Medium | Mixed Investment 40-85% Shares |
GB00B7RRJ163
|
| Premier Miton Defensive Growth | 9.00% | Low | Targeted Absolute Return | GB00B832BD89 |
| Thesis TM Tellworth UK Select | 5.50% | Low | Targeted Absolute Return | GB00BNY7YM73 |
You can see that only two funds are now in the BOTB, with three others in the BFBS. It means that six have dropped out of the 80-20 Investor tables altogether, but that of course doesn't suddenly make them bad funds. The shift has been a result of the market upheaval which we saw in the second half of November. While it was significant in scale, we have yet to see whether a sustainable trend emerges.
With markets continuing to be volatile, I will therefore continue to keep changes to a minimum, while waiting for a trend to establish. After all, we've seen a number of similar pivots already this year, which ultimately failed. As I write, some of the equity market exuberance we've seen since the lower than expected US inflation data in mid-November has abated. That is not to say we won't have a Santa Rally, but I will stick to the process and not focus on short-term market moves.
Of those funds that have fallen out of the 80-20 Investor tables (those in red), four had already suffered the same fate last month. These funds are
- Invesco UK Opportunities (UK)
- Fidelity Index US
- JOHCM Global Opportunities
- M&G Global Dividend
So initially that is where I am going to focus my attention. Both Premier Miton Defensive Growth and Fidelity American Special Situations (the other funds in red) were in the 80-20 Investor tables as recently as last month, so I will leave them for the time being. If I were to replace all of the funds that are currently not in the 80-20 Investor shortlists I would be switching 50% of my portfolio, which seems not only rash but, given the volatility in equity markets right now, also risky.
The chart below shows the performance of the Invesco UK Opportunities fund versus its peer group average since I first held it back in January.
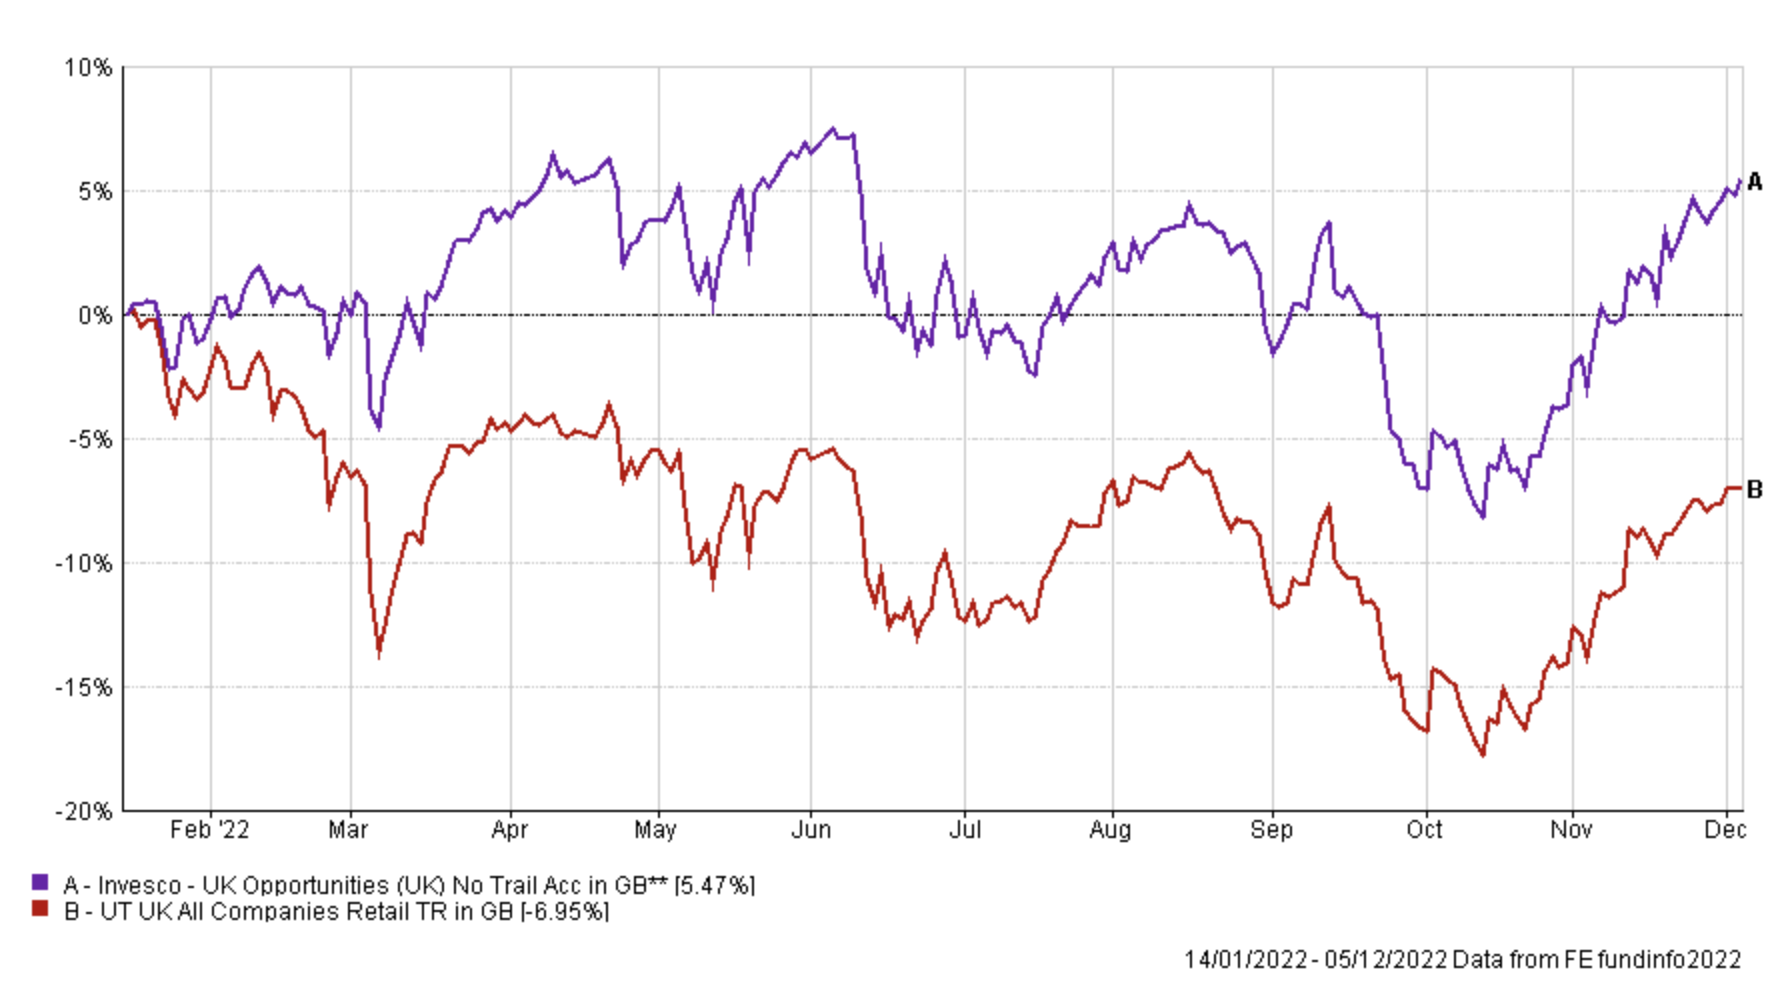
You can see that the performance of the fund has been outstanding overall but its momentum stalled during the summer, along with the rest of its peer group (in red) and by September it was on my watchlist. But the bouts of extreme market volatility meant that the fund was given a stay of execution, which with the benefit of hindsight was a good thing. It's been 3 months since the fund has been in the 80-20 Investor tables, a longer period of absence than any of the other funds within my portfolio that are currently missing from the 80-20 Investor tables. While the original research behind the development of 80-20 Investor allows for funds to be held for up to 6 months, I plan to change this fund for the TB Evenlode Income fund, which is in the current BOTB list. As the chart below shows, while the performance of the Invesco fund has been stronger over the last month, it's had a wild ride since the summer, recouping some heavy losses.
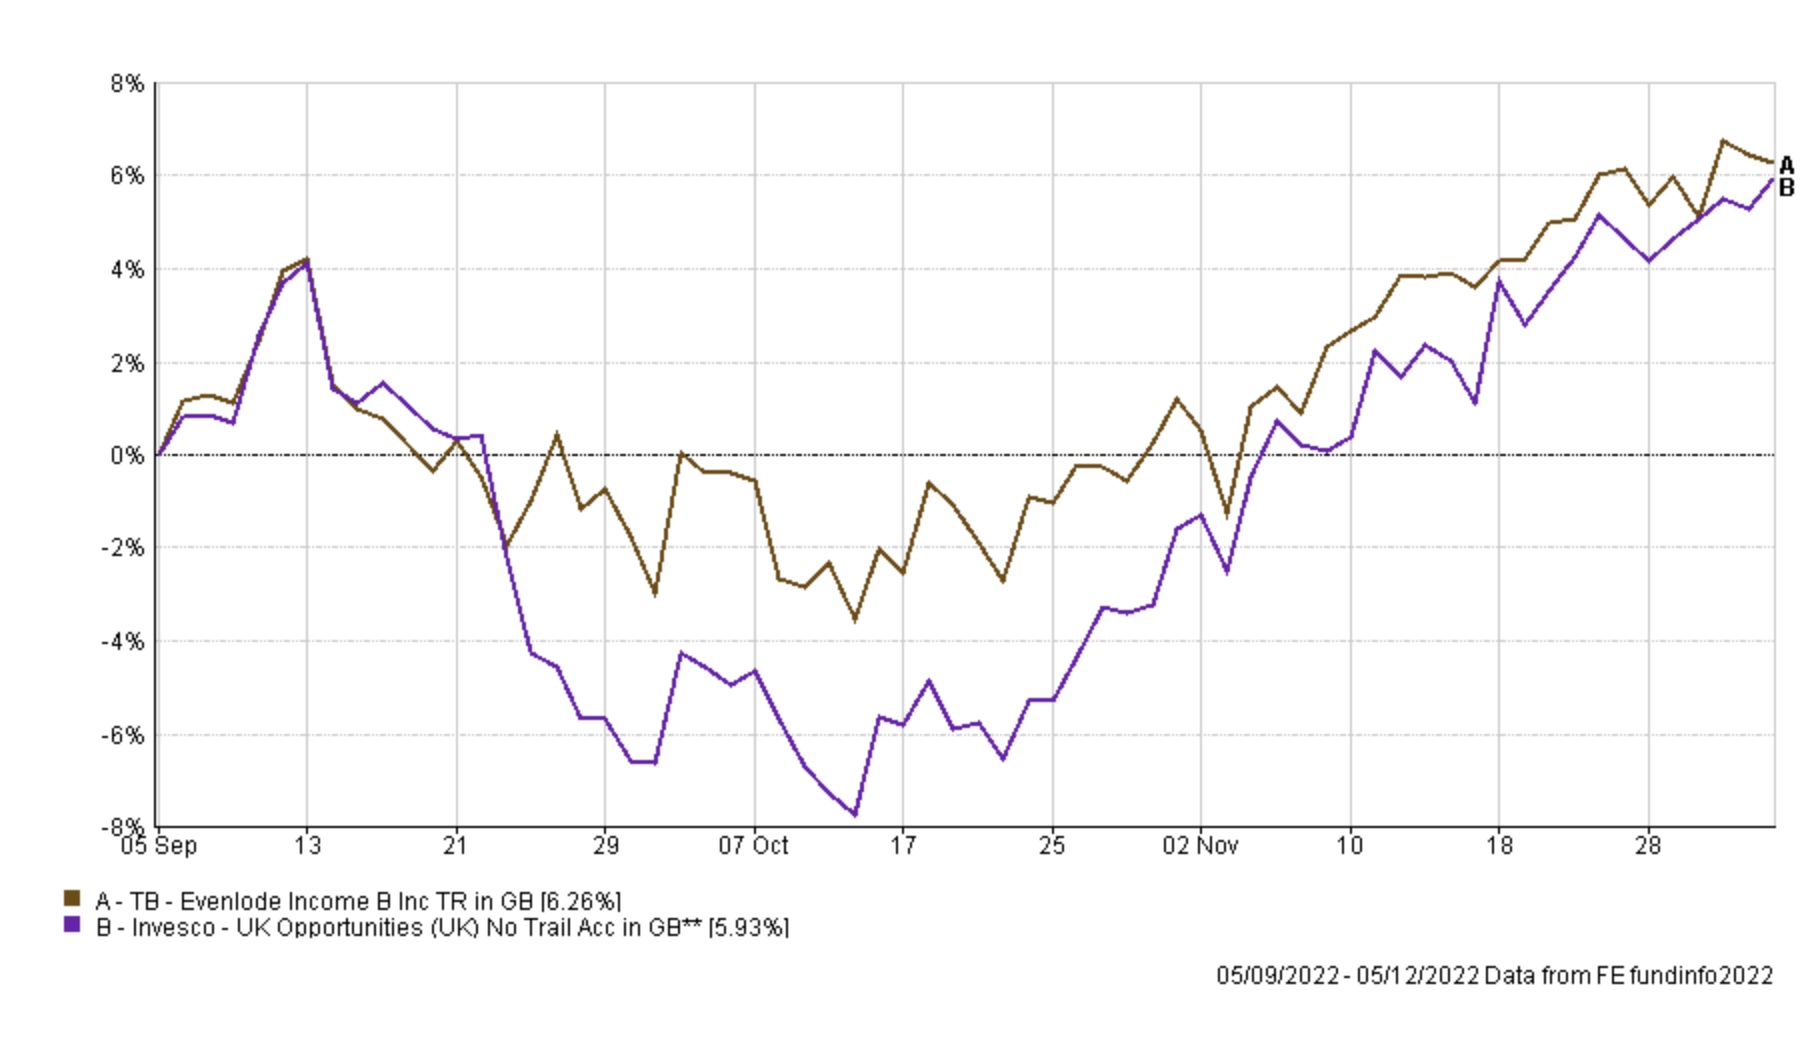
The big difference between the funds is that the Evenlode fund is more defensively positioned, with greater exposure to defensive sectors such as Consumer Staples. Ultimately I am just replacing one UK equity fund for another.
Elsewhere, a case could be made for ditching each of the other three funds that have failed to make the 80-20 Investor shortlists both in November and December, namely Fidelity Index US, JOHCM Global Opportunities and M&G Global Dividend.
Fidelity Index US is simply a US tracker fund and it's been performing in line with its peer group average, as you'd expect. While I want to switch out of the fund into alternative opportunities, volatility in US equity markets has been elevated once again. The US stock market has fallen almost 1.5% as I write this. Like my other US equity fund (Fidelity American Special Situations) its performance has been hampered by the rally in the value of the pound but it has still performed in line with its peer-group average. However, what I plan to do is sell out of the fund (which accounts for 7.38% of my portfolio) and invest my current cash allocation (which is slightly less at 6.61%). That way the transaction will occur on the same day and I should not be out of the market. It will of course mean my cash holding will eventually rise slightly (to 7.38%), once the transactions are complete, but this will still be in line with the BOTB's cash allocation.
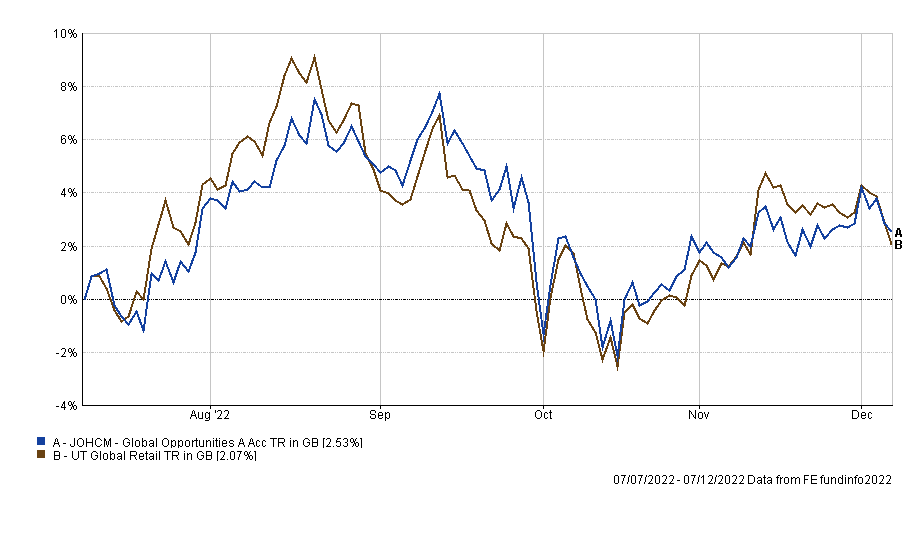
Finally, I plan to reduce my allocation to JOHCM Opportunities because it is the largest equity fund holding in my portfolio and while its performance has not been bad, in fact it's been in line with its peer group average, it's not setting the world on fire. The chart below shows the performance of the fund since I first invested in it back in July. I plan to introduce some emerging Asian equity exposure into my portfolio via FSSA Asia Focus which is in this month's BOTB.
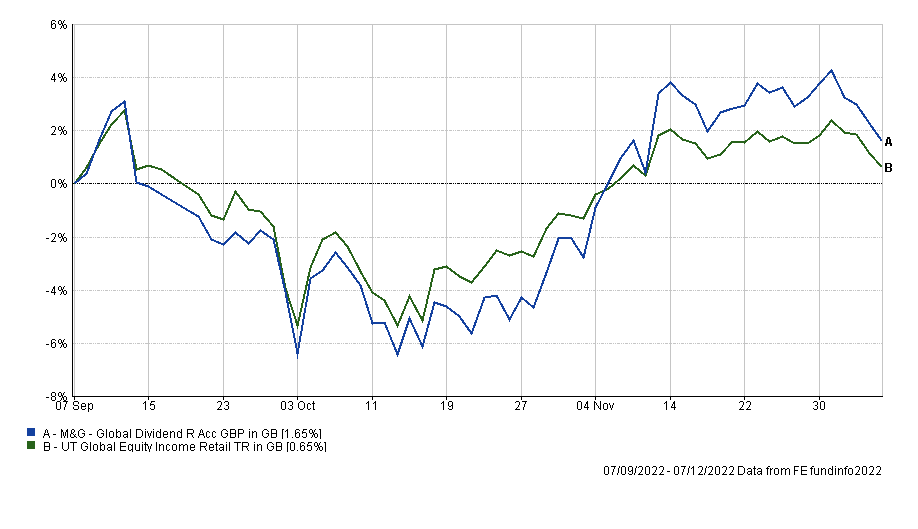
These planned transactions will impact almost 18% of my portfolio, which I feel is sufficient in the current circumstances. Tweaking my portfolio rather than tearing it up has been beneficial throughout 2022, so I plan to maintain that approach for now. Therefore I will keep the M&G Global Dividend fund for the time being especially as it has marginally outperformed its peer group average in recent months as shown below.
Fund switch
- 100% out of my existing cash allocation and into BNY Mellon Global Income
- 100% out of Fidelity Index US and 100% into Cash
- 100% out of Invesco UK Opportunities and 100% in TB Evenlode Income
- 50% out of JOHCM Global Opportunities and 100% into FSSA Asia Focus
By making the switches above I am splitting the proceeds across global equities that are in this month's BOTB and introducing an emerging Asian equity exposure to my portfolio.
My portfolio
My portfolio now looks like this:
| Fund | Allocation | Risk | Sector | ISIN |
| BlackRock Natural Resources Growth & Income | 4.5 | High | Commodity/Natural Resource | GB00B6865B79 |
| BNY Mellon Global Income | 6.5 | Medium | Global Equity Income |
GB00B7XK5M25
|
| Cash | 7 | Low | ||
| Fidelity American Special Situations | 8.5 | Medium | North America | GB00B89ST706 |
| FSSA Asia Focus | 5.5 | High | Asia Pacific Excluding Japan |
GB00BWNGXJ86
|
| iShares Physical Gold ETC | 5 | Medium | Commodity & Energy ETF | IE00B4ND3602 |
| Janus Henderson Inst Overseas Bond | 9 | Low | Global Bonds | GB0007673055 |
| JOHCM Global Opportunities | 5.5 | Medium | Global | GB00BJ5JMC04 |
| Jupiter Global Value Equity | 10 | Medium | Global | GB00BF5DRF26 |
| M&G Global Dividend | 7 | Medium | Global Equity Income | GB00B46J9127 |
| McInroy & Wood Balanced | 12 | Medium | Mixed Investment 40-85% Shares | GB00B7RRJ163 |
| Premier Miton Defensive Growth | 9 | Low | Targeted Absolute Return | GB00B832BD89 |
| TB Evenlode Income | 5 | Medium | UK All Companies | GB00BD0B7D55 |
| Thesis TM Tellworth UK Select | 5.5 | Low | Targeted Absolute Return | GB00BNY7YM73 |
My Portfolio asset mix
My portfolio asset mix has around 59% exposure to equities. Last month's figures are shown in brackets.
-
- UK Equities 14% (13%)
- North American Equities 15% (23%)
- Asian/Emerging Market Equities 6% (0%)
- Japanese Equities 0% (1%)
- European Equities 7% (7%)
- Chinese equities 0% (0%)
- Other equity 12% (11%)
- Commodities and energy 9% (9%)
- UK Fixed Interest 0% (0%)
- Global Fixed Interest 10% (10%)
- Cash 7% (7%)
- Alternative Investment Strategies 20% (19%)
- Property 0% (0%)
Damien's higher risk and lower risk portfolios
Using the logic described in my post: Update to Damien’s alternative risk portfolios I created hypothetical higher and lower risk versions of my portfolio below:
Lower risk
| Fund | Allocation % |
| BNY Mellon Global Income | 7 |
| Cash | 8 |
| Fidelity American Special Situations | 9 |
| iShares Physical Gold ETC | 6 |
| Janus Henderson Inst Overseas Bond | 10 |
| JOHCM Global Opportunities | 6 |
| Jupiter Global Value Equity | 11 |
| M&G Global Dividend | 8 |
| McInroy & Wood Balanced | 13 |
| Premier Miton Defensive Growth | 10 |
| TB Evenlode Income | 6 |
| Thesis TM Tellworth UK Select | 6 |
Higher risk
| Fund | Allocation % |
| BlackRock Natural Resources Growth & Income | 7 |
| BNY Mellon Global Income | 10 |
| Fidelity American Special Situations | 12 |
| FSSA Asia Focus | 8 |
| iShares Physical Gold ETC | 7 |
| JOHCM Global Opportunities | 8 |
| Jupiter Global Value Equity | 14 |
| M&G Global Dividend | 10 |
| McInroy & Wood Balanced | 17 |
| TB Evenlode Income | 7 |

£200 Pension Cashback Offer
Make a qualifying deposit or transfer a pension to our partner Interactive Investor.
- Deposit or transfer a pension of at least £20k and you could earn £200 cashback
- Terms and Fees apply, Capital at risk
- New & Existing customers opening a SIPP
- Offer ends 31st July 2026
Before starting your transfer, check you won't lose any valuable benefits (such as guaranteed annuity rates or a lower protected pension age) and find out what exit fees you might have to pay
