

The background to my portfolio
Back in March 2015 I decided to invest £50,000 of my own money using 80-20 Investor. The purpose was twofold, firstly to show how you can use 80-20 Investor to invest and outperform the market with only a few minutes effort every now and then. Secondly, no other investment commentator, journalist or research provider invests their own money for fear of failing. This is a sorry state of affairs and is precisely why I committed to openly running my own portfolio for 80-20 Investor members to see.
Since then I have periodically changed my portfolio using the fund suggestions provided by the 80-20 Investor algorithm and associated research. I always disclose the changes at the time they are made.
Performance update
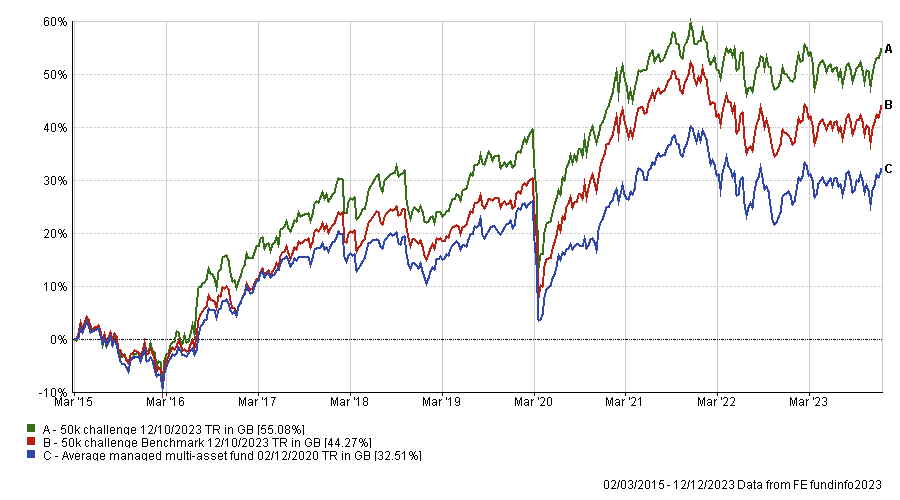
As is usual in my portfolio reviews, the chart below shows how my portfolio has outperformed since I started the challenge in March 2015. The green line is the performance of my portfolio while the red line is the benchmark showing the average return achieved by professional fund managers given the same asset mix. To accurately calculate this I have used the average return for each sector in which my portfolio invested. The blue line shows what the average multi-asset fund with comparable equity content achieved. In other words, the red line would show the extra performance added by just the asset mix of my portfolio (where I was invested i.e European equities etc) over picking a typical multi-asset fund (the blue line). While the green line (which is my actual performance) shows the impact of being in the right funds at the right time, as identified by the 80-20 Investor algorithm.
The chart shows the performance of my portfolio since my last review a month ago:
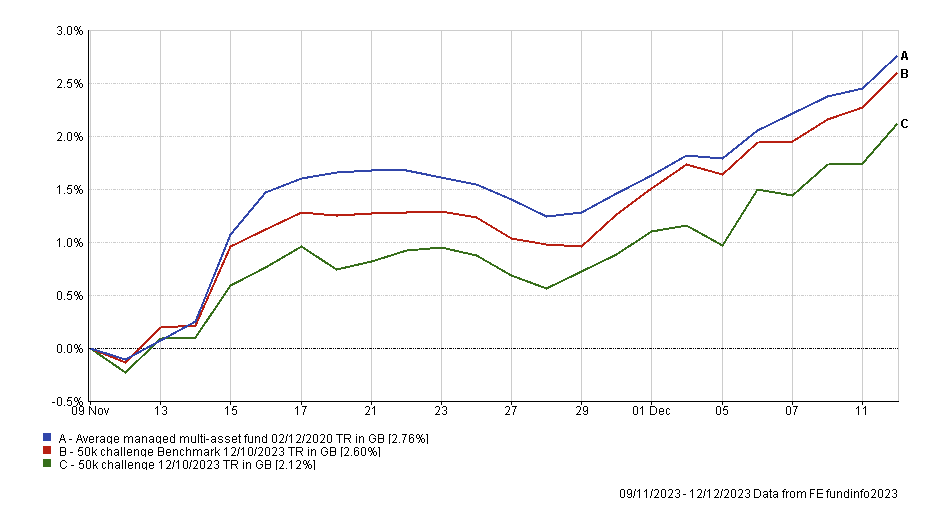
Last time I did warn that should bond markets continue to rally, following their turnaround at the start of November, then my cash holding could prove a drag on my portfolio's performance going forward. This did indeed prove to be the case, as shown by the chart above, hence why my portfolio lagged its benchmarks over the last month. However it still performed well in absolute terms.
The table below shows the performance of the individual funds within my portfolio since my last review a month ago. If you recall, last month I noted the turnaround in fortunes for a number of laggards within my portfolio during the first week of November, which included WS Saracen Global Income and Growth. Ultimately I decided to leave my portfolio unchanged as the market was in a state of flux. This proved wise given that WS Saracen Global Income and Growth went on to become the top performing fund within my portfolio over the last month, as shown in the table below.
| Name | % return over the last month (since November's review) |
| WS Saracen Global Income and Growth | 4.27 |
| Liontrust India | 3.54 |
| Troy Asset Management Ltd Trojan Global Equity | 3.4 |
| abrdn High Yield Bond | 3.26 |
| Fidelity American | 2.59 |
| T. Rowe Price US Large Cap Growth Equity | 2.53 |
| Fidelity Index Japan | 2.13 |
| L&G Global 100 Index Trust | 1.54 |
| BNY Mellon Multi-Asset Balanced | 1.49 |
| BNY Mellon Global Dynamic Bond | 0.7 |
| Cash | 0.33 |
| Thesis TM Tellworth UK Select | 0.15 |
| iShares Physical Gold ETC | -1.03 |
As usual the table below shows which funds within my portfolio are in the current BOTB or BFBS tables and which are not. Those funds in blue are still in the BOTB while those in orange are not in the BOTB but remain in the BFBS list. Meanwhile, any funds in red have dropped out of both shortlists.
| Fund | Allocation | Risk | Sector | ISIN |
| abrdn High Yield Bond | 12 | Low | Sterling High Yield |
GB00B79RR984
|
| BNY Mellon Global Dynamic Bond | 6 | Low | Targeted Absolute Return | GB00B8K10865 |
| BNY Mellon Multi-Asset Balanced | 8.5 | Medium | Mixed Investment 40-85% Shares | GB00B8K9JZ06 |
| Cash | 7 | Low | ||
| Fidelity American | 10 | Medium | North America |
GB00B8GPC429
|
| Fidelity Index Japan | 6 | Medium | Japan |
GB00BHZK8872
|
| iShares Physical Gold ETC | 5 | Medium | Commodity & Energy ETF | IE00B4ND3602 |
| T. Rowe Price US Large Cap Growth Equity | 5.5 | High | North America |
GB00BD5FHW12
|
| L&G Global 100 Index Trust | 10 | Medium | Global |
GB00B0CNH056
|
| Liontrust India | 3.5 | High | India/Indian Subcontinent |
GB00B1L6DV51
|
| Thesis TM Tellworth UK Select | 5.5 | Low | Targeted Absolute Return |
GB00BNY7YM73
|
| Troy Asset Management Ltd Trojan Global Equity | 11 | Medium | Global | GB00B0ZJ5S47 |
| WS Saracen Global Income & Growth | 10 | Medium | Global Equity Income | GB00B5B35X02 |
This month five funds have fallen outside out the BOTB and BFBS tables and are coloured in red. These are:
- Troy Asset Management Ltd Trojan Global Equity
- BNY Mellon Multi-Asset Balanced
- BNY Mellon Global Dynamic Bond
- Fidelity American
- L&G Global 100 Index Trust
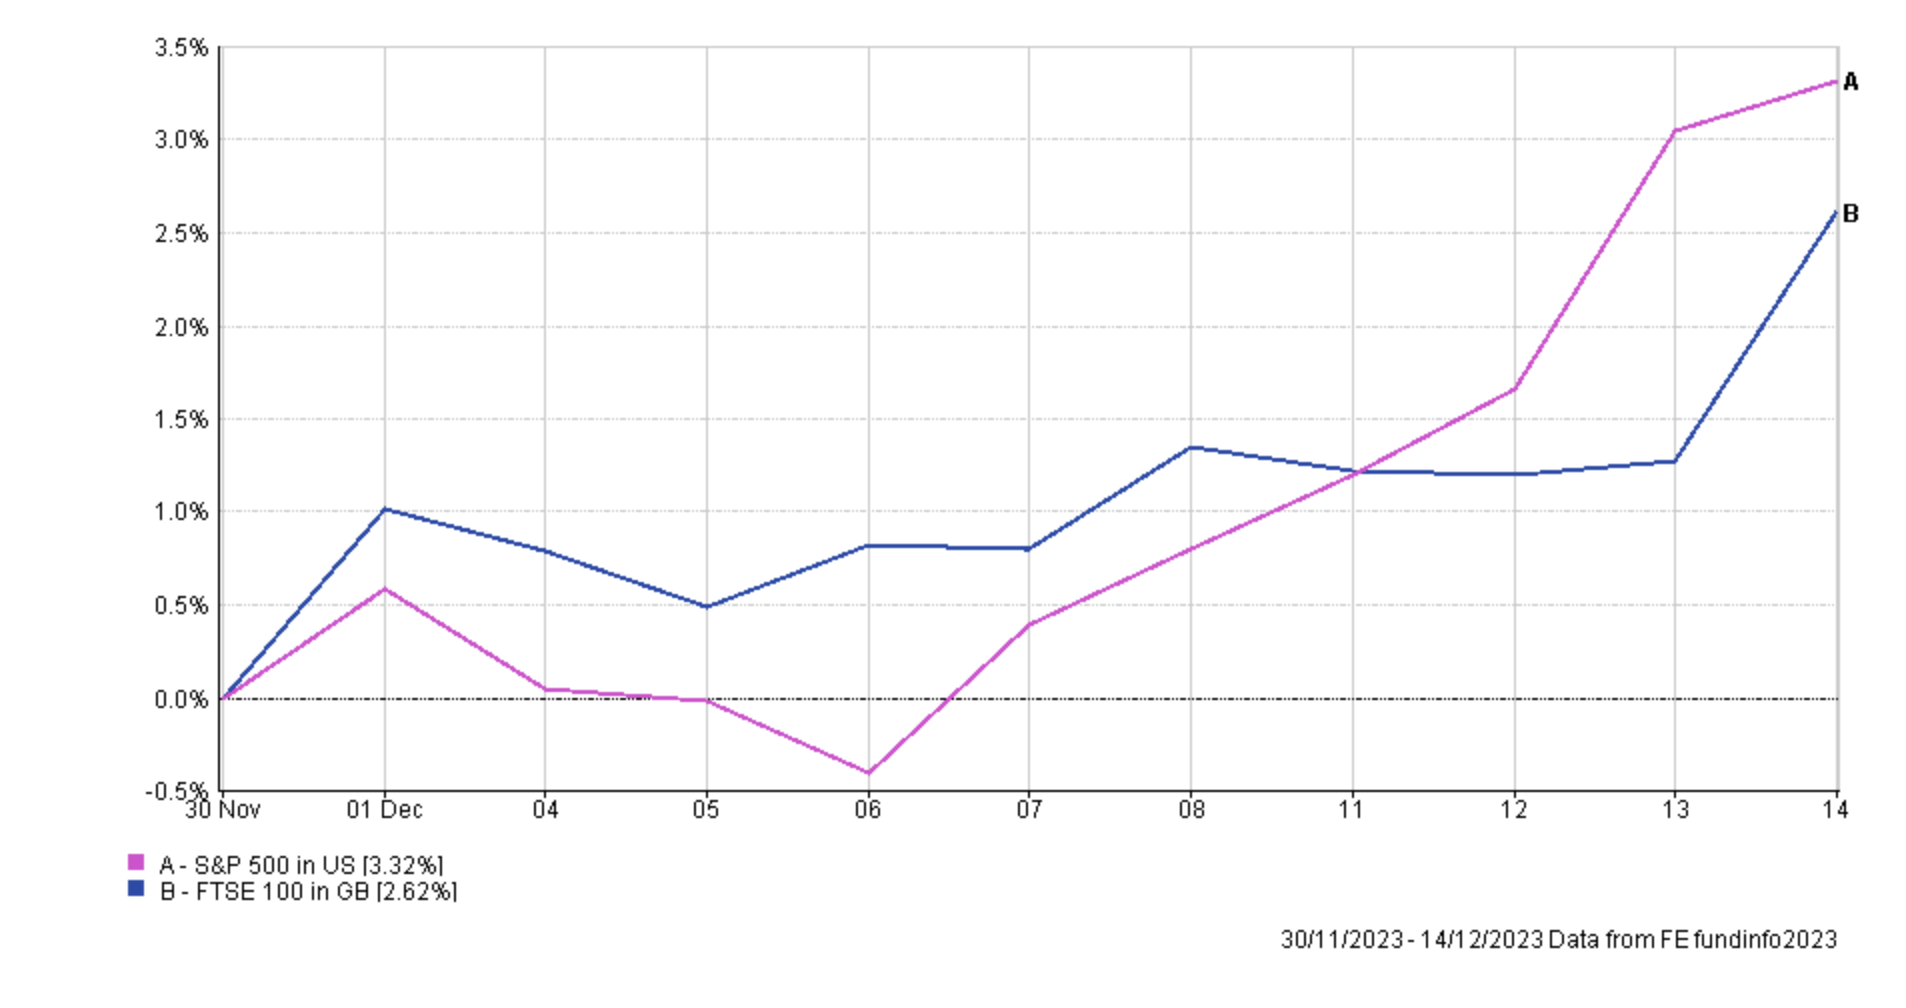
The first three funds listed were also outside of the BOTB and BFBS tables last month. While my intention was to make significant changes to those holdings the current level of market volatility has ultimately held me back this month. A wave of central bank policy decisions and official inflation data has meant that bond and equity markets have rallied hard in recent days. The chart below shows the price moves of the S&P 500 and the FTSE 100 since the start of December. To all intents and purposes the Santa rally seems to be under way.
Therefore there is a sense in "you've got to be in it to win it ", meaning that this is the worst time to be out of the market. It is also one of the reasons why I've held off reviewing my portfolio so far this month. With that in mind I will not be making any changes to my holdings in Fidelity American or L&G Global 100 Index Trust. Both were in the BOTB as recently as November and, as the earlier performance table shows, they remain among the best performers within my portfolio. So I think it is prudent to keep these for now, especially given the limited number of trading days between now and the new year, when a new BOTB will be published anyway.
It is for the same reason why I will also maintain my Troy Asset Management Ltd Trojan Global Equity holding. In my last review I gave the fund a stay of execution after it had fallen out of the BOTB and BFBS tables. This was the chart I published at the time showing the outperformance in the weeks ahead of my last review.
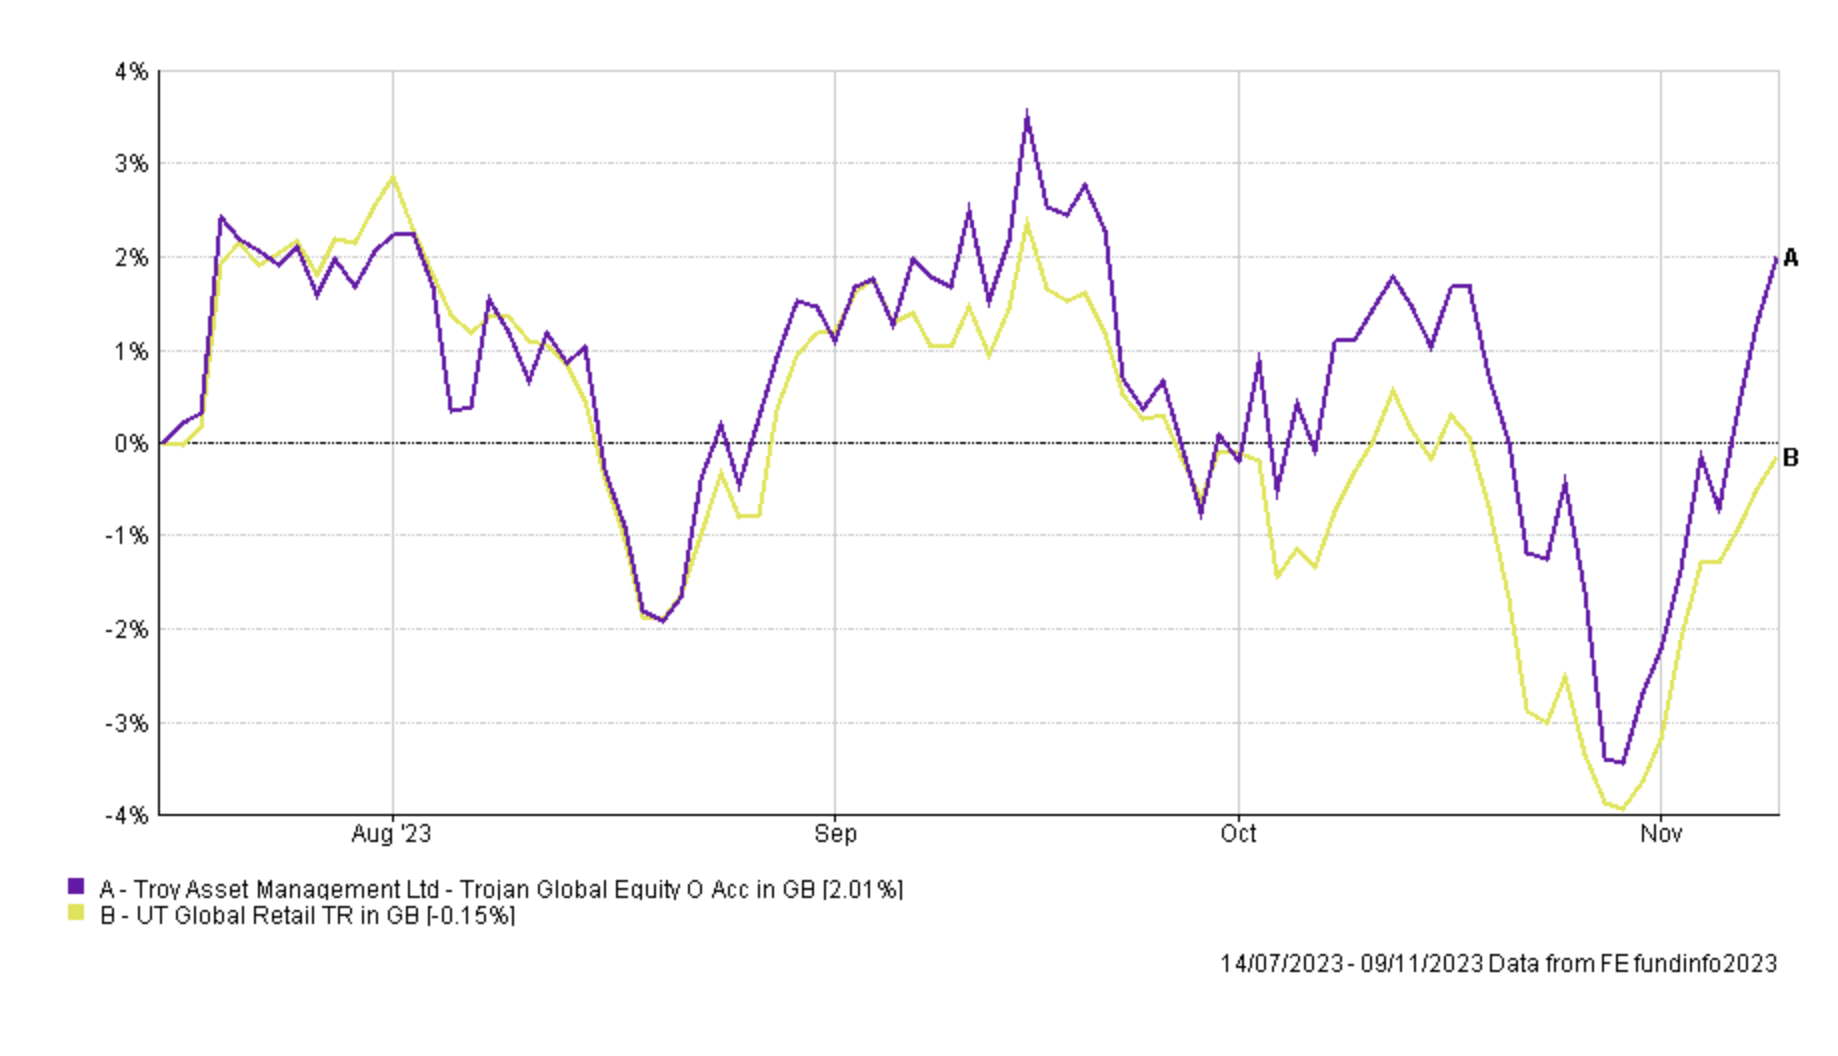
This is an updated version of that chart. You can see the outperformance has increased and the fund has gone parabolic so far in December.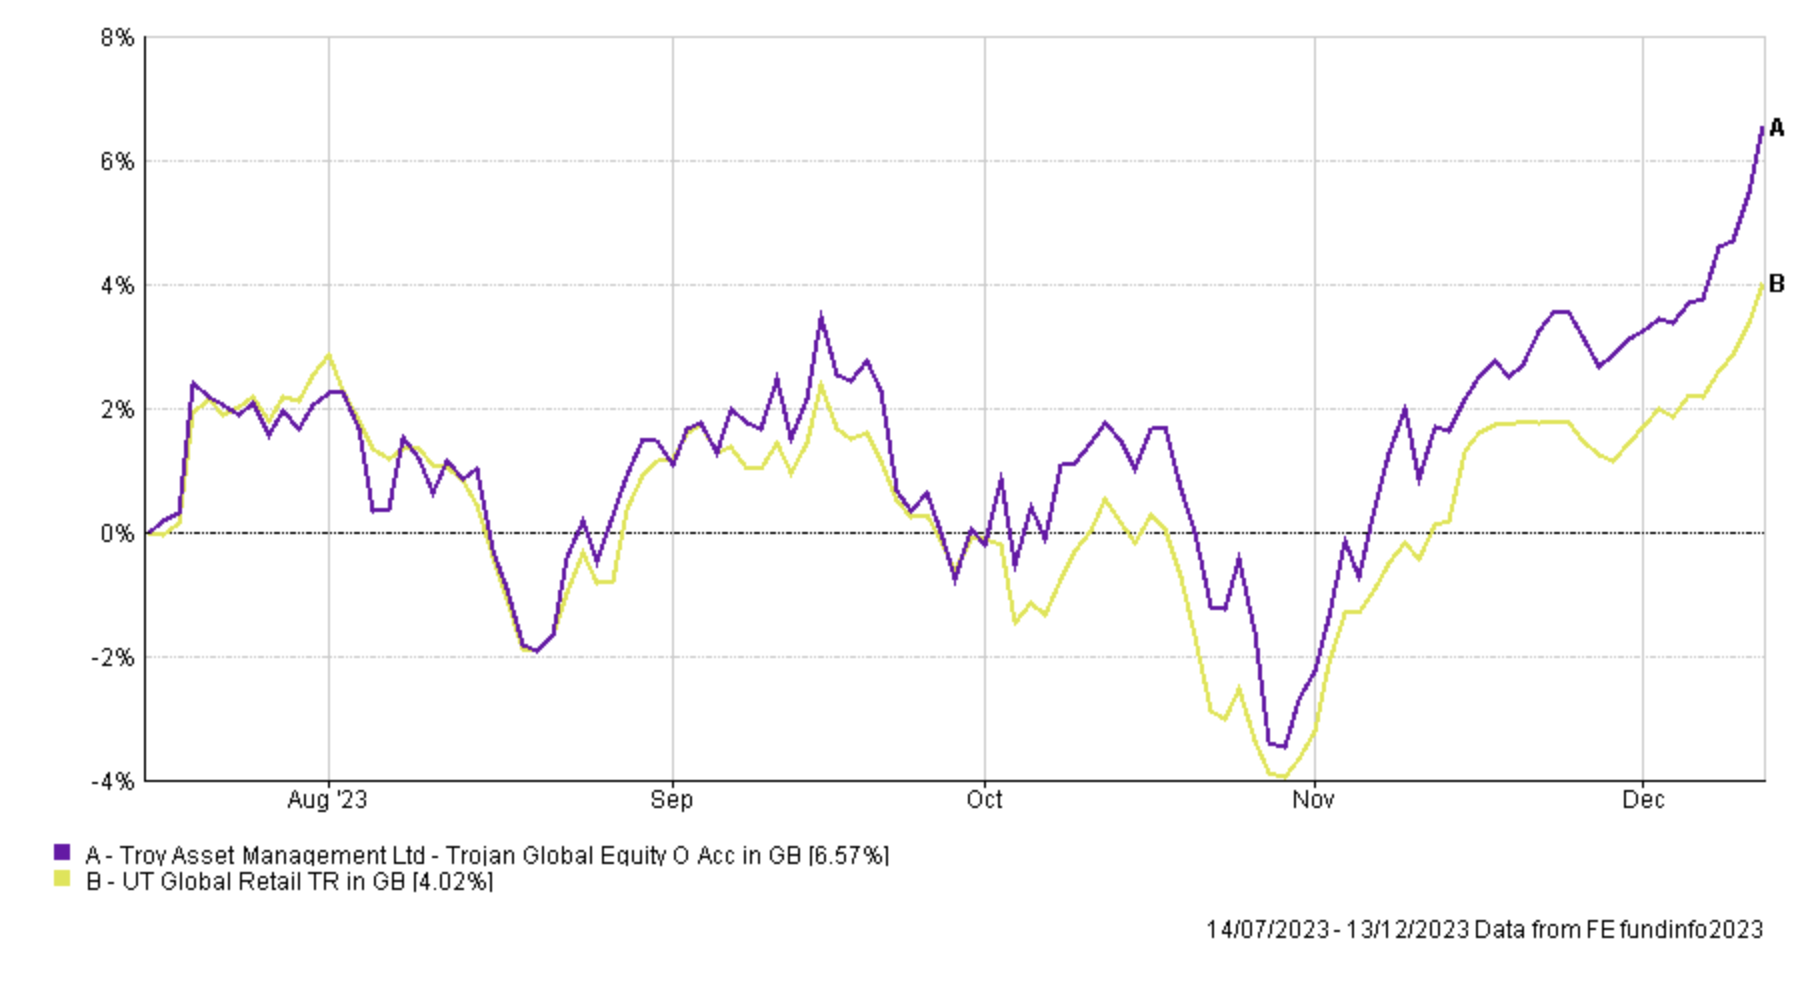
It means that my decision last month to keep Trojan Global Equity has been rewarded and, given the volatile backdrop at the moment, I will again leave the fund in my portfolio and review the situation in the new year.
That leaves BNY Mellon Multi-Asset Balanced and BNY Mellon Global Dynamic Bond, both of which were under scrutiny last month. At the time I maintained some exposure to BNY Mellon Global Dynamic Bond while I waited for more clarity on the direction of bond markets. That's because November marked the start of a sharp rally in bond markets but the rally was still in its infancy. Now, with the benefit of hindsight November did in fact mark the start of a sustained bond rally that has continued into December and has in fact accelerated. As bond markets continued to rally, my cash holding has proved a drag on my portfolio's performance which is why I am looking to rejuvenate the low-risk portion of my portfolio and bring my bond exposure in line with that of the BOTB.
That means finally re-investing my cash holding but also switching out of the BNY Mellon Global Dynamic Bond into a bond fund within the BOTB. At the same time as bolstering my bond exposure, I will also use some of the cash to increase my exposure to emerging market equities (also to be more in line with the asset mix of the BOTB). I will do this by increasing my exposure to Liontrust India, which has been a strong performer within my portfolio.
With regards to my BNY Mellon Multi-Asset Balanced fund I had planned to switch it for one of its sector peers, most likely Barclays Wealth Global Markets 4 (from the BOTB) or Vanguard Lifestrategy 80% Equity (from the BFBS). However, once again the timing of the change would be risky as I would be out of the market during what is currently a seasonally positive period for bond and equity markets. So once again I will refrain from making a change but keep the fund on review for next time.
Of course, as for those funds still in the BOTB (coloured blue) and those in the BFBS tables (coloured orange) I have no intention of removing them.
Fund switches
- 100% out of cash and 33% into Liontrust India, 34% into Schroder Strategic Credit and 33% into abrdn High Yield Bond
- 100% out of BNY Mellon Global Dynamic Bond and 100% into Schroder Strategic Credit
These switches impact the low-risk end of my portfolio which has proved a drag on my portfolio performance as bond markets rallied. The switches increase my bond exposure to be more in line with that of the BOTB as well as my exposure to Indian equities. Schroder Strategic Credit is a bond fund which is a member of the BOTB and has been for some time, and by topping up Liontrust India and abrdn High Yield Bond I am backing existing winners.
My portfolio
My portfolio now looks like this:
| Fund | Allocation | Risk | Sector | ISIN |
| abrdn High Yield Bond | 14.5 | Lower | Sterling High Yield | GB00B79RR984 |
| BNY Mellon Multi-Asset Balanced | 8.5 | Medium | Mixed Investment 40-85% Shares | GB00B8K9JZ06 |
| Fidelity American | 10 | Medium | North America | GB00B8GPC429 |
| Fidelity Index Japan | 5.5 | Medium | Japan | GB00BHZK8872 |
| iShares Physical Gold ETC | 5 | Medium | Commodity & Energy ETF | IE00B4ND3602 |
| T. Rowe Price US Large Cap Growth Equity | 5.5 | Higher | North America | GB00BD5FHW12 |
| L&G Global 100 Index Trust | 10 | Medium | Global | GB00B0CNH056 |
| Liontrust India | 5.5 | Higher | India/Indian Subcontinent | GB00B1L6DV51 |
| Schroder Strategic Credit | 8.5 | Lower | Sterling Strategic Bond | GB00BJZ2ZC09 |
| Thesis TM Tellworth UK Select | 6 | Lower | Targeted Absolute Return | GB00BNY7YM73 |
| Troy Asset Management Ltd Trojan Global Equity | 11 | Medium | Global | GB00B0ZJ5S47 |
| WS Saracen Global Income & Growth | 10 | Medium | Global Equity Income | GB00B5B35X02 |
My Portfolio asset mix
My portfolio asset mix has approximately 62% exposure to equities. Last month's figures are shown in brackets.
-
- UK Equities 4% (5%)
- North American Equities 28% (28%)
- Asian/Emerging Market Equities 6% (4%)
- Japanese Equities 6% (6%)
- European Equities 7% (7%)
- Chinese equities 0% (0%)
- Other equity 11% (11%)
- Commodities and energy 5% (5%)
- UK Fixed Interest 4% (0%)
- Global Fixed Interest 20% (18%)
- Cash 0% (7%)
- Alternative Investment Strategies 9% (9%)
- Property 0% (0%)
Damien's higher risk and lower risk portfolios
Using the logic described in my post: Update to Damien’s alternative risk portfolios I created hypothetical higher and lower risk versions of my portfolio below:
Lower risk
| Fund | Allocation % |
| abrdn High Yield Bond | 16 |
| BNY Mellon Multi-Asset Balanced | 10 |
| Fidelity American | 11 |
| Fidelity Index Japan | 6 |
| iShares Physical Gold ETC | 6 |
| L&G Global 100 Index Trust | 11 |
| Schroder Strategic Credit | 10 |
| Thesis TM Tellworth UK Select | 7 |
| Troy Asset Management Ltd Trojan Global Equity | 12 |
| WS Saracen Global Income & Growth | 11 |
Higher risk
| Fund | Allocation % |
| BNY Mellon Multi-Asset Balanced | 12 |
| Fidelity American | 14 |
| Fidelity Index Japan | 8 |
| iShares Physical Gold ETC | 7 |
| T. Rowe Price US Large Cap Growth Equity | 8 |
| L&G Global 100 Index Trust | 14 |
| Liontrust India | 8 |
| Troy Asset Management Ltd Trojan Global Equity | 15 |
| WS Saracen Global Income & Growth | 14 |

£200 Pension Cashback Offer
Make a qualifying deposit or transfer a pension to our partner Interactive Investor.
- Deposit or transfer a pension of at least £20k and you could earn £200 cashback
- Terms and Fees apply, Capital at risk
- New & Existing customers opening a SIPP
- Offer ends 31st July 2026
Before starting your transfer, check you won't lose any valuable benefits (such as guaranteed annuity rates or a lower protected pension age) and find out what exit fees you might have to pay
