

The background to my portfolio
Back in March 2015 I decided to invest £50,000 of my own money using 80-20 Investor. The purpose was twofold, firstly to show how you can use 80-20 Investor to invest and outperform the market with only a few minutes effort every now and then. Secondly, no other investment commentator, journalist or research provider invests their own money for fear of failing. This is a sorry state of affairs and is precisely why I committed to openly running my own portfolio for 80-20 Investor members to see.
Since then I have periodically changed my portfolio using the fund suggestions provided by the 80-20 Investor algorithm and associated research. I always disclose the changes at the time they are made.
Performance update
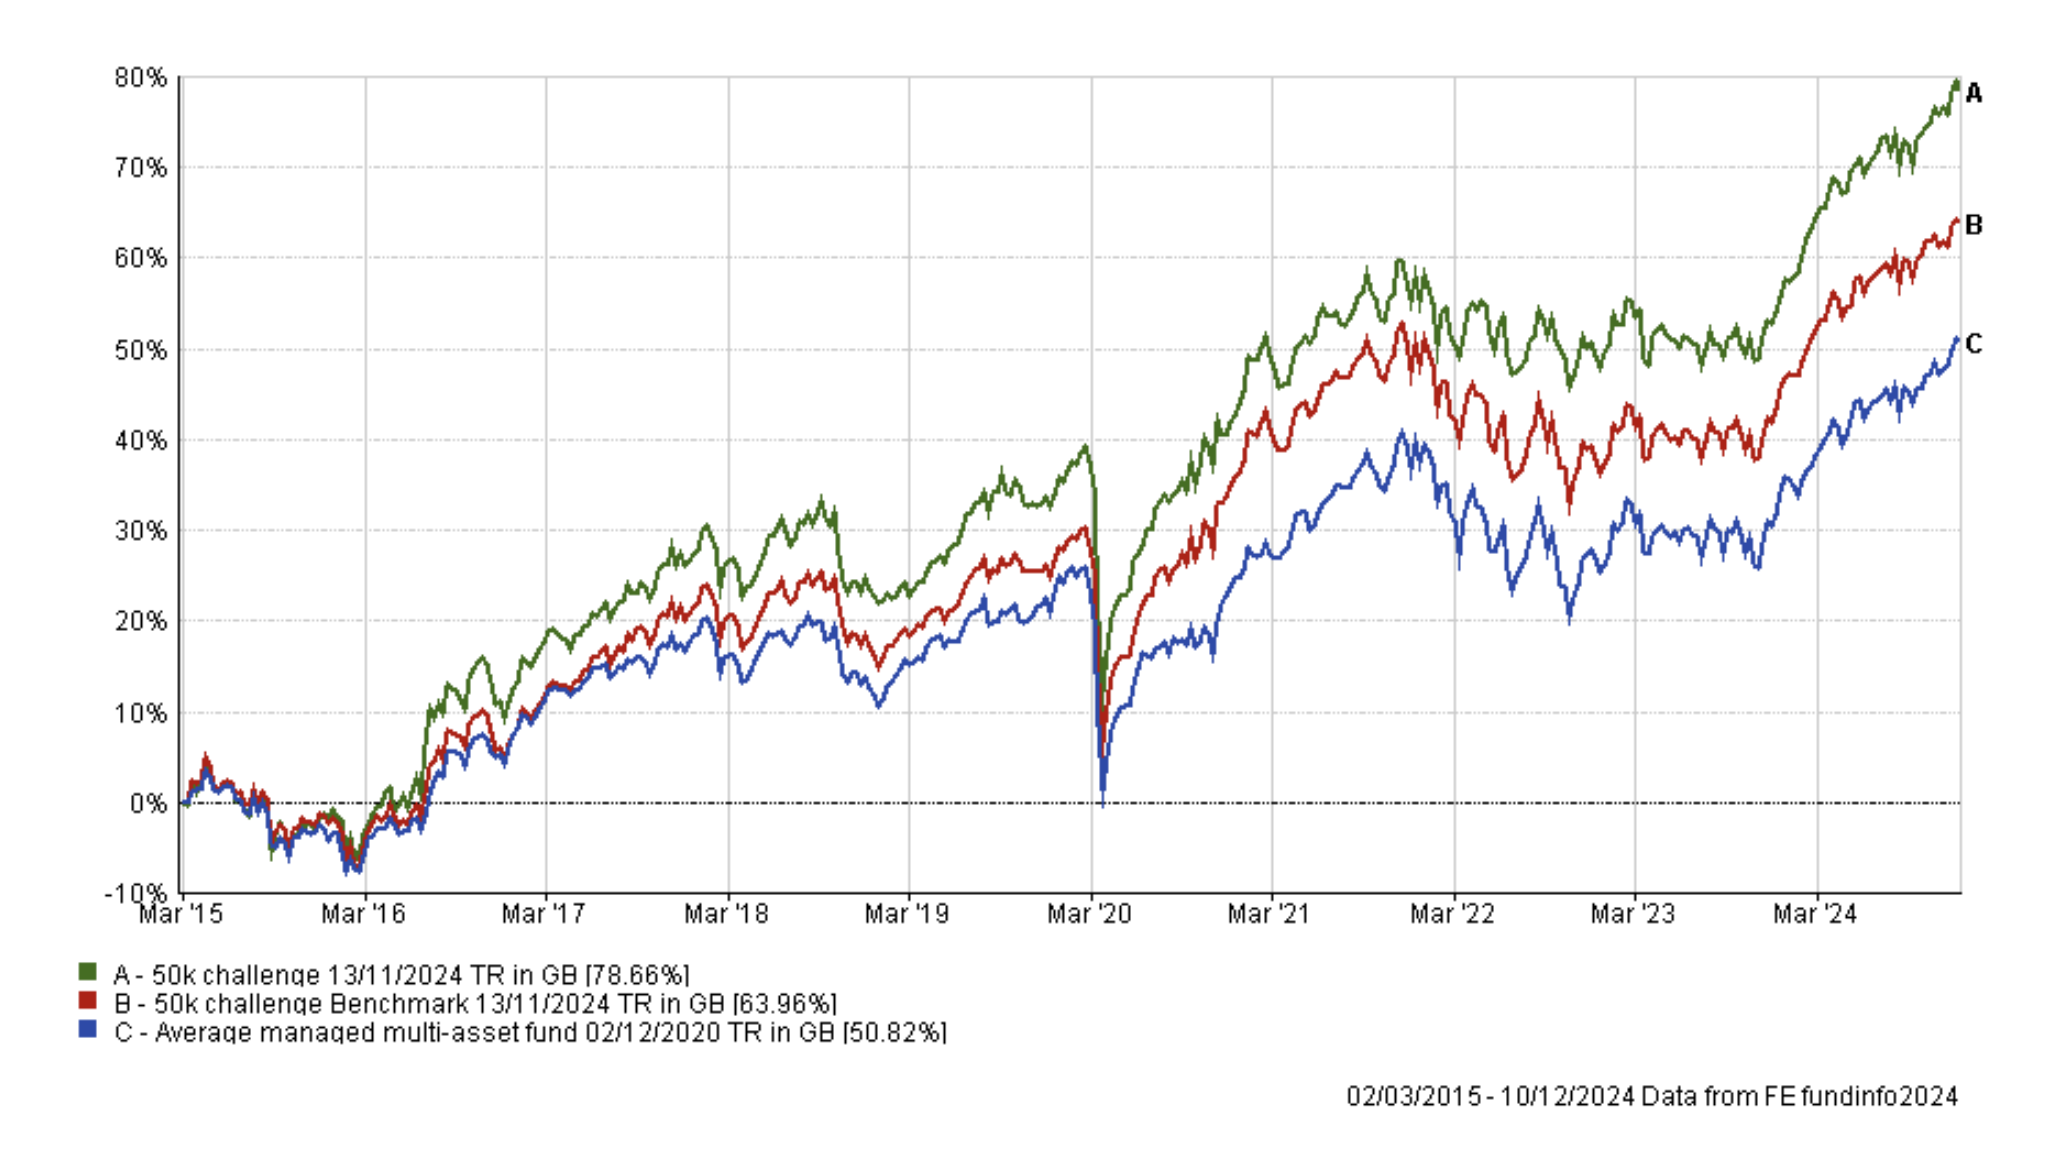
As is usual in my portfolio reviews, the chart below shows how my portfolio has outperformed since I started the challenge in March 2015. The green line is the performance of my portfolio while the red line is the benchmark showing the average return achieved by professional fund managers given the same asset mix. To accurately calculate this I have used the average return for each sector in which my portfolio invested. The blue line shows what the average multi-asset fund with comparable equity content achieved. In other words, the red line would show the extra performance added by just the asset mix of my portfolio (where I was invested i.e. European equities etc) over picking a typical multi-asset fund (the blue line). While the green line (which is my actual performance) shows the impact of being in the right funds at the right time, as identified by the 80-20 Investor algorithm.
As 2024 comes to a close the chart below reflects on another great year for my £50k portfolio, As you can see my portfolio has produced a return of over 13% in 2024, outperforming its benchmarks.
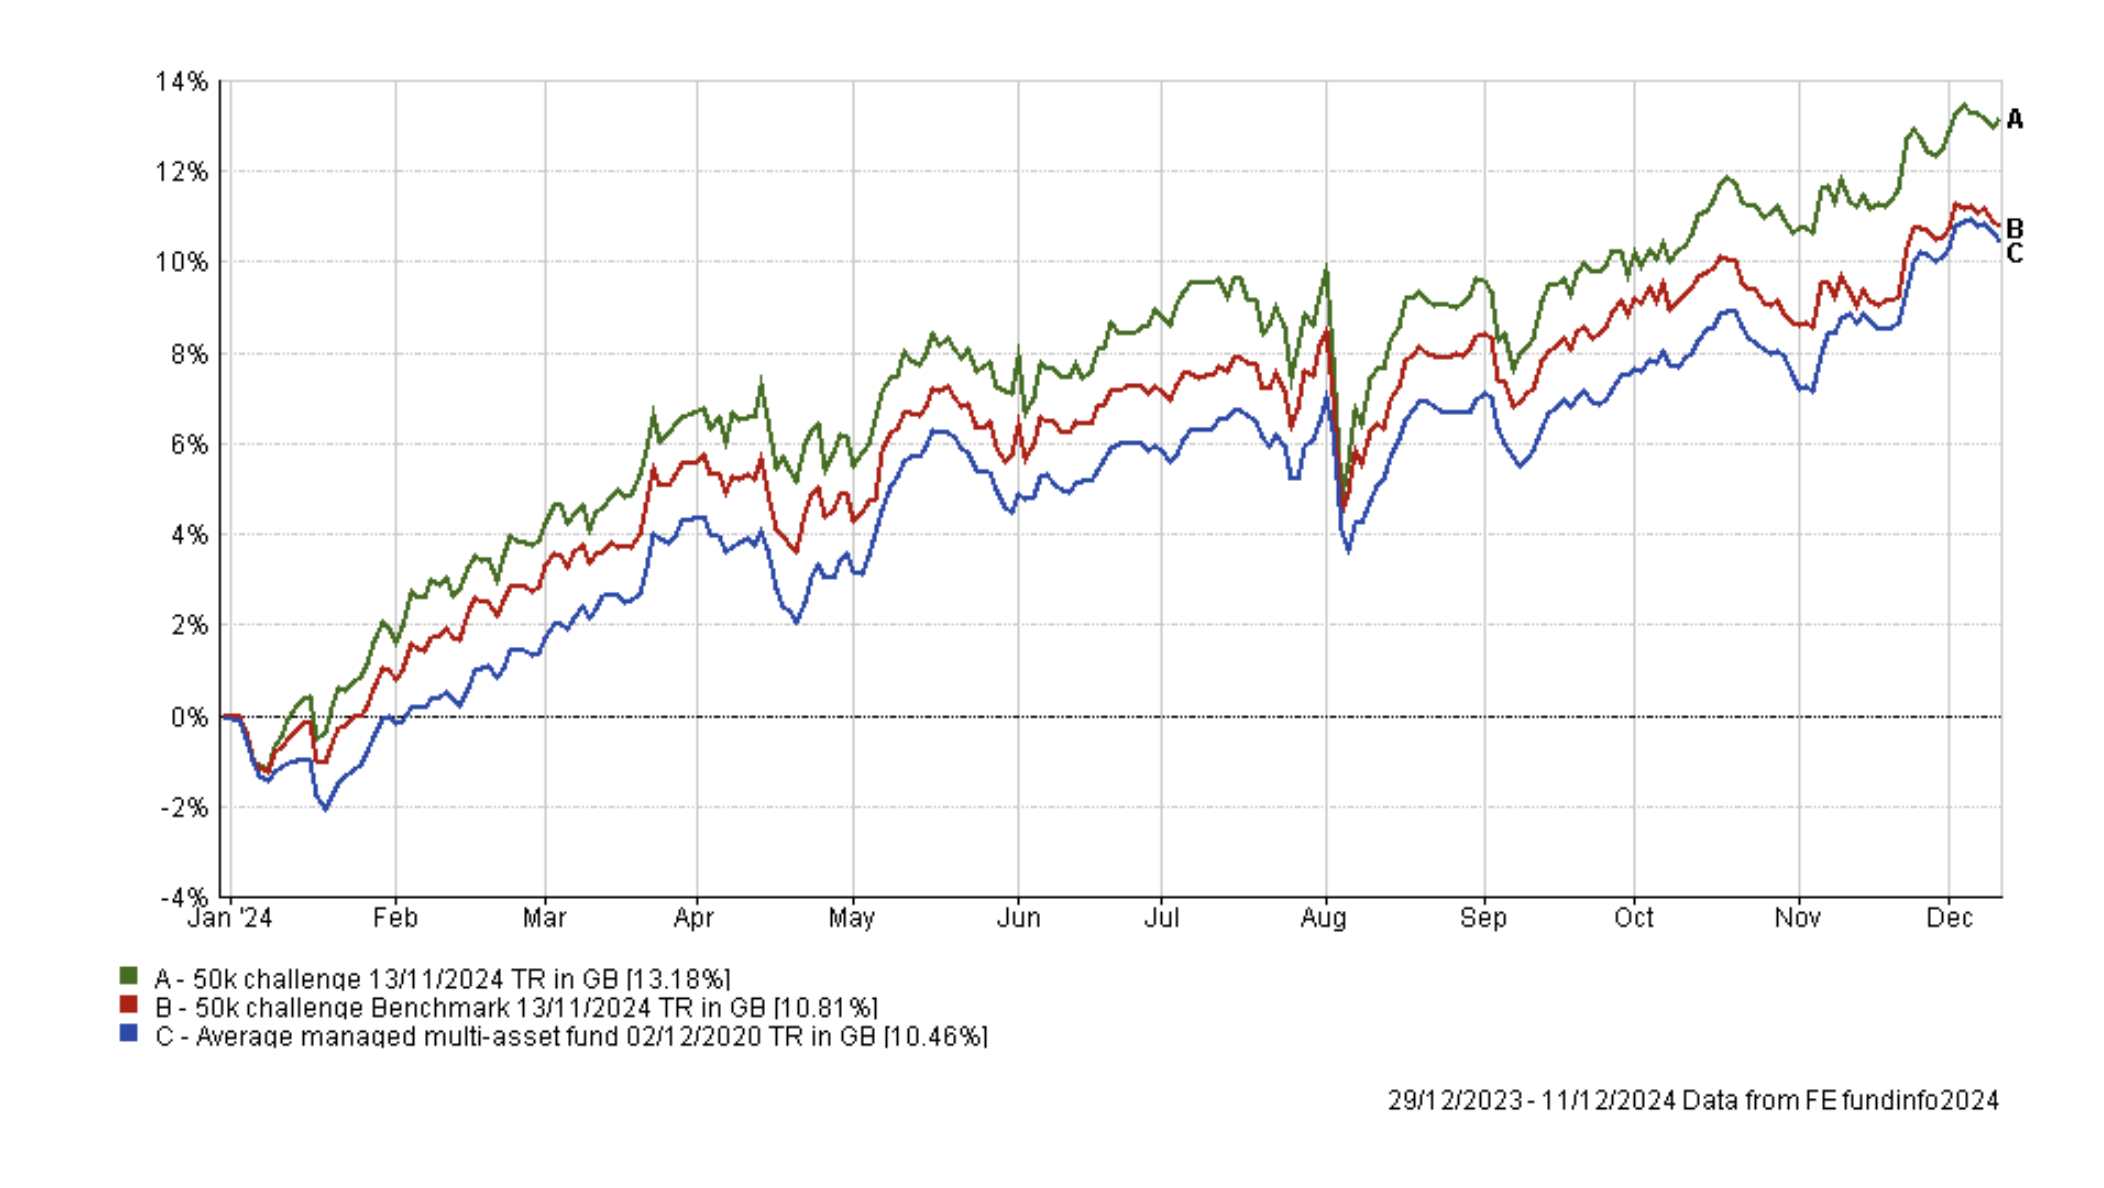
Unsurprisingly it means that over the (nearly) 10 years that I've been running my portfolio it continues to significantly outperform its benchmarks.
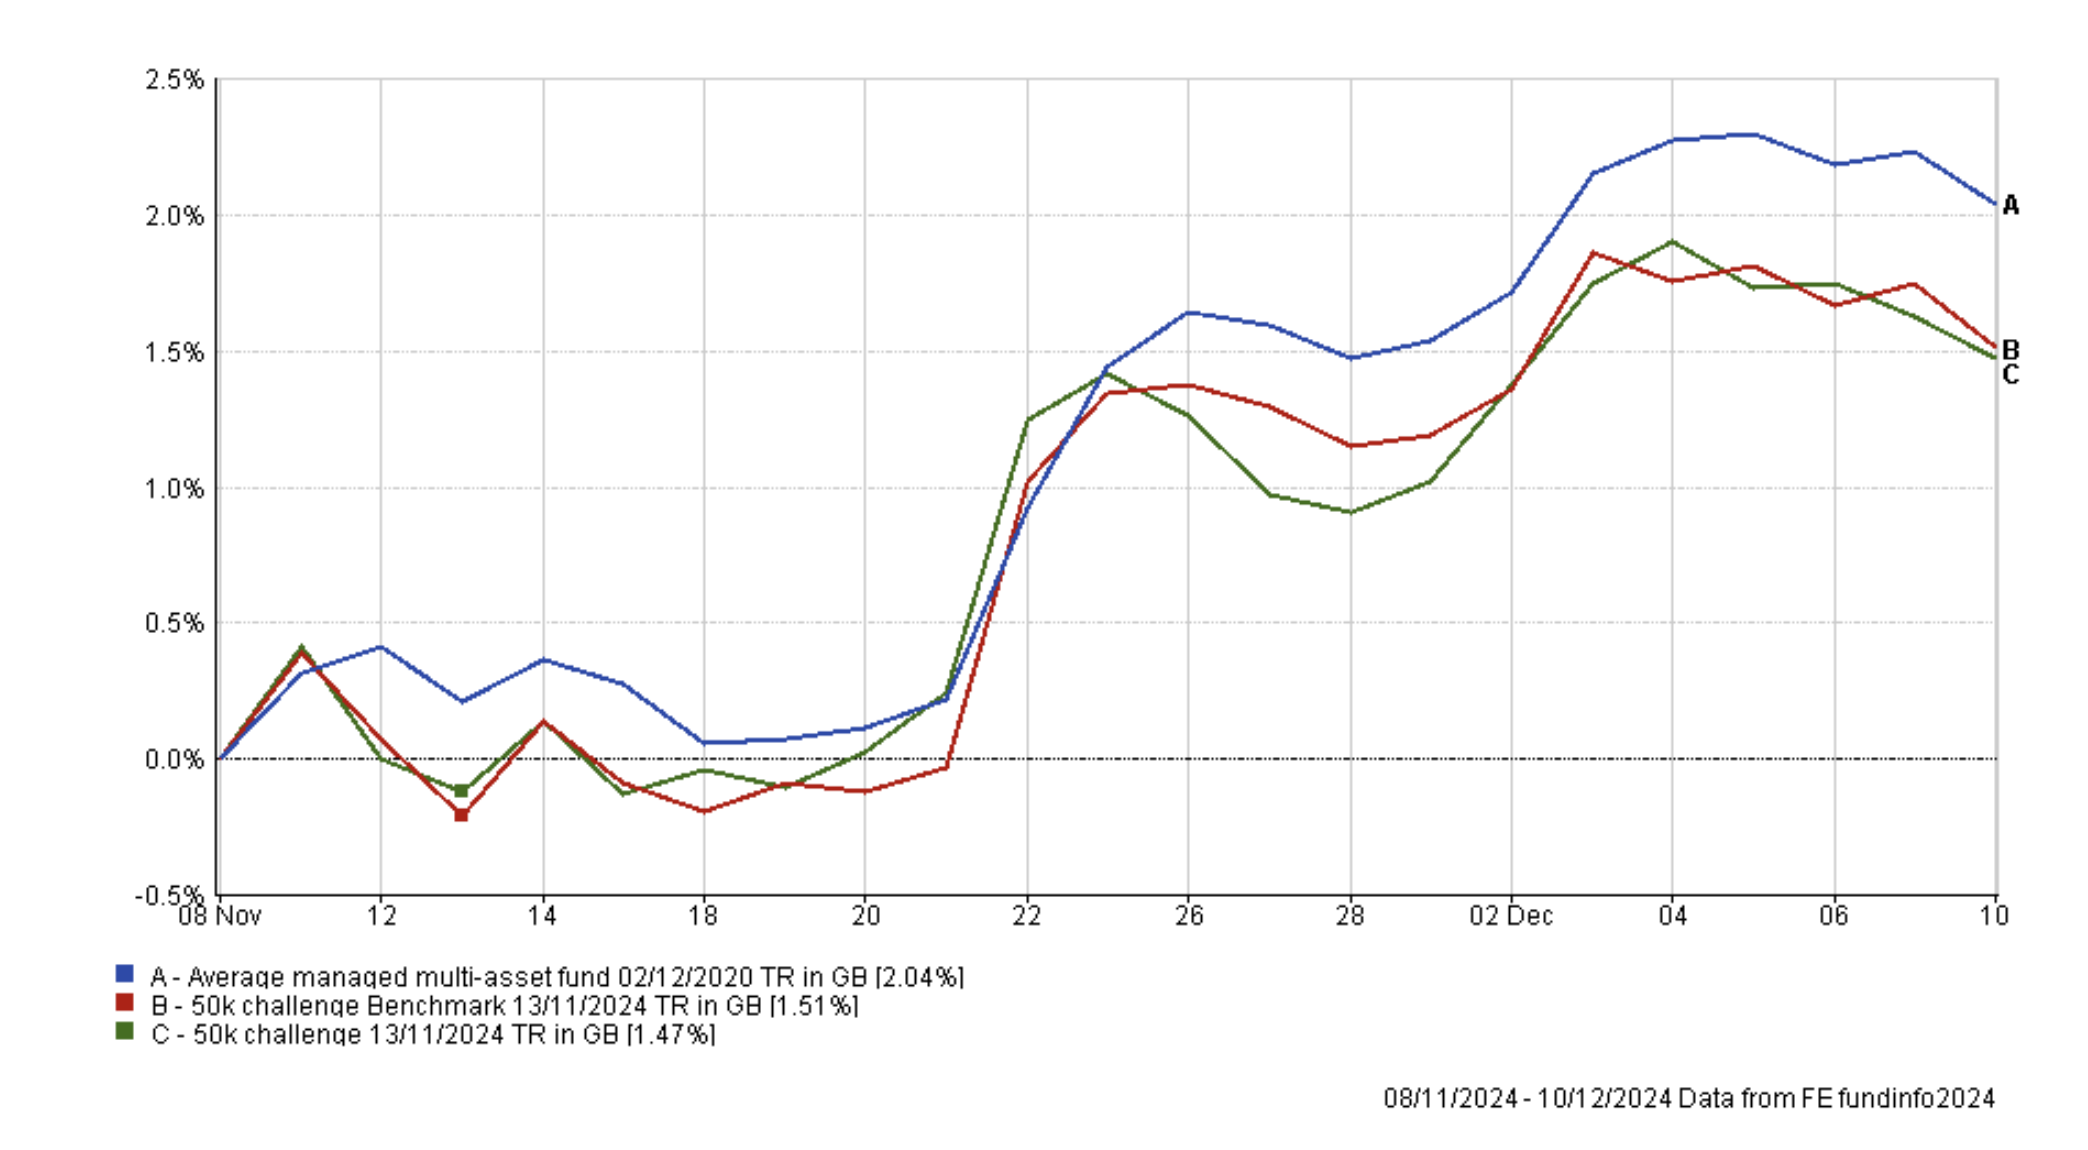
However, my portfolio did lag its benchmarks slightly over the last month (as shown in the chart below).
The table below shows how individual funds performed within my portfolio during the period. Funds with exposure to US equities performed the best as did those funds exposed to companies or industries that benefited most from the Trump trade 2.0. At the opposite end of the scale, domestically focused UK companies (Schroder UK Smaller Companies) and funds with European equity exposure (Aviva Inv Global Equity Income) struggled over concerns for the UK economic outlook and potential Trump tariffs.
| Name | % return over the last month (since November review) |
| Ninety One UK Special Situations | 6.49 |
| T. Rowe Price US Large Cap Growth Equity | 5.27 |
| Liontrust India | 4.98 |
| Fidelity Index Japan | 3 |
| Vanguard FTSE Developed World ex-UK Equity Index | 2.23 |
| iShares Physical Gold ETC | 1.5 |
| Barclays Global Markets Adventurous | 1.44 |
| Thesis TM Tellworth UK Select | 1.39 |
| abrdn High Yield Bond | 1.08 |
| Artemis Global Income | 1.02 |
| Schroder Strategic Credit | 0.83 |
| Aviva Inv Global Equity Income | -0.74 |
| Schroder UK Smaller Companies | -0.76 |
As usual, the table below shows which funds within my portfolio are in the current BOTB or BFBS tables and which are not. Those funds in blue are still in the BOTB while those in orange are not in the BOTB but remain in the BFBS list. Meanwhile, any funds in red have dropped out of both shortlists.
| Fund | Allocation | Risk | Sector | ISIN |
| abrdn High Yield Bond | 14 | Lower | Sterling High Yield | GB00B79RR984 |
| Artemis Global Income | 11.5 | Medium | Global Equity Income | GB00B5N99561 |
| Aviva Inv Global Equity Income | 10 | Medium | Global Equity Income | GB0030441918 |
| Barclays Global Markets Adventurous | 8 | Medium | Flexible Investment | GB00B4YPY060 |
| Fidelity Index Japan | 3 | Medium | Japan | GB00BHZK8872 |
| iShares Physical Gold ETC | 5.5 | Medium | Commodity & Energy ETF | IE00B4ND3602 |
| Liontrust India | 6 | Higher | India/Indian Subcontinent | GB00B1L6DV51 |
| Ninety One UK Special Situations | 3.75 | Higher | UK All Companies | GB00B1XFJS91 |
| Schroder Strategic Credit | 8 | Lower | Sterling Strategic Bond | GB00BJZ2ZC09 |
| Schroder UK Smaller Companies | 5.5 | Higher | UK Smaller Companies | GB00B76V7Z98 |
| T. Rowe Price US Large Cap Growth Equity | 9.75 | Higher | North America | GB00BD5FHW12 |
| Thesis TM Tellworth UK Select | 5.5 | Lower | Targeted Absolute Return | GB00BNY7YM73 |
| Vanguard FTSE Developed World ex-UK Equity Index | 9.5 | Medium | Global | GB00B59G4Q73 |
Below is a list of the 'red' funds that have fallen out of both the BOTB and BFBS tables (the funds in bold were also in last month's red list):
- Aviva Inv Global Equity Income
- Barclays Global Markets Adventurous
- Fidelity Index Japan
- Schroder UK Smaller Companies
First of all, it is worth highlighting that Ninety One UK Special Situations had been on the red list for a couple of months, and so I decided to drip out of the fund last month, as opposed to selling it completely. The decision proved fortuitous as the fund went on to become the top performer within my portfolio over the last month and has since re-entered the BFBS tables. Interestingly the beneficiary of the proceeds from the Ninety One UK Special Situations fund was the second best performer, namely T. Rowe Price US Large Cap Growth Equity (see table above). It is a good illustration of the fact that funds don't immediately become poor funds just because they fall out of the 80-20 Investor tables so one strategy is to reduce your exposure in stages, essentially hedging your bets and morphing your portfolio over a period of time. Of course, that's not to say such a strategy will always work out better than a wholesale fund switch but I just wanted to highlight that sometimes it can. Anyway, moving on...
Aviva Inv Global Equity Income, which is a member of the current most consistent funds list, has dropped out of the BFBS and BOTB lists. However, had I carried out my review last week when the fund was still in the BFBS tables, then it wouldn't actually be on the red list at all. But as you can see from the earlier performance table, it was among the weakest performers within my portfolio over the last month. This is a reflection of the fund's positioning i.e. it has no exposure to large US tech stocks but instead is focused on UK and European companies, including industrials. As a result, the fund hasn't benefited from the Trump trade 2.0 and has arguably been hampered by the US election result as well as threats of trade tariffs on European exports to the US. With the fund only just slipping out of the BFBS tables in recent days I will give it a stay of execution. It is invested differently to the other global equity funds within my portfolio (such as T. Rowe Price US Large Cap Growth Equity which invests heavily in US tech stocks) so is a good diversifier. However I will add it to my watchlist for next time.
Schroder UK Smaller Companies has also been lingering on the red list for a number of months now. While my winter portfolio research article suggests that we've entered a seasonally positive period for UK smaller companies funds, this hasn't been reflected in the Schroder fund's recent performance. As such it is time to replace it within my portfolio as it has proved a drag on the portfolio's performance. Also by removing the fund from within my portfolio it will reduce my UK equity exposure to be more inline with that of the current BOTB.
Interestingly when looking at possible alternatives for the Aviva Inv Global Equity Income fund (although I subsequently decided to keep it) one standout candidate was M&G Global Dividend. This fund has consistently appeared in the BOTB rankings and has performed well, largely due to its US equity exposure. Its exposure to financials has also provided a boost, but its presence in the BOTB even before the US election suggests it's not solely a "Trump trade" play. So I plan to invest the proceeds from the Schroder UK Smaller Companies sale into the M&G Global Dividend, which will have the added benefit of increasing my US equity exposure to be more in line with the BOTB.
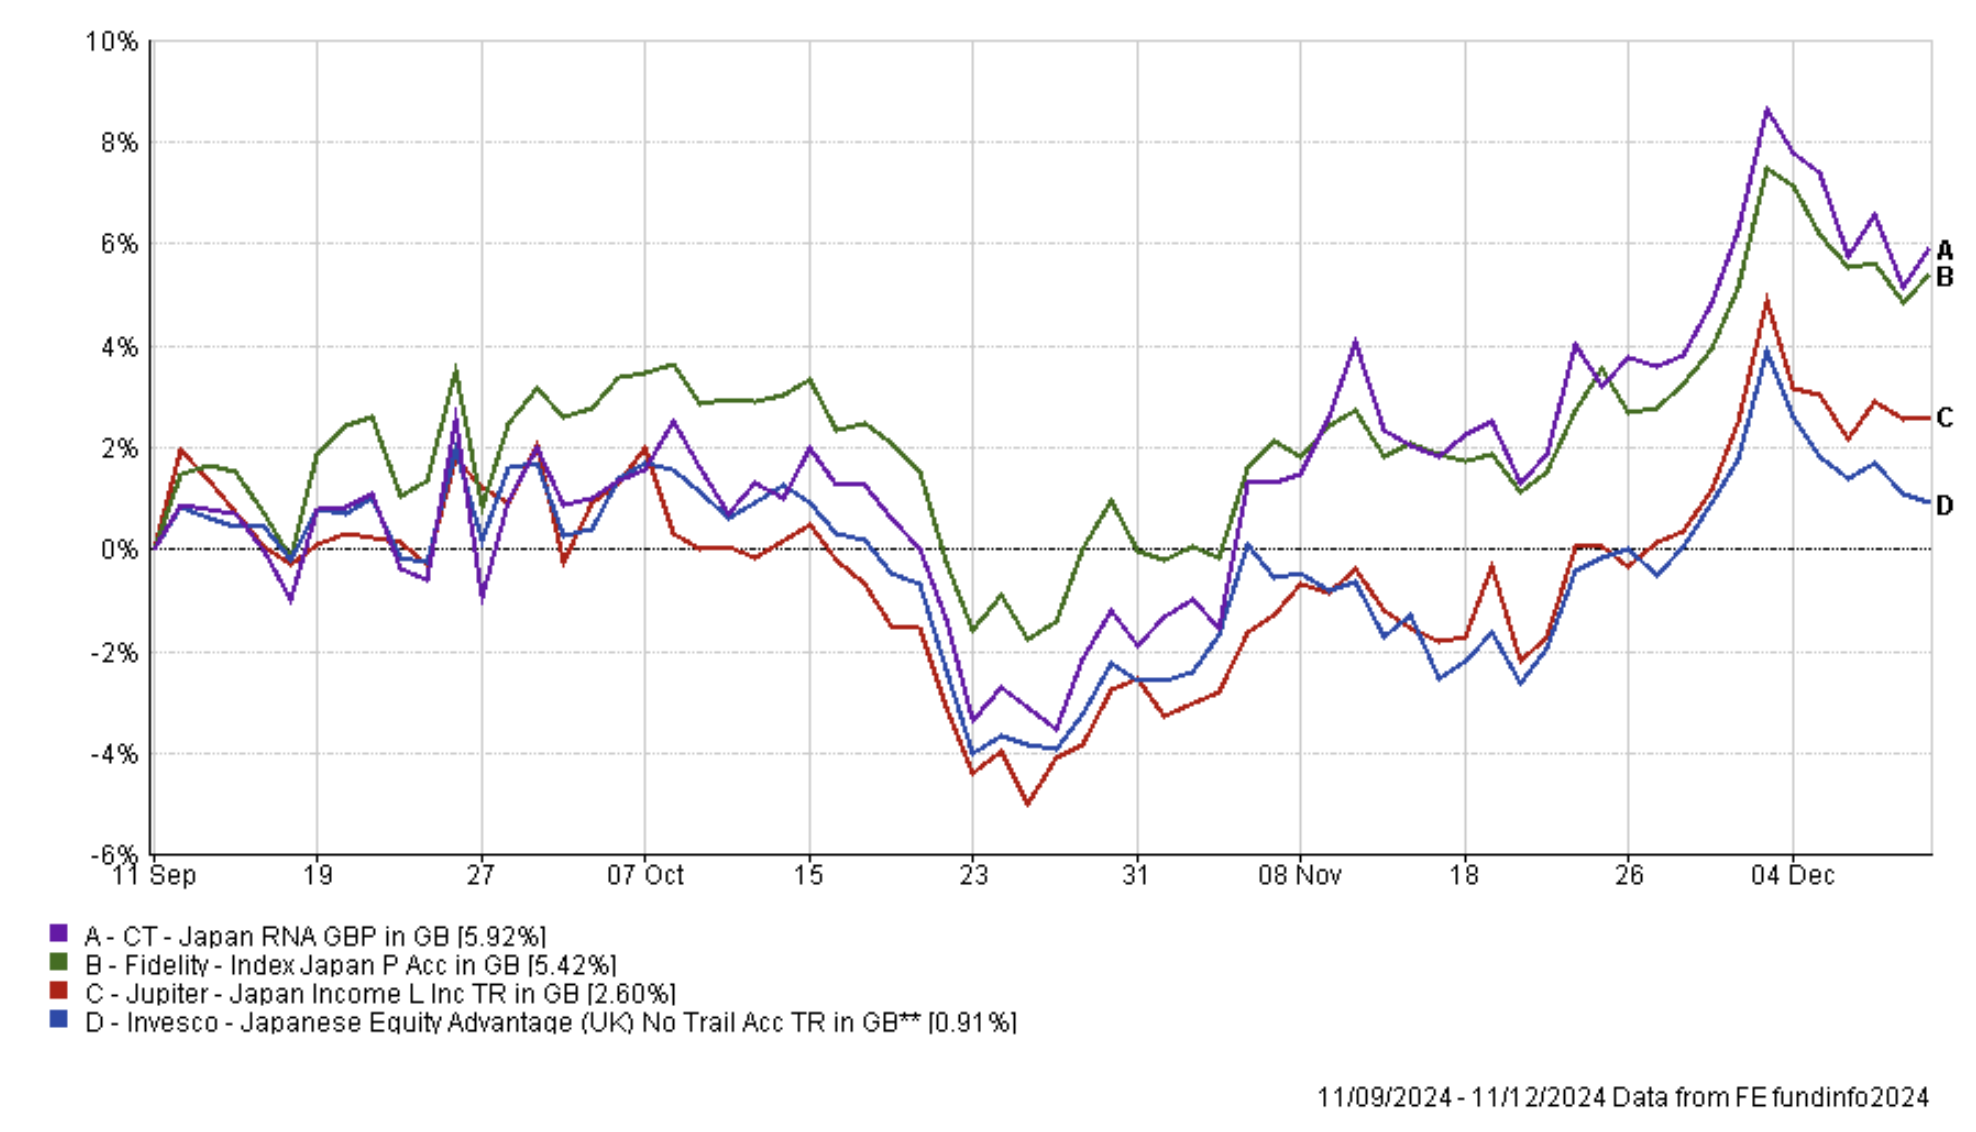
Fidelity Index Japan is the only fund of the four listed above that was on the red list last month too. I considered moving out of the fund and into an alternative Japanese equity fund, in order to keep my asset mix in line with that of the BOTB, but have decided against it for now. The chart below shows the performance of the Fidelity Index Japan fund versus the Invesco Japanese Equity Advantage (UK) which is the sole Japanese equity fund in December's BOTB as well as other Japanese equity funds from the BFBS list. As you can see the Fidelity fund has performed strongly in recent months. While I don't make calls based on such short timeframes, my sense of urgency to change the fund is diminished, especially given that it is one of the smallest holdings in my portfolio as well as the limited number of trading days until we get a new BOTB in January. At that point I can review its position in my portfolio once again.
Barclays Global Markets Adventurous is a recent addition to my portfolio and since its introduction back in November has only been outperformed by my gold holding and T. Rowe Price US Large Cap Growth Equity. While it's not in the BFBS tables at the moment its performance doesn't concern me and I will look at the fund next month to consider its place in the portfolio. With limited trading days left in December I would prefer to remain invested in the market as much as possible to ride any seasonal momentum into the year end, if it arrives.
The rest of the funds within my portfolio remain in the BFBS and BOTB tables so I will maintain them as they are.
Fund switches
- 100% out of Schroder UK Smaller Companies and 100% into M&G Global Dividend
My portfolio
My portfolio looks now like this:
| Fund | Allocation | Risk | Sector | ISIN Code |
| abrdn High Yield Bond | 14 | Lower | Sterling High Yield | GB00B79RR984 |
| Artemis Global Income | 11 | Medium | Global Equity Income | GB00B5N99561 |
| Aviva Inv Global Equity Income | 10 | Medium | Global Equity Income | GB0030441918 |
| Barclays Global Markets Adventurous | 8 | Medium | Flexible Investment | GB00B4YPY060 |
| Fidelity Index Japan | 3 | Medium | Japan | GB00BHZK8872 |
| iShares Physical Gold ETC | 6 | Medium | Commodity & Energy ETF | IE00B4ND3602 |
| Liontrust India | 6 | Higher | India/Indian Subcontinent | GB00B1L6DV51 |
| M&G Global Dividend | 5 | Medium | Global Equity Income | GB00B46J9127 |
| Ninety One UK Special Situations | 4 | Higher | UK All Companies | GB00B1XFJS91 |
| Schroder Strategic Credit | 8 | Lower | Sterling Strategic Bond | GB00BJZ2ZC09 |
| T. Rowe Price US Large Cap Growth Equity | 10 | Higher | North America | GB00BD5FHW12 |
| Thesis TM Tellworth UK Select | 5.5 | Lower | Targeted Absolute Return | GB00BNY7YM73 |
| Vanguard FTSE Developed World ex-UK Equity Index | 9.5 | Medium | Global | GB00B59G4Q73 |
My Portfolio asset mix
My portfolio asset mix has approximately 66% exposure to equities. Last month's figures are shown in brackets.
-
- UK Equities 13% (17%)
- North American Equities 26% (24%)
- Asian Equities 2% (2%)
- Chinese Equities 0% (0%)
- Emerging Market Equities 6% (5%)
- Japanese Equities 5% (5%)
- European Equities 8% (8%)
- Other International equity 6% (5%)
- Commodities and energy 5% (6%)
- UK Fixed Interest 4% (4%)
- Global Fixed Interest 18% (18%)
- Cash 0% (0%)
- Alternative Investment Strategies 7% (6%)
Damien's higher risk and lower risk portfolios
Using the logic described in my post: Update to Damien’s alternative risk portfolios I created hypothetical higher and lower risk versions of my portfolio below:
Lower risk
| Fund | Allocation % |
| abrdn High Yield Bond | 18 |
| Artemis Global Income | 13 |
| Aviva Inv Global Equity Income | 12 |
| Barclays Global Markets Adventurous | 10 |
| Fidelity Index Japan | 4 |
| iShares Physical Gold ETC | 8 |
| M&G Global Dividend | 6 |
| Schroder Strategic Credit | 10 |
| Thesis TM Tellworth UK Select | 7 |
| Vanguard FTSE Developed World ex-UK Equity Index | 12 |
Higher risk
| Fund | Allocation % |
| Artemis Global Income | 15 |
| Aviva Inv Global Equity Income | 14 |
| Barclays Global Markets Adventurous | 11 |
| Fidelity Index Japan | 4 |
| iShares Physical Gold ETC | 8 |
| Liontrust India | 8 |
| M&G Global Dividend | 7 |
| Ninety One UK Special Situations | 6 |
| T. Rowe Price US Large Cap Growth Equity | 14 |
| Vanguard FTSE Developed World ex-UK Equity Index | 13 |


£200 Pension Cashback Offer
Make a qualifying deposit or transfer a pension to our partner Interactive Investor.
- Deposit or transfer a pension of at least £20k and you could earn £200 cashback
- Terms and Fees apply, Capital at risk
- New & Existing customers opening a SIPP
- Offer ends 31st July 2026
Before starting your transfer, check you won't lose any valuable benefits (such as guaranteed annuity rates or a lower protected pension age) and find out what exit fees you might have to pay

