

The background to my portfolio
Back in March 2015 I decided to invest £50,000 of my own money using 80-20 Investor. The purpose was twofold, firstly to show how you can use 80-20 Investor to invest and outperform the market with only a few minutes effort every now and then. Secondly, no other investment commentator, journalist or research provider invests their own money for fear of failing. This is a sorry state of affairs and is precisely why I committed to openly running my own portfolio for 80-20 Investor members to see.
Since then I have periodically changed my portfolio using the fund suggestions provided by the 80-20 Investor algorithm and associated research. I always disclose the changes at the time they are made.
Performance update
As is usual in my portfolio reviews, the chart below shows how my portfolio has outperformed since I started the challenge in March 2015, which is nearly six years ago. The green line is the performance of my portfolio while the red line is the benchmark showing the average return achieved by professional fund managers given the same asset mix. To accurately calculate this I have used the average return for each sector in which my portfolio invested. The blue line shows what the average multi-asset fund with comparable equity content achieved. In other words, the red line would show the extra performance added by just the asset mix of my portfolio (where I was invested i.e European equities etc) over picking a typical multi-asset fund (the blue line). While the green line (which is my actual performance) shows the impact of being in the right funds at the right time, as identified by the 80-20 Investor algorithm.
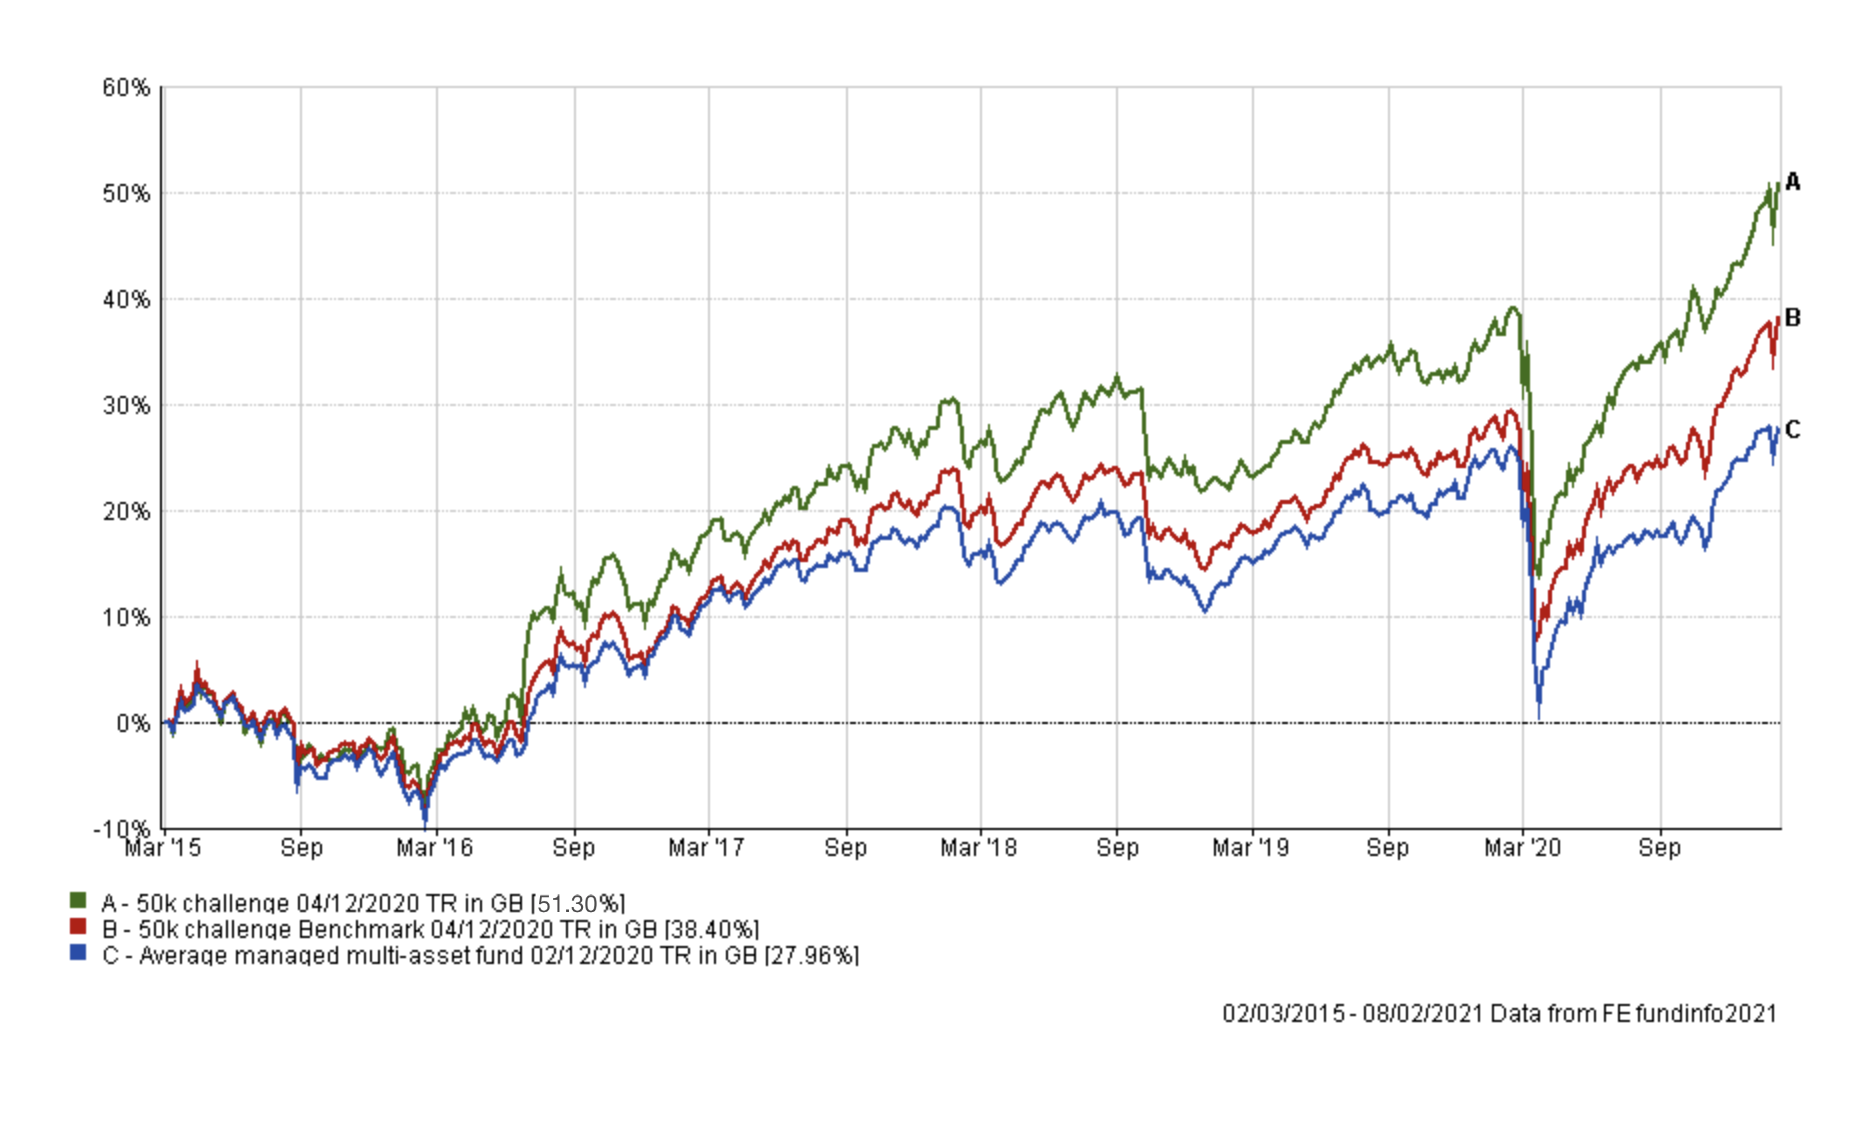
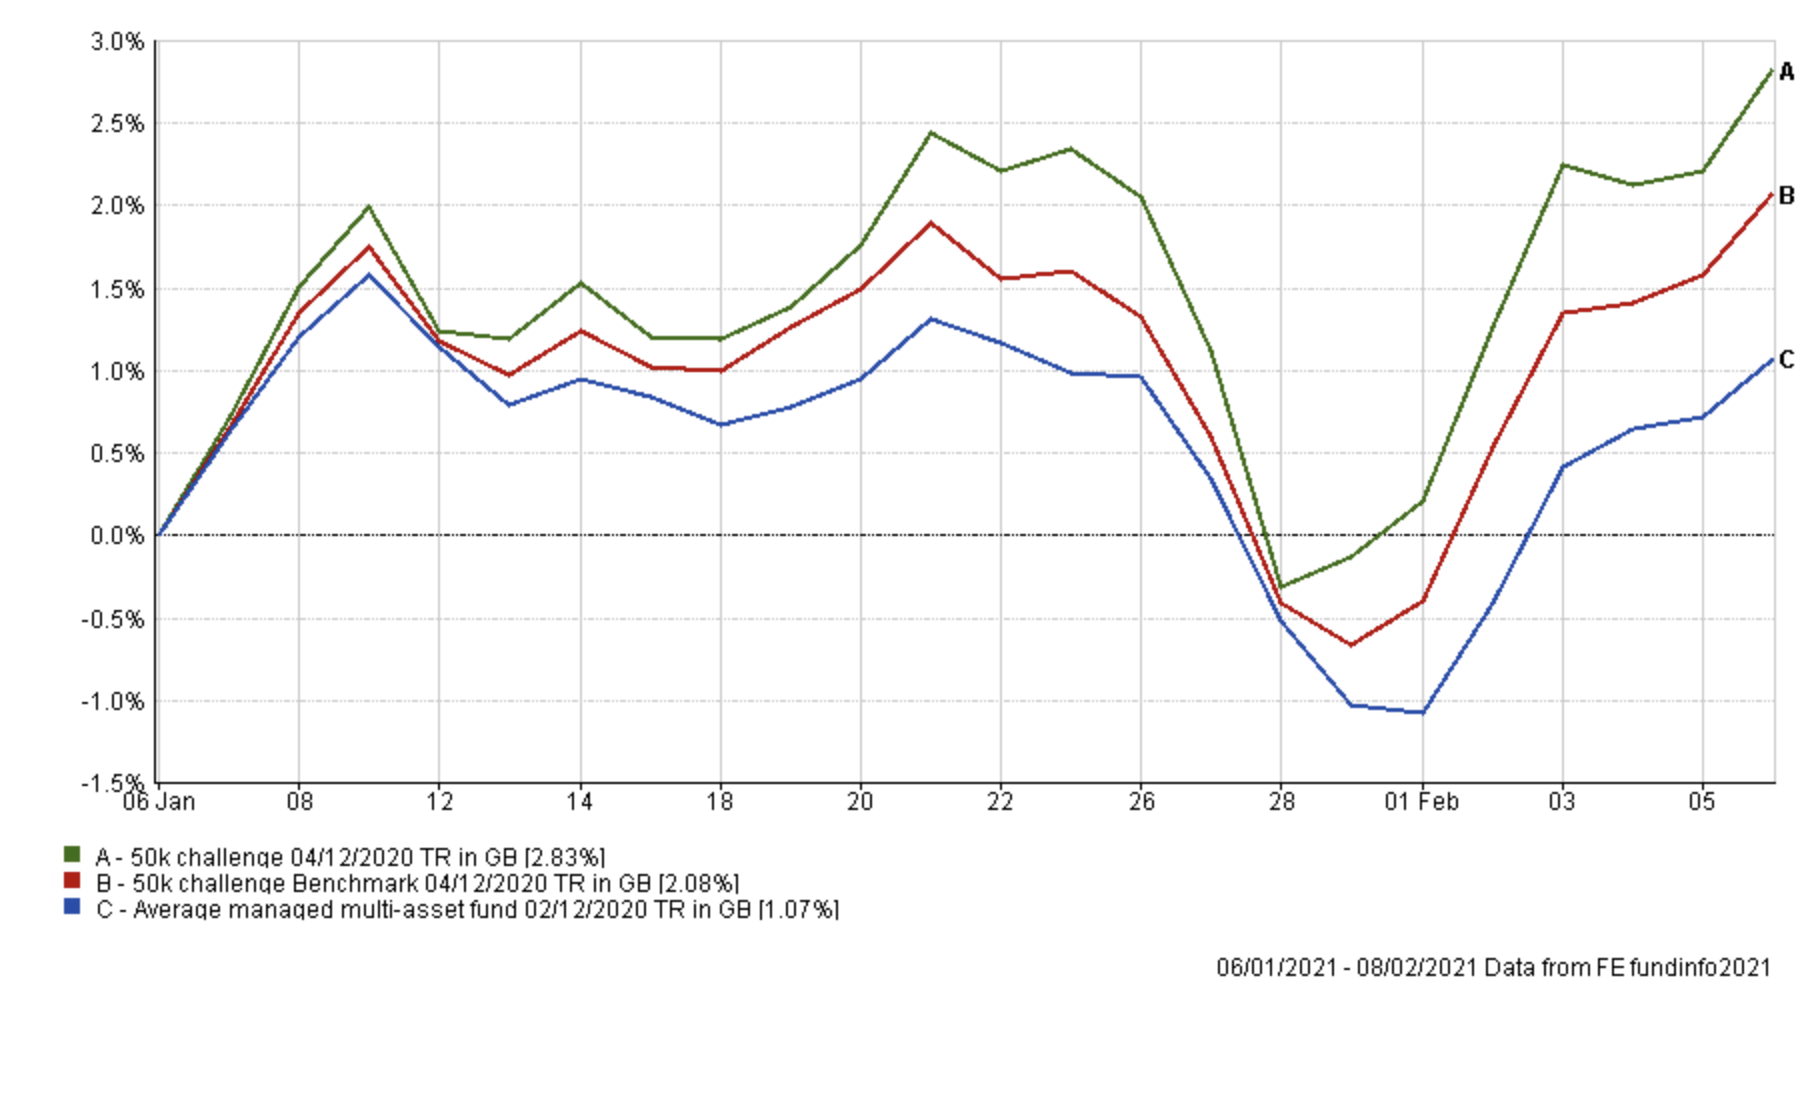
As you can see my portfolio further extended its lead over its benchmarks. Indeed, the chart below shows how my portfolio outperformed its benchmarks since my last portfolio review in January.
The table below shows the performance of the individual funds within my portfolio over the same time period. It is easy to see what has been driving the strong performance and what has been a drag. If you take my portfolio in its entirety and compare it to the performance of professionally managed funds within the Mixed Investment 40-85% Shares sector over the same period then only 11 out of 230 funds outperformed my portfolio. Those that outperformed my portfolio inevitably have a much greater equity exposure (up to 85%). The point is that while some parts of the portfolio lagged during January, this was more than offset by those areas performing strongly, as shown in the table. That is the benefit of diversification.
| Name | % Performance since last review 6th Jan 2021 |
| Baillie Gifford Long Term Global Growth Investment | 11.22 |
| Baillie Gifford Positive Change | 10.76 |
| Allianz Total Return Asian Equity | 10.14 |
| Invesco Global Emerging Markets (UK) | 8.19 |
| T. Rowe Price Global Focused Growth Equity | 5.67 |
| Premier Miton Diversified Growth | 2.9 |
| Fidelity UK Smaller Companies | 1.84 |
| Baillie Gifford European | 0.95 |
| Sarasin Global Dividend | 0.9 |
| Fidelity Global High Yield | 0.83 |
| VT Gravis Clean Energy Income | 0.78 |
| ASI Strategic Bond | -0.06 |
| JPM Japan | -1.74 |
| iShares Physical Gold ETC | -6.34 |
It's good to see that my faith in the 80-20 Investor process has been rewarded, as has my decision to not make any changes last month, with my £50k portfolio hitting a new all-time high value of £75,650. Let's hope for my portfolio that the old adage "as goes January so goes the year" holds true.
As is the routine in my portfolio reviews, the table below shows which funds within my portfolio are in the current BOTB or BFBS tables and which are not. Those funds in green are still in the BOTB while those in orange are not in the BOTB but remain in the BFBS list. Meanwhile, any funds in red have dropped out of both shortlists.
| Name | Allocation % (rounded) | Risk | Sector | ISIN Code |
| Allianz Total Return Asian Equity | 3 | Medium | Asia Pacific Excluding Japan |
GB00B1FRQV53
|
| ASI Strategic Bond | 16 | Low | Sterling Strategic Bond |
GB00BWK27X12
|
| Baillie Gifford European | 3.5 | Medium | Europe Excluding UK | GB0006058258 |
| Baillie Gifford Long Term Global Growth Investment | 5 | High | Global |
GB00BD5Z0Z54
|
| Baillie Gifford Positive Change | 3 | High | Global |
GB00BYVGKV59
|
| Fidelity Global High Yield | 8 | Medium | Sterling High Yield |
GB00B7K7SQ18
|
| Fidelity UK Smaller Companies | 7.5 | High | UK Smaller Companies |
GB00B7VNMB18
|
| Invesco Global Emerging Markets (UK) | 10 | High | Global Emerging Markets |
GB00B3RW7S64
|
| iShares Physical Gold ETC | 5 | Medium | Commodity & Energy ETF | IE00B4ND3602 |
| JPM Japan | 2.5 | Medium | Japan |
GB00B1XMTP77
|
| Premier Diversified Growth | 9.5 | Medium | Mixed Investment 40-85% Shares | GB00B8BJV423 |
| Sarasin Global Dividend | 8.5 | Medium | Global Equity Income |
GB00BGDF8F44
|
| T. Rowe Price Global Focused Growth Equity | 7.5 | Medium | Global | GB00BD446774 |
| VT Gravis Clean Energy Income | 11 | Medium | Global |
GB00BFN4H792
|
If you recall, last time every fund within my portfolio was in the BOTB and/or BFBS tables. Since then Fidelity Global High Yield has reentered the BOTB while JPM Japan, Sarasin Global Dividend, T. Rowe Price Global Focused Growth Equity and VT Gravis Clean Energy Income have dropped out of the BOTB and BFBS tables. That's not to say they have become terrible funds and those of you who follow my portfolio updates will know that I seldom ditch a fund as soon as it drops out of the 80-20 Investor tables, especially if its performance has remained good.
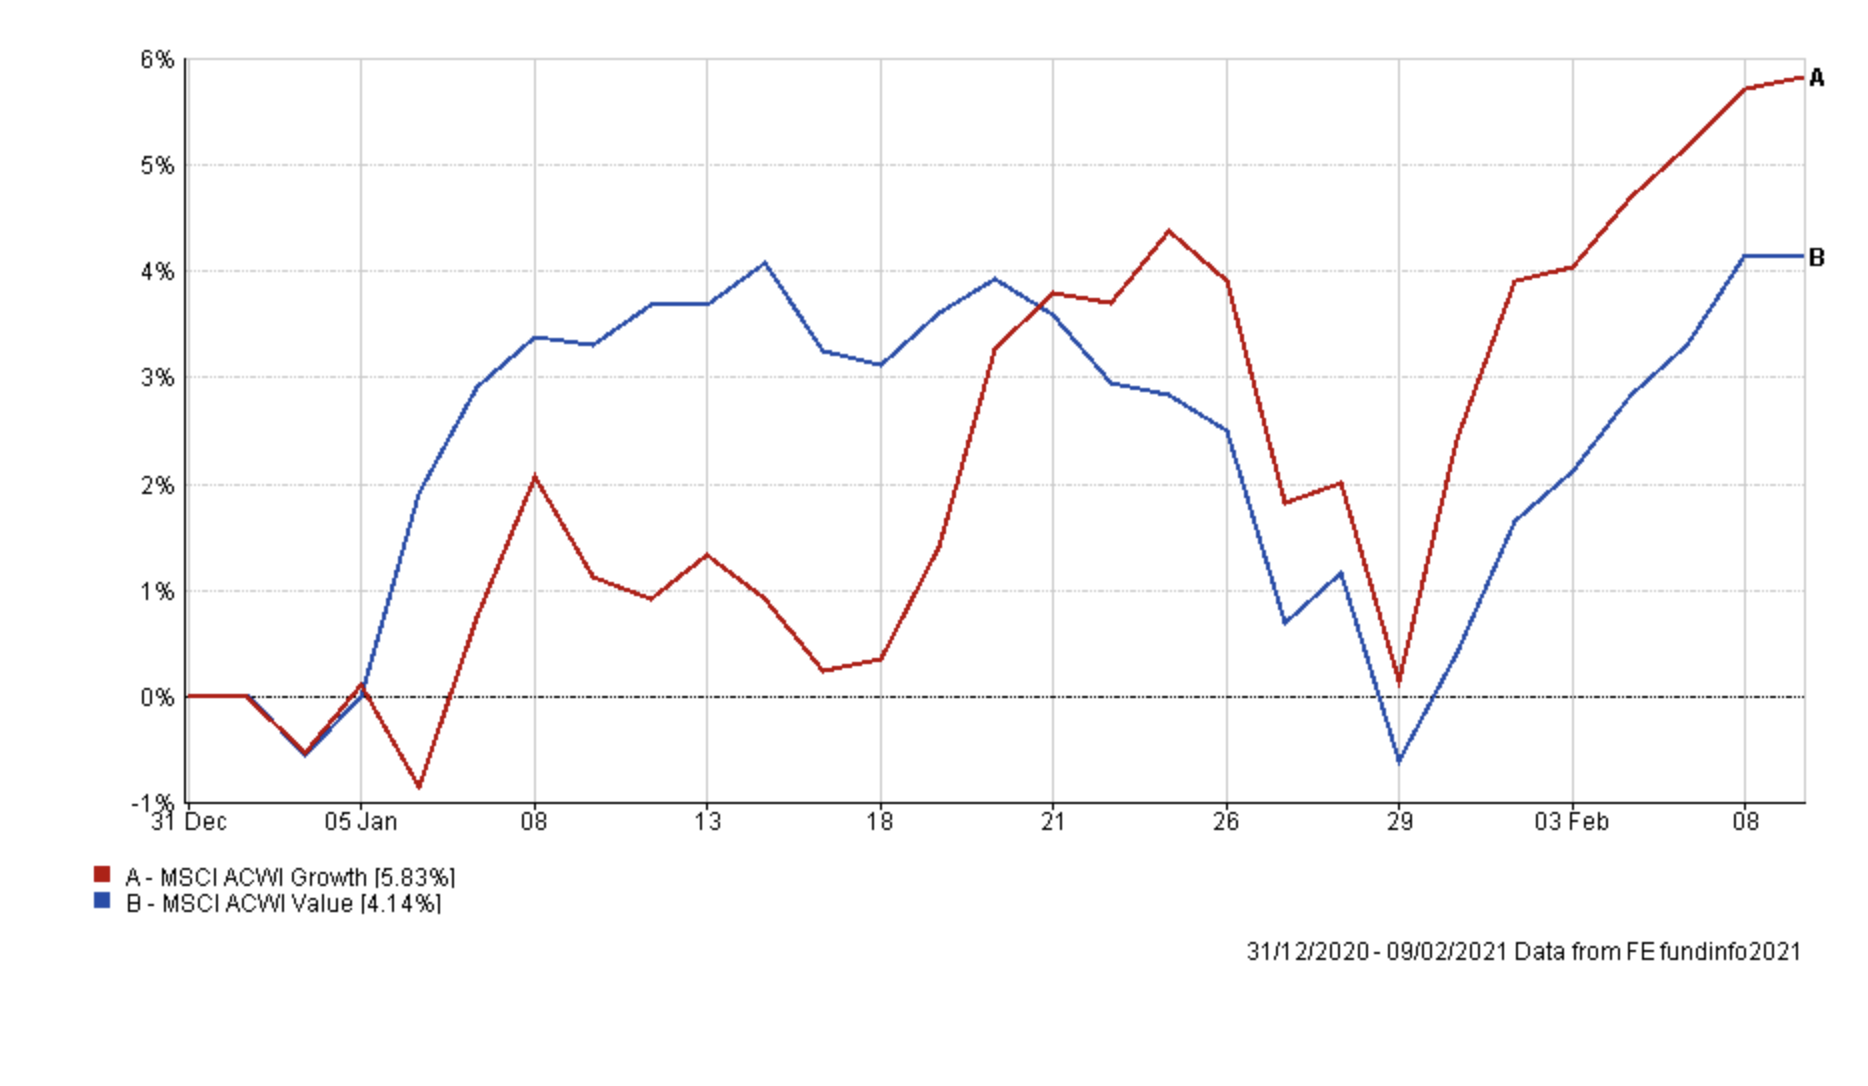
Sarasin Global Dividend is a value fund while T. Rowe Price Global Focused Growth Equity strikes a balance between value and growth. It is this exposure to value stocks that has impacted their performance year to date. The chart below shows how value stocks globally started 2021 strongly but then faded as investors moved back into growth stocks.
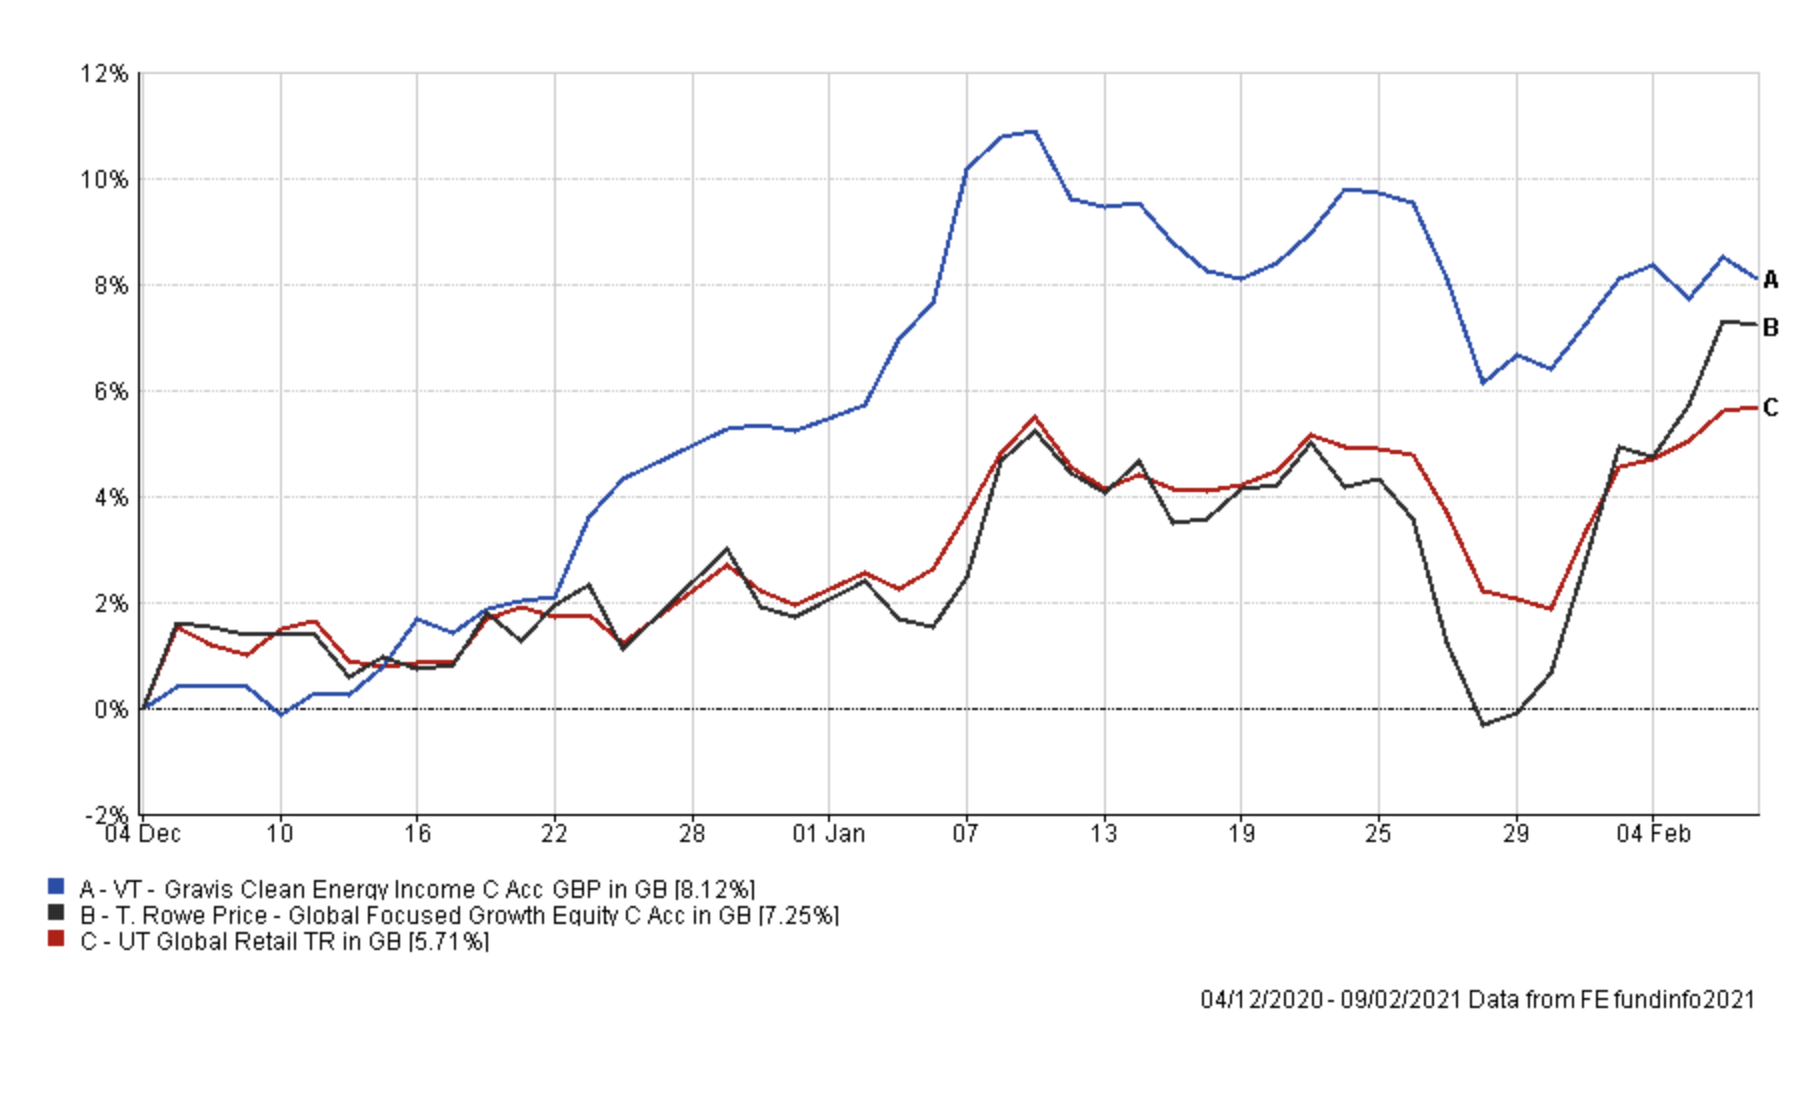
Turning to T. Rowe Price Global Focused Growth Equity the chart below shows its performance since I first introduced it into my portfolio in December. The chart also shows the performance of VT Gravis Clean Energy Income. You can see why I'm in no rush to remove either from my portfolio.
Interestingly there was a general market wobble at the end of January as concerns over the fallout from Gamestop speculation worried investors. The S&P 500 fell 3.6% in a matter of days, as did the FTSE 100. Other global indices typically fell between 3-5%. The table below shows how the funds within my portfolio performed during those few days.
| Fund | % return 25th Jan to 29th Jan |
| iShares Physical Gold | -0.08 |
| Fidelity Global High Yield | -0.19 |
| ASI Strategic Bond | -0.32 |
| Fidelity UK Smaller Companies | -1.32 |
| Premier Miton Diversified Growth | -1.54 |
| Sarasin Global Dividend | -2.36 |
| VT Gravis Clean Energy Income | -2.79 |
| Baillie Gifford Positive Change | -3.16 |
| Baillie Gifford Long Term Global Growth Investment | -3.84 |
| Baillie Gifford European | -4.1 |
| T. Rowe Price Global Focused Growth Equity | -4.24 |
| Invesco Global Emerging Markets (UK) | -4.79 |
| Allianz Total Return Asian Equity | -5.32 |
| JPM Japan | -5.48 |
You can see that gold, VT Gravis Clean Energy Income and Sarasin Global Dividend performed better on a relative basis to other parts of my portfolio. The former also helped reduce the negative impact that a strengthening pound has had on my portfolio's global equity exposure, given that the fund is partially currency hedged. My small holding in a gold ETF is a longer-term play as discussed at the time of its introduction last summer and so will remain.
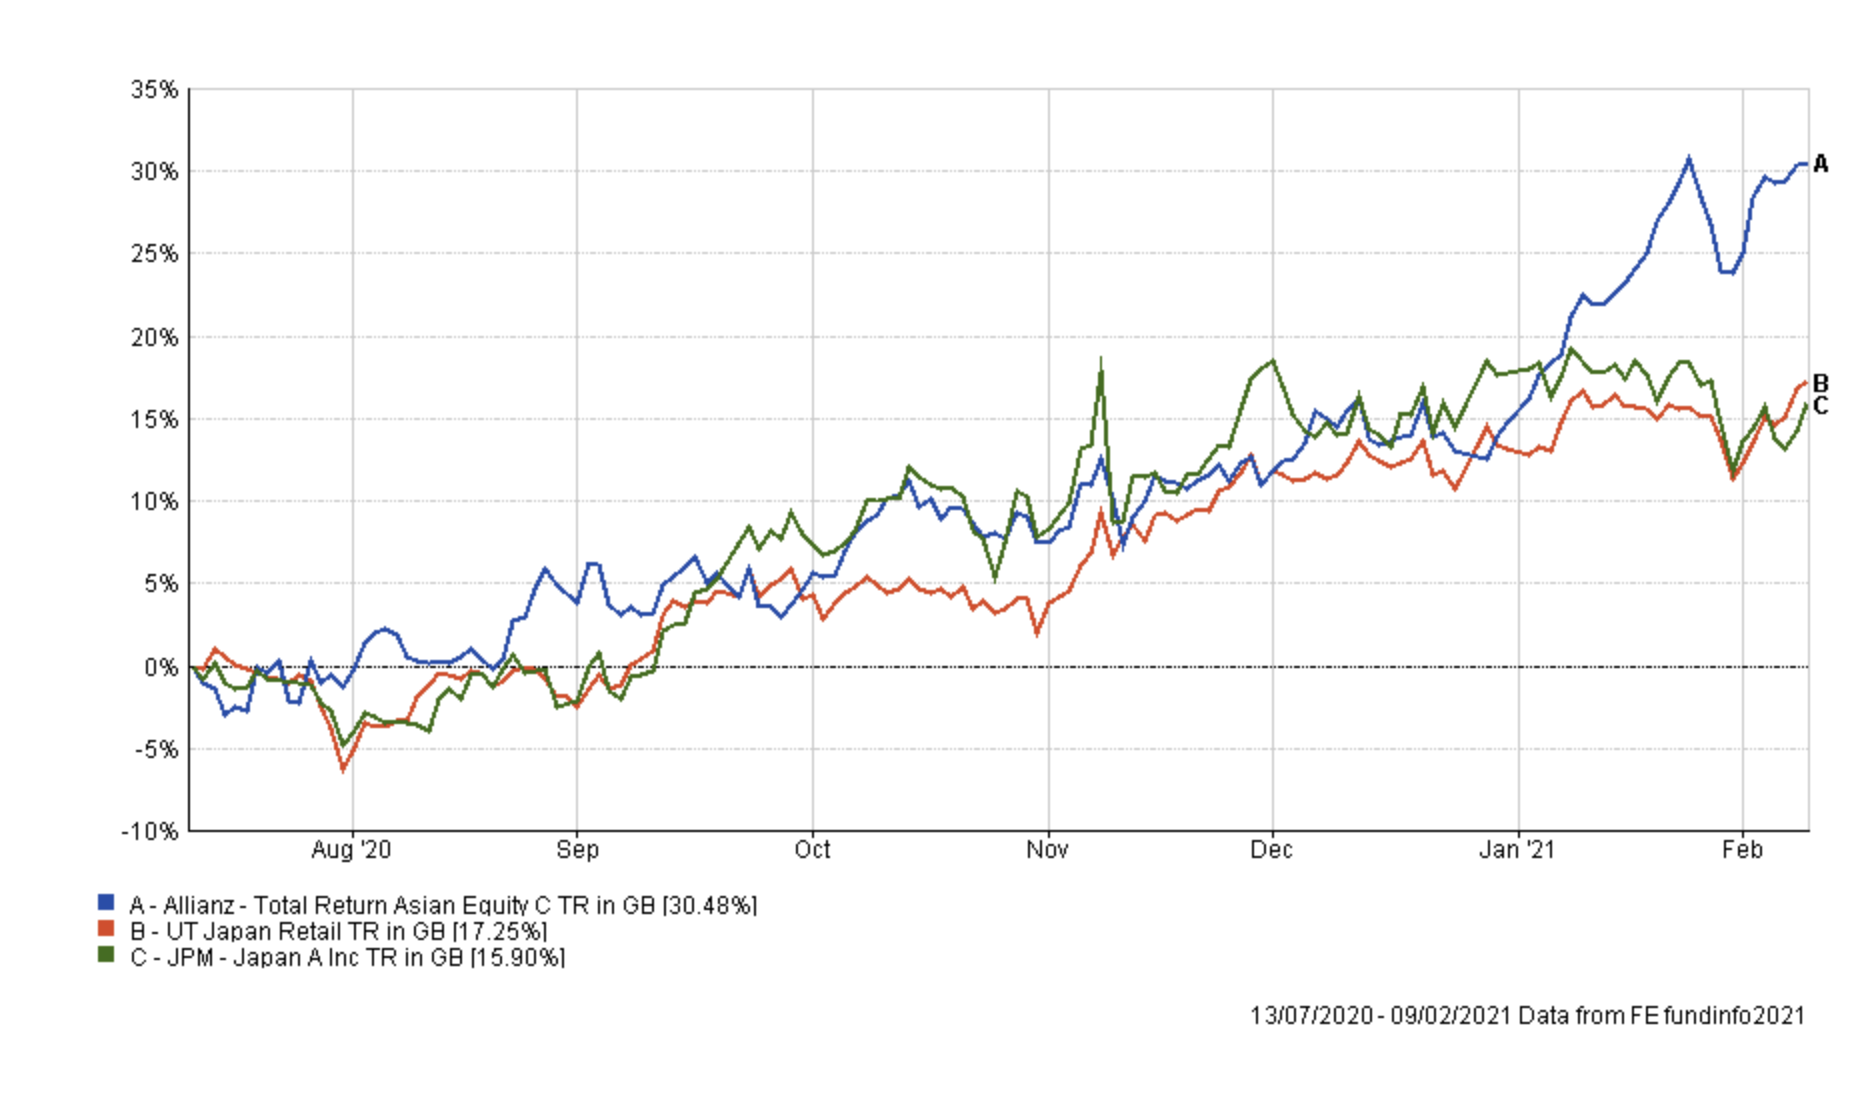
Interestingly one of the worst performers in the above table was JPM Japan. Back in December, I started to reduce my exposure to the JPM Japan fund and given its recent performance versus its peer group (as shown below) I plan to finally remove it. The first chart below shows the performance of the JPM fund against its peer group since I've held it. The chart also shows the performance of Allianz Total Return Asian Equity, which also didn't fare that well during the recent sell-off.
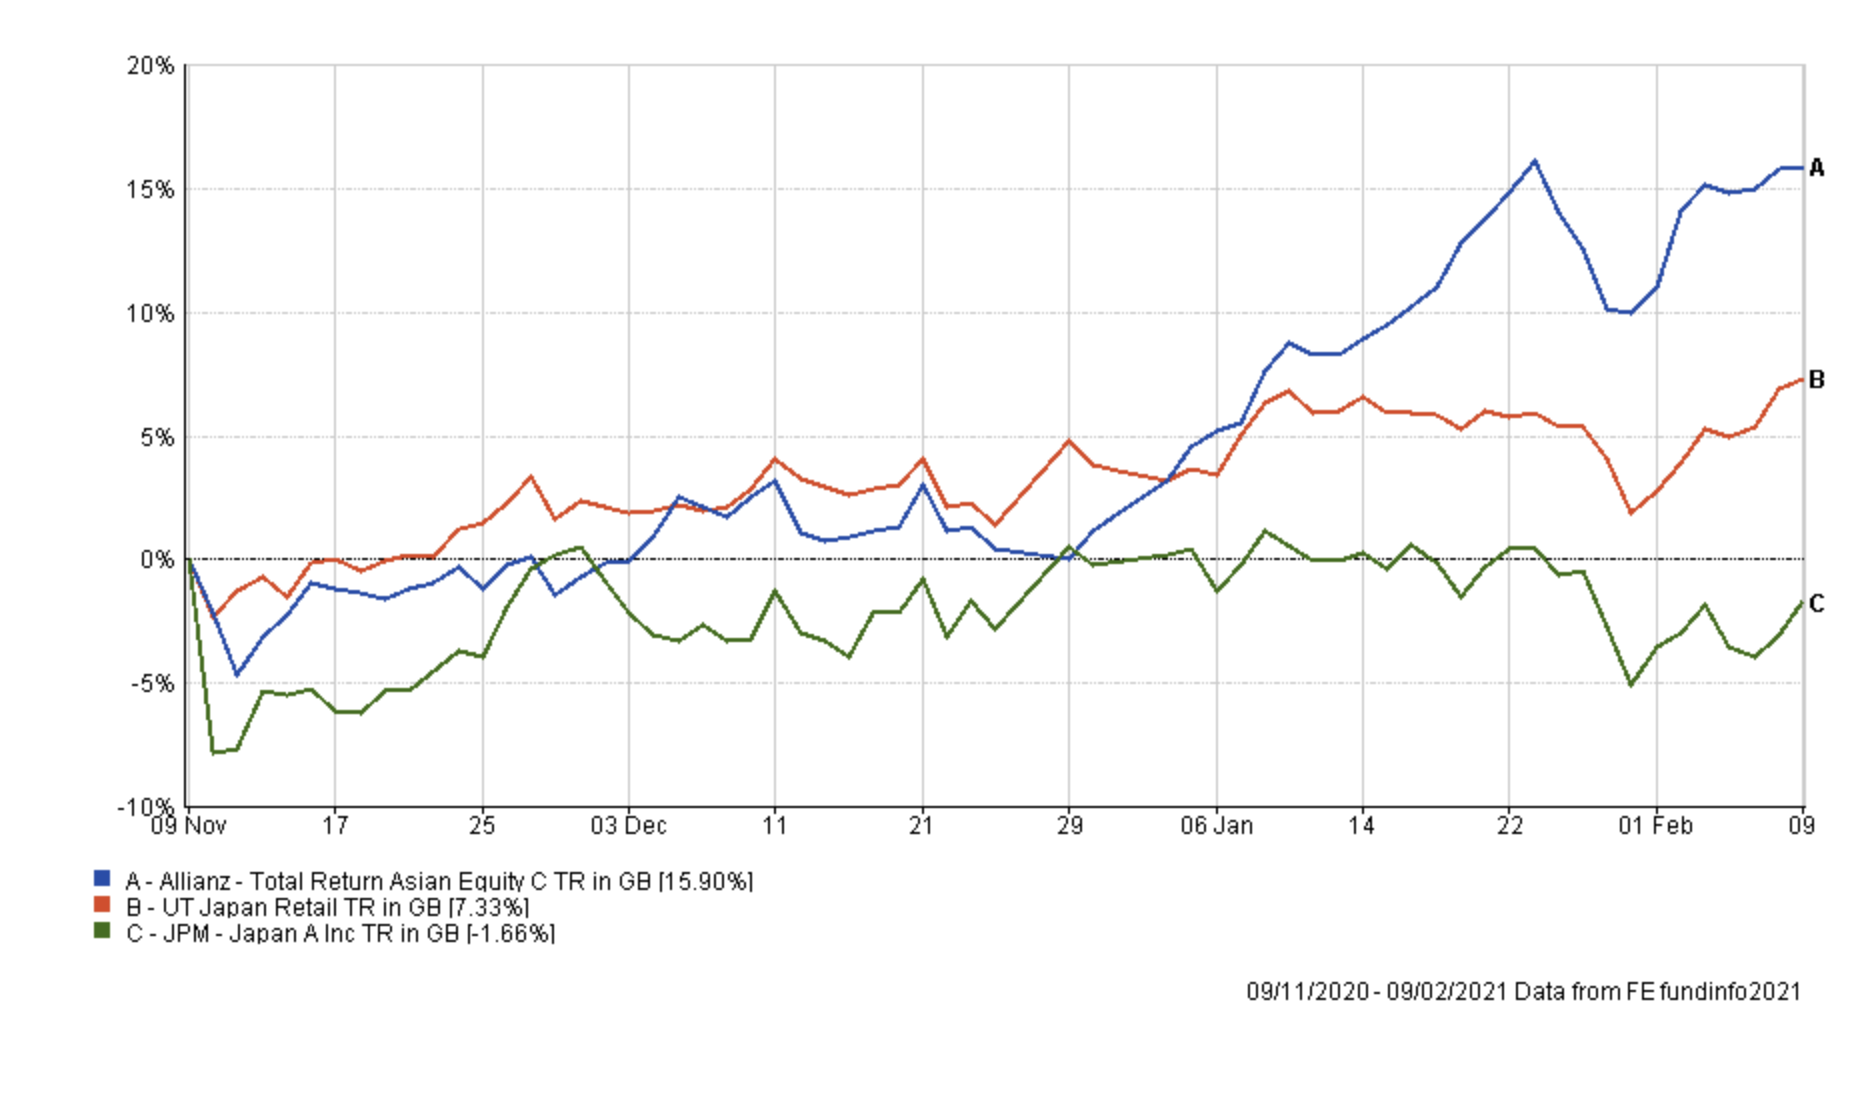
The second chart shows the performance over the last three months. You can see that the JPM fund has seriously underperformed its peers and while it only accounts for around 2% of my portfolio it has added nothing in terms of upside nor provided any downside protection. For that reason, I am removing the fund.
Fund switch
I only plan to make one fund switch this month. As mentioned above there is little compulsion to make wholesale changes given how well the portfolio as a whole has performed in recent months. Also given the strength of the market rally I prefer to remain invested rather than tinker too much and sit on the sidelines while transactions are processed. So the switch I plan to make is:
100% out of JPM Japan and 100% into Allianz Total Return Asian Equity - as stated earlier, JPM Japan has continued to disappoint since I started reducing my holding at the start of November. So I am now completely removing it from my portfolio. I will place the proceeds into Allianz Total Return Asian Equity. As can be seen from the chart above the level of volatility is similar to that of the JPM Japan fund but it has enjoyed much more upside since the start of the year. Even after the switch is made, Allianz Total Return Asian Equity will only make up just over 5% of my portfolio, so still a relatively small holding. The switch helps to increase my portfolio's exposure to Chinese equities, bringing it more in line with the BOTB asset mix, but also gives increased exposure to nearly all of the themes (with the exception of Russia) discussed in the recent piece titled 'Emerging market opportunities'. The switch also helps consolidate my portfolio and bring down the number of fund holdings within it to 13.
My portfolio
So my portfolio now looks like this:
| Name | Allocation % (rounded) | Risk | Sector | ISIN Code |
| Allianz Total Return Asian Equity | 5.5 | Medium | Asia Pacific Excluding Japan | GB00B1FRQV53 |
| ASI Strategic Bond | 15 | Low | Sterling Strategic Bond | GB00BWK27X12 |
| Baillie Gifford European | 3.5 | Medium | Europe Excluding UK | GB0006058258 |
| Baillie Gifford Long Term Global Growth Investment | 5.5 | High | Global | GB00BD5Z0Z54 |
| Baillie Gifford Positive Change | 3.5 | High | Global | GB00BYVGKV59 |
| Fidelity Global High Yield | 8 | Low | Sterling High Yield | GB00B7K7SQ18 |
| Fidelity UK Smaller Companies | 7.5 | High | UK Smaller Companies | GB00B7VNMB18 |
| Invesco Global Emerging Markets (UK) | 11 | High | Global Emerging Markets | GB00B3RW7S64 |
| iShares Physical Gold ETC | 4.5 | Medium | Commodity & Energy ETF | IE00B4ND3602 |
| Premier Diversified Growth | 9.5 | Medium | Mixed Investment 40-85% Shares | GB00B8BJV423 |
| Sarasin Global Dividend | 8 | Medium | Global Equity Income | GB00BGDF8F44 |
| T. Rowe Price Global Focused Growth Equity | 7.5 | Medium | Global | GB00BD446774 |
| VT Gravis Clean Energy Income | 11 | Medium | Global | GB00BFN4H792 |
My Portfolio asset mix
My portfolio asset mix is as shown below which is still around 61% equities. The numbers in brackets are last month's equivalent figures.
-
- UK Equities 12% (11%)
- North American Equities 14% (13%)
- Asian/Emerging Market Equities 11% (10%)
- Japanese Equities 0% (3%)
- European Equities 6% (8%)
- Chinese equities 5% (3%)
- Other equity 8% (7%)
- Commodities and energy 9% (9%)
- UK Fixed Interest 7% (7%)
- Global Fixed Interest 14% (16%)
- Cash 0% (0%)
- Alternative Investment Strategies 14% (13%)
Damien's higher risk and lower risk portfolios
Using the logic described in my post: Update to Damien’s alternative risk portfolios I created hypothetical higher and lower risk versions of my portfolio below:
Higher risk
| Fund | Allocation % |
| Invesco Global Emerging Markets (UK) | 14 |
| VT Gravis Clean Energy Income | 14 |
| Premier Diversified Growth | 12 |
| Sarasin Global Dividend | 10 |
| Fidelity UK Smaller Companies | 10 |
| T. Rowe Price Global Focused Growth Equity | 10 |
| Allianz Total Return Asian Equity | 7 |
| Baillie Gifford Long Term Global Growth Investment | 7 |
| iShares Physical Gold ETC | 6 |
| Baillie Gifford European | 5 |
| Baillie Gifford Positive Change | 5 |
Lower risk
| Fund | Allocation % |
| ASI Strategic Bond | 21 |
| VT Gravis Clean Energy Income | 15 |
| Premier Diversified Growth | 13 |
| Fidelity Global High Yield | 11 |
| Sarasin Global Dividend | 11 |
| T. Rowe Price Global Focused Growth Equity | 10 |
| Allianz Total Return Asian Equity | 8 |
| iShares Physical Gold ETC | 6 |
| Baillie Gifford European | 5 |

£200 Pension Cashback Offer
Make a qualifying deposit or transfer a pension to our partner Interactive Investor.
- Deposit or transfer a pension of at least £20k and you could earn £200 cashback
- Terms and Fees apply, Capital at risk
- New & Existing customers opening a SIPP
- Offer ends 31st July 2026
Before starting your transfer, check you won't lose any valuable benefits (such as guaranteed annuity rates or a lower protected pension age) and find out what exit fees you might have to pay
