

The background to my portfolio
Back in March 2015 I decided to invest £50,000 of my own money using 80-20 Investor. The purpose was twofold, firstly to show how you can use 80-20 Investor to invest and outperform the market with only a few minutes effort every now and then. Secondly, no other investment commentator, journalist or research provider invests their own money for fear of failing. This is a sorry state of affairs and is precisely why I committed to openly running my own portfolio for 80-20 Investor members to see.
Since then I have periodically changed my portfolio using the fund suggestions provided by the 80-20 Investor algorithm and associated research. I always disclose the changes at the time they are made.
Performance update
As is usual in my portfolio reviews, the chart below shows how my portfolio has outperformed since I started the challenge in March 2015, which is almost seven years ago. The green line is the performance of my portfolio while the red line is the benchmark showing the average return achieved by professional fund managers given the same asset mix. To accurately calculate this I have used the average return for each sector in which my portfolio invested. The blue line shows what the average multi-asset fund with comparable equity content achieved. In other words, the red line would show the extra performance added by just the asset mix of my portfolio (where I was invested i.e European equities etc) over picking a typical multi-asset fund (the blue line). While the green line (which is my actual performance) shows the impact of being in the right funds at the right time, as identified by the 80-20 Investor algorithm.
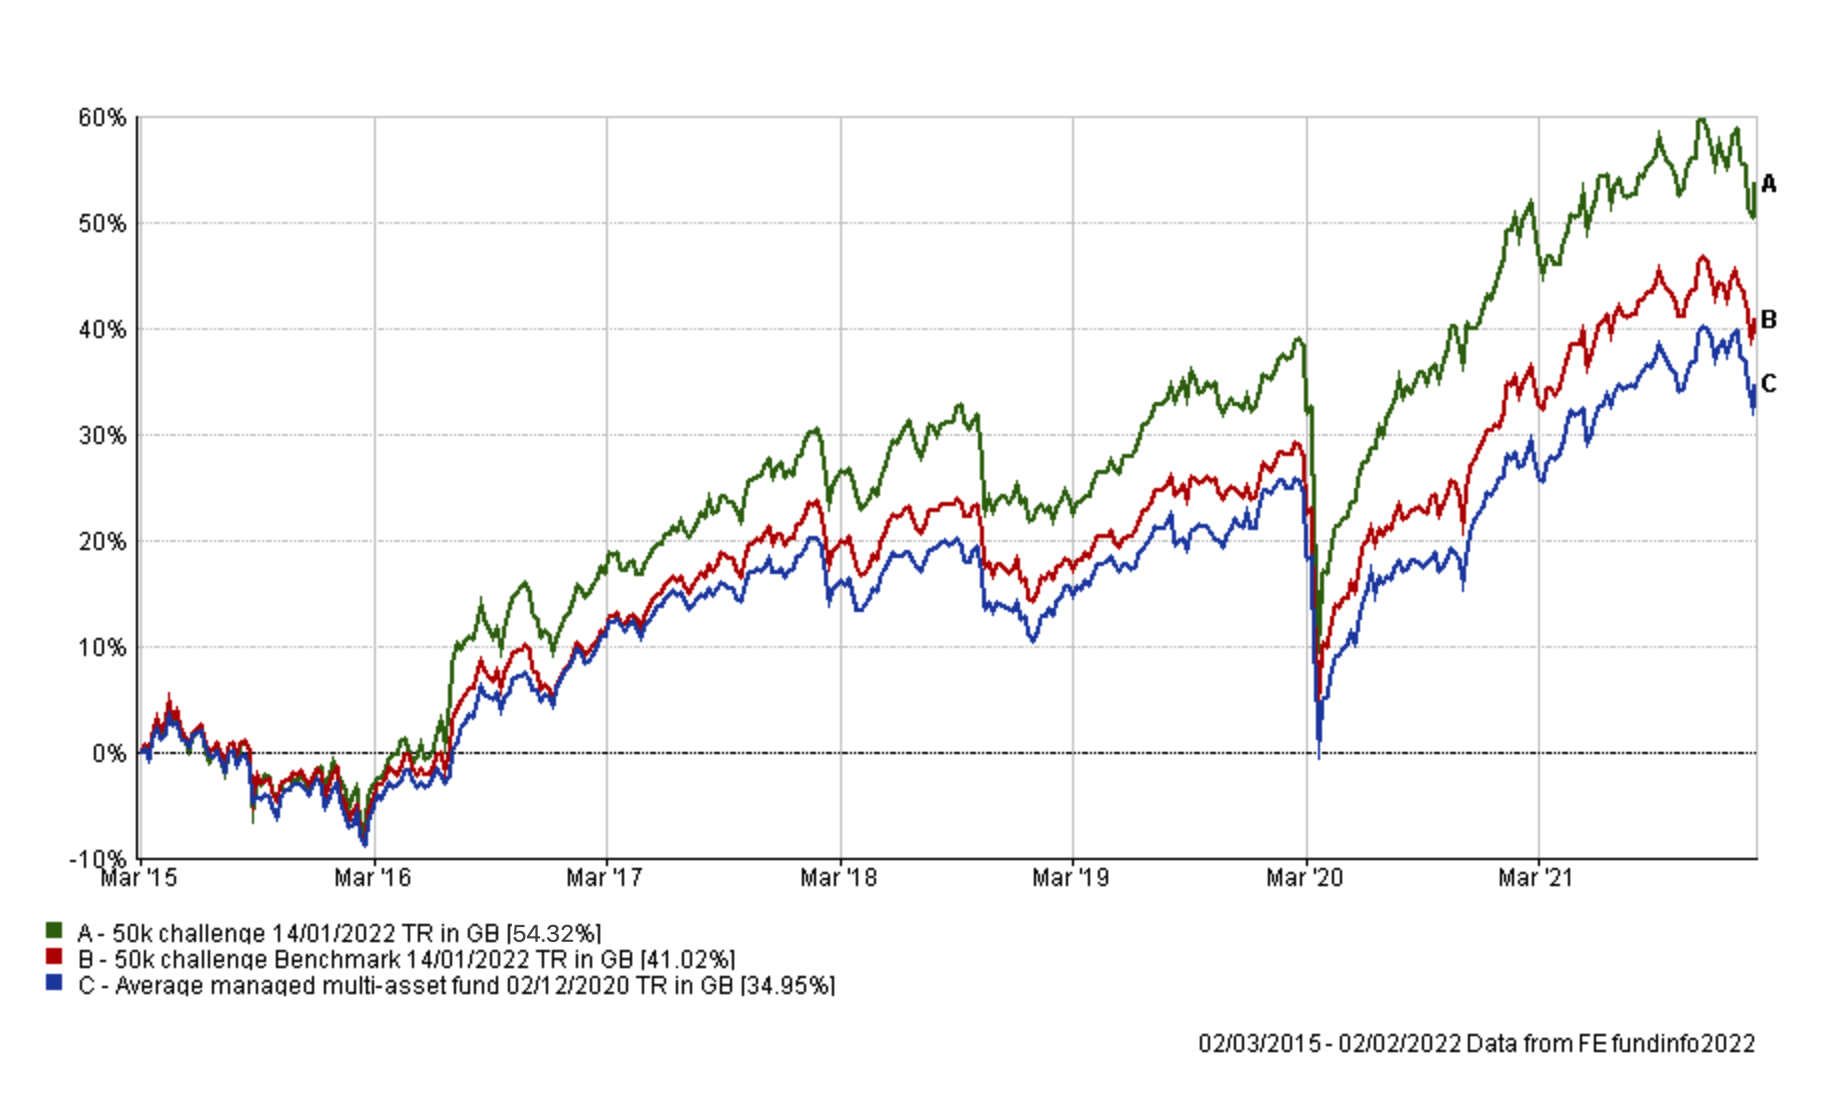
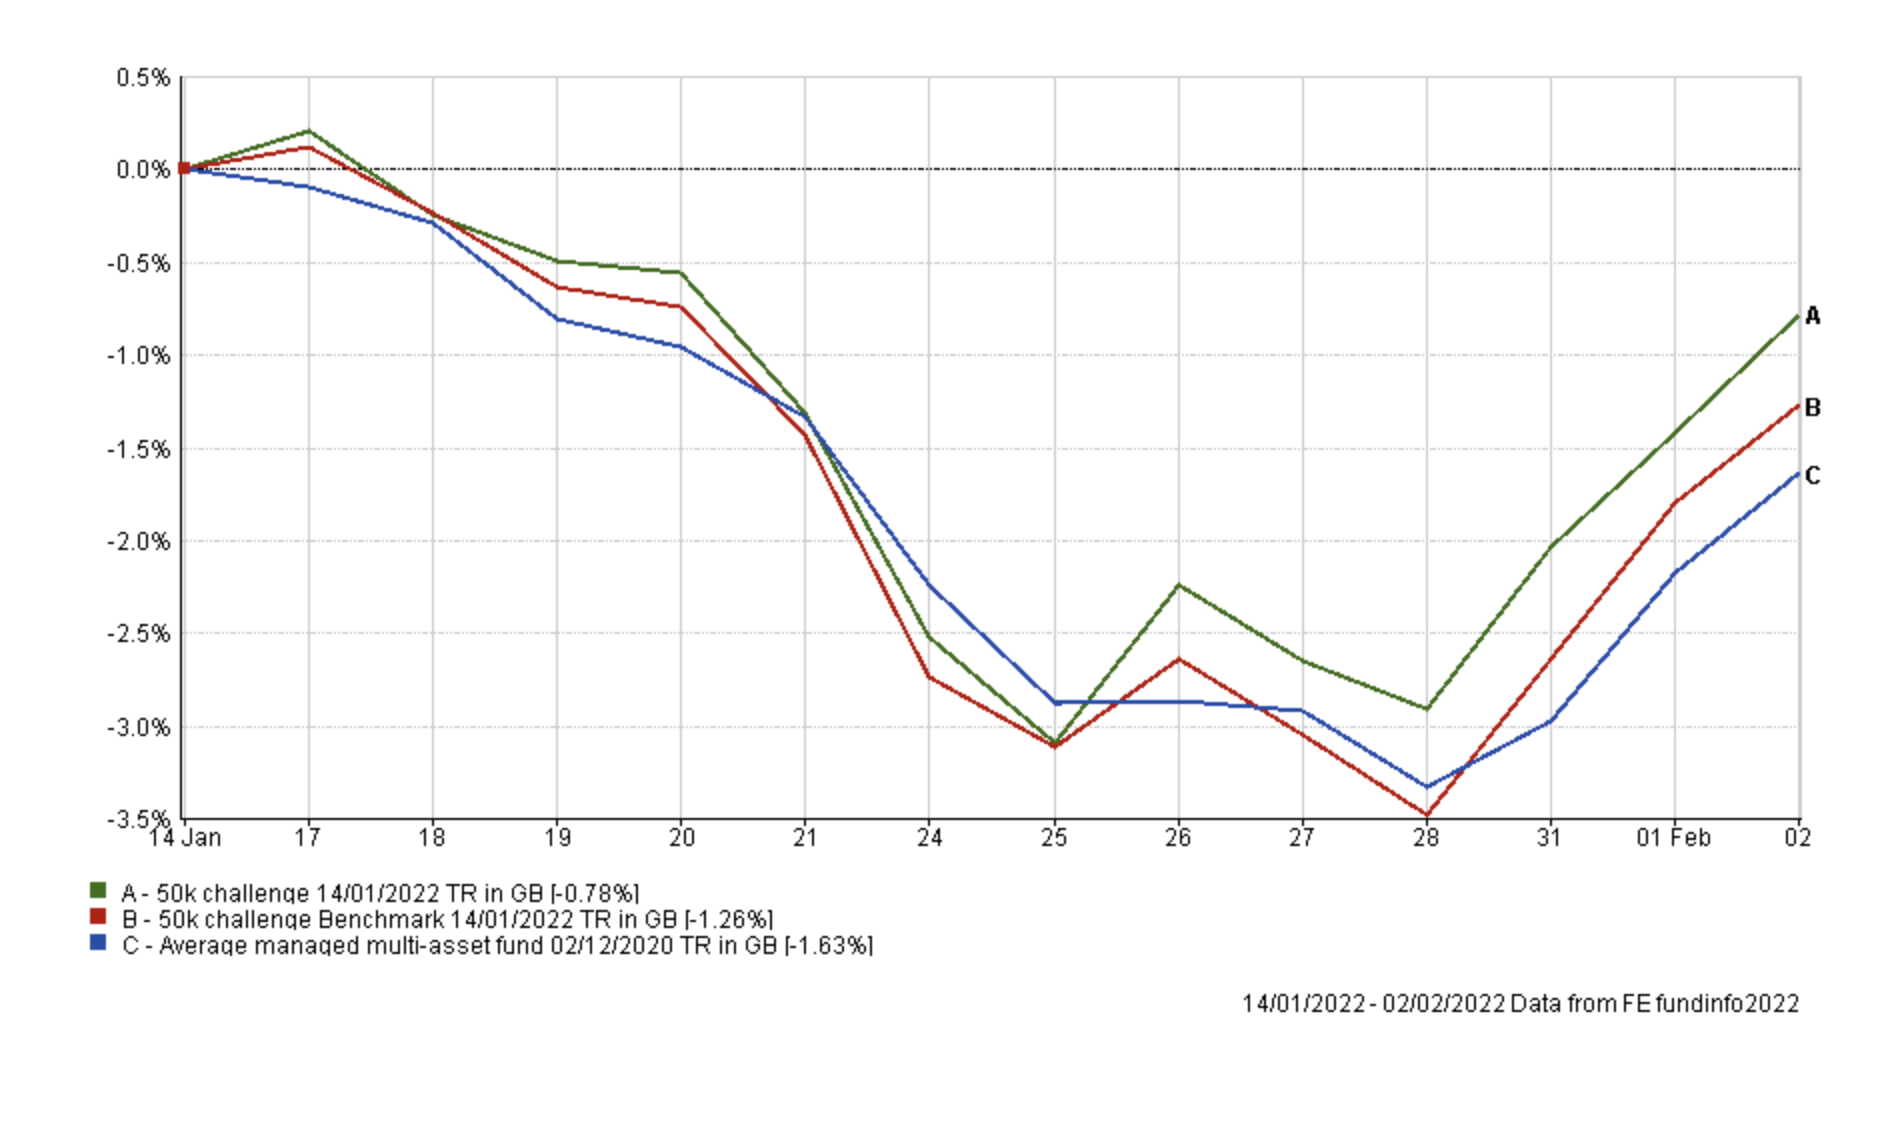
As you can see, after a tricky month in investment markets my £50k portfolio still sits just 5% below its all-time high and has extended its lead over its benchmarks. The chart below shows how my portfolio performed versus its benchmarks since my last review. Following the fund switches I made last time it has outperformed both benchmarks, although it is too short a timeframe to place much emphasis on.
January was a negative month for equity markets generally, but particularly for US technology stocks, although they are attempting to rebound. The chart below shows the performance of each fund within my portfolio since my last review and since the start of 2022. Commodities and energy stocks have been the clear winners so far this year.
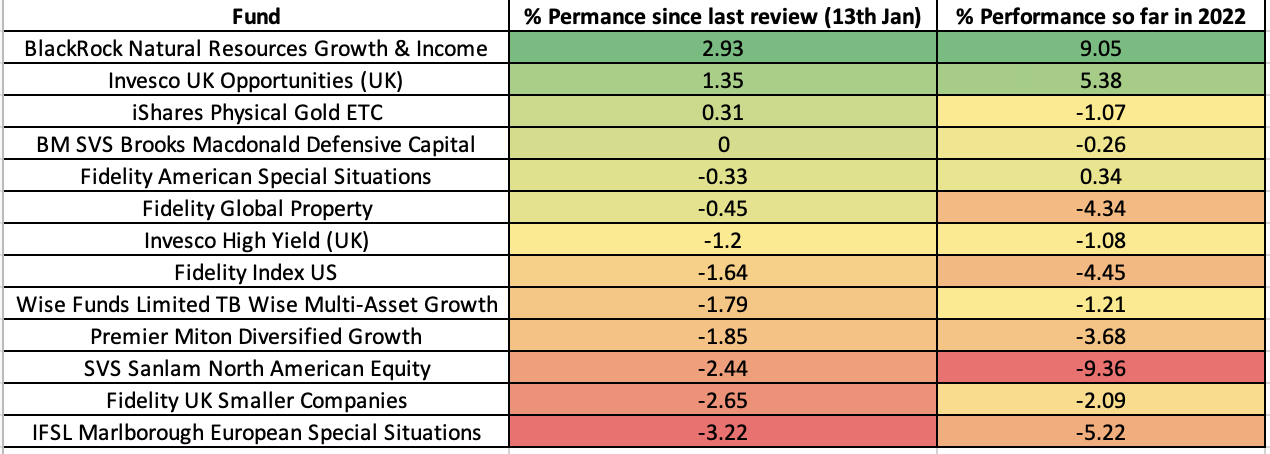
As usual, the table below shows which funds within my current portfolio are in the current BOTB or BFBS tables and which are not. Those funds in green are still in the BOTB while those in orange are not in the BOTB but remain in the BFBS list. Meanwhile, any funds in red have dropped out of both shortlists.
| Name | Allocation % (rounded) | Risk | Sector | ISIN Code |
| BlackRock Natural Resources Growth & Income | 5 | High | Commodity/Natural Resource | GB00B6865B79 |
| Fidelity American Special Situations | 7.5 | Medium | North America | GB00B89ST706 |
| Fidelity Global Property | 5 | Medium | Property Other | GB00B7K2NZ09 |
| Fidelity UK Smaller Companies | 10 | High | UK Smaller Companies | GB00B7VNMB18 |
| Fidelity US Index | 11 | Medium | North America | GB00BJS8SH10 |
| IFSL Marlborough European Special Situations | 10 | High | Europe Excluding UK | GB0001719730 |
| Invesco High Yield (UK) | 7.5 | Low | Sterling High Yield | GB00B3RW7649 |
| Invesco UK Opportunities (UK) | 4 | Medium | UK All Companies | GB00B1W7HM62 |
| iShares Physical Gold ETC | 4 | Medium | Commodity & Energy ETF | IE00B4ND3602 |
| Premier Miton Diversified Growth | 5 | Medium | Mixed Investment 40-85% Shares | GB00B8BJV423 |
| SVS BM Brooks Macdonald Defensive Capital | 15 | Low | Targeted Absolute Return | GB00B61MR835 |
| SVS Sanlam North American Equity | 7.5 | Medium | North America | GB0007655698 |
| Wise Multi-Asset Growth | 8.5 | Medium | Flexible Investment | GB0034272533 |
The first thing to point out is that the following three funds once again remain outside of the BOTB and BFBS and are highlighted in red above:
- Premier Diversified Growth
- Wise Multi-Asset Growth
- IFSL Marlborough European Special Situations
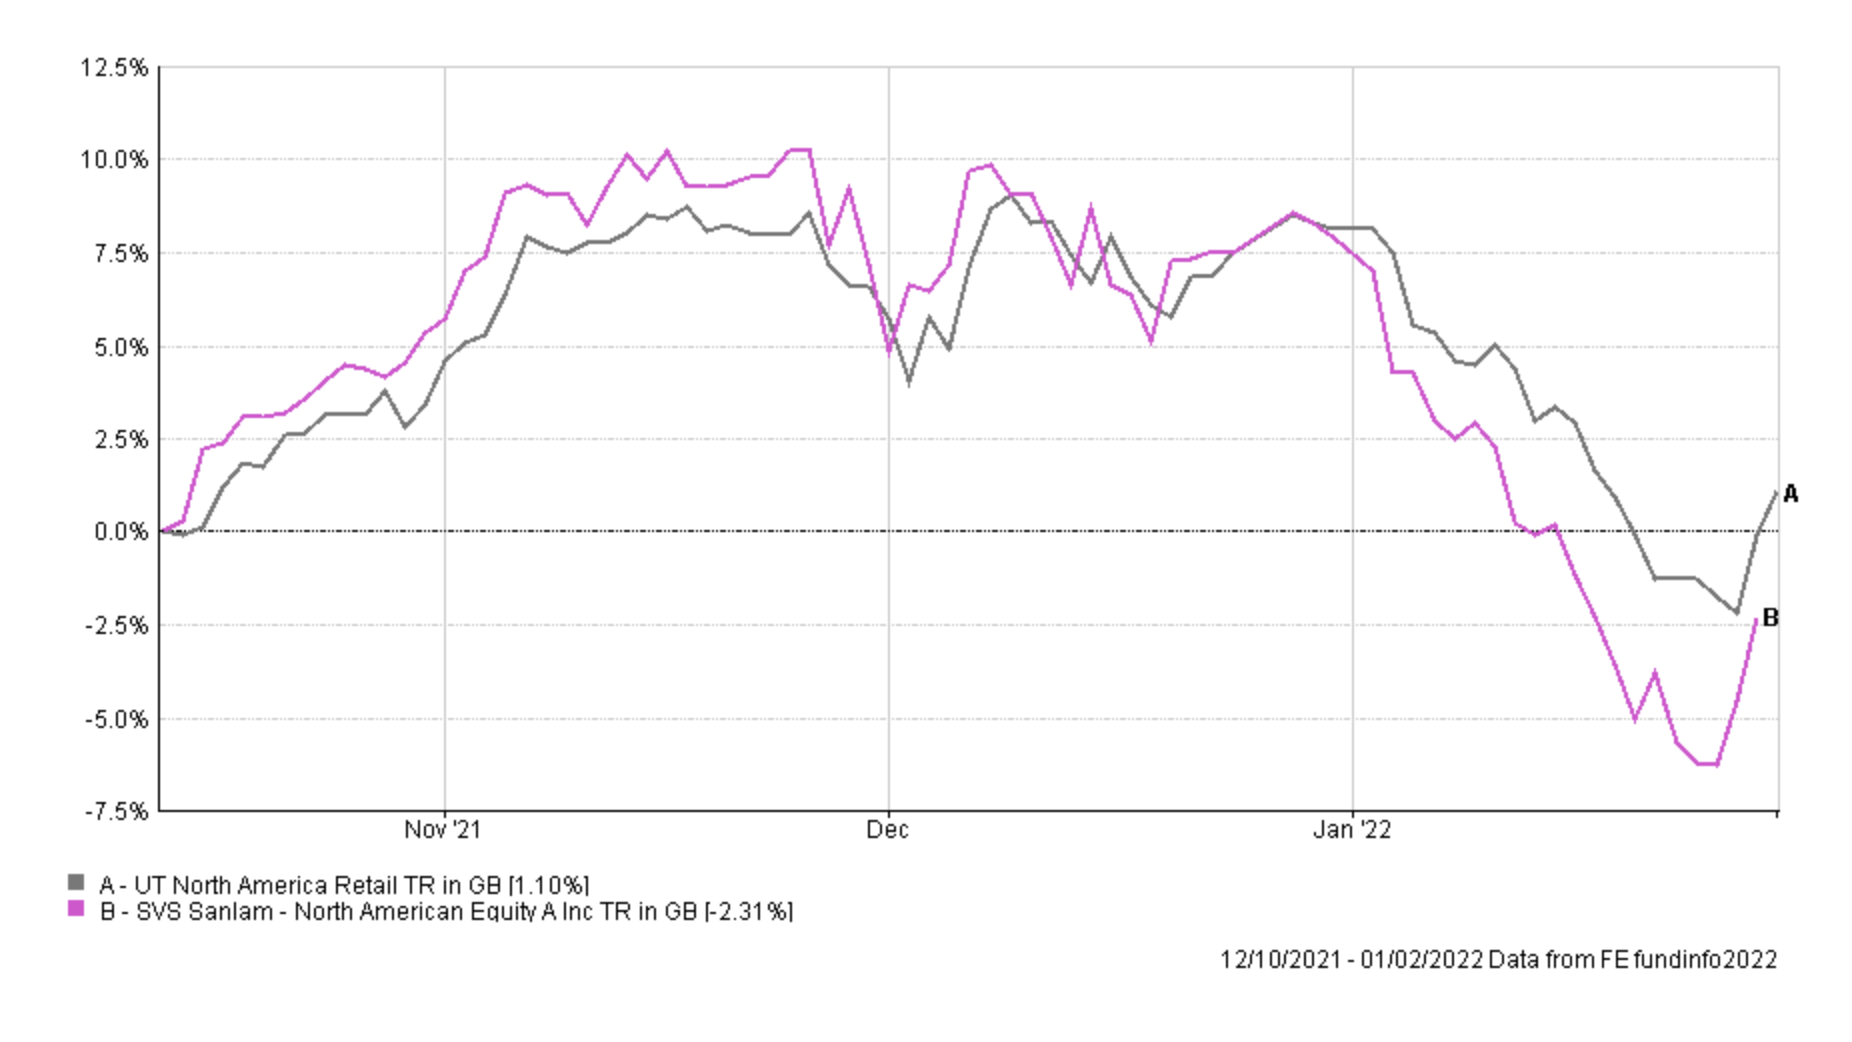
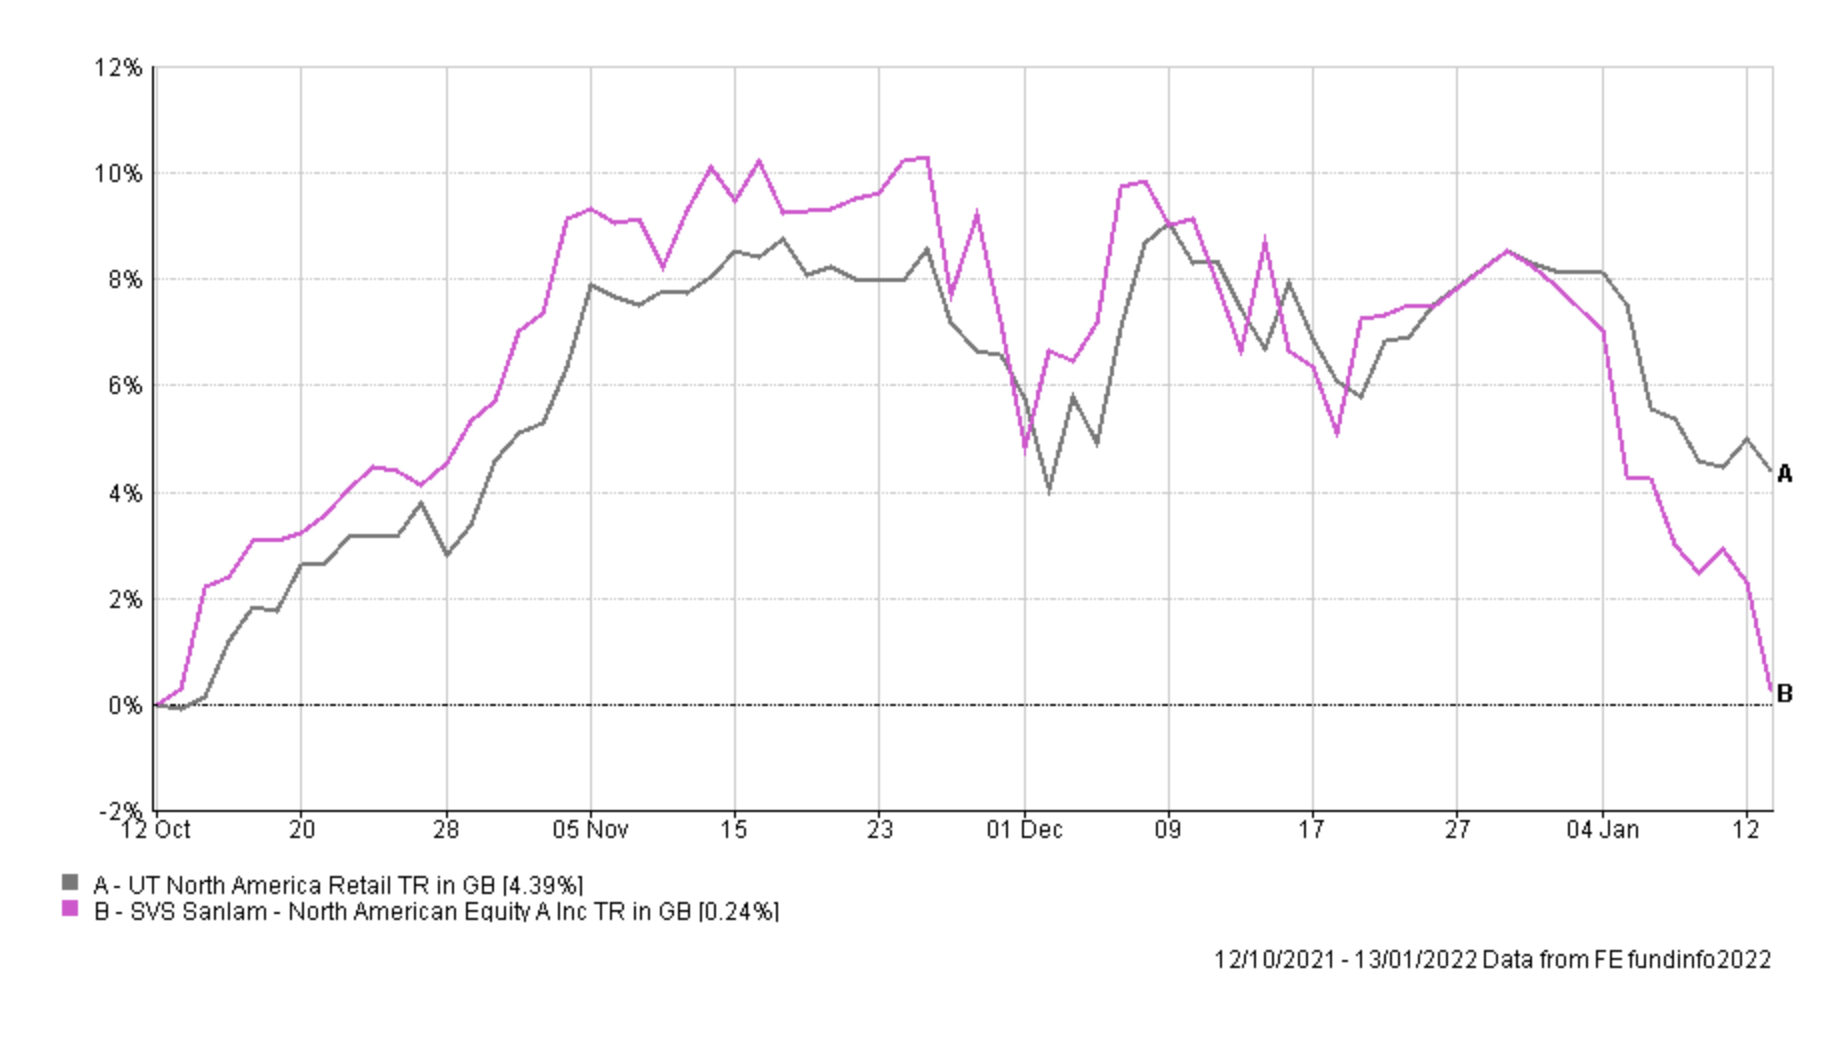
They have now been joined by SVS Sanlam North American Equity which was hurt by the sell-off in US technology stocks. The chart below shows the performance of the fund since it first entered my portfolio in October. Despite the aggressive sell-off in US technology stocks it has recovered to almost break even but still underperformed its sector average, triggering a stop loss alert along the way.
You may recall that I started reducing my exposure to this fund last month which, with the benefit of hindsight, was a prudent/fortunate thing to do. The chart below shows how the fund was still in profit within my portfolio last month when I sold a third of my holding. So this month I will finish removing the fund from my portfolio. In doing so I will also bring my US equity exposure back down in line with the new asset mix of the BOTB, which now has more of a focus on UK equities.
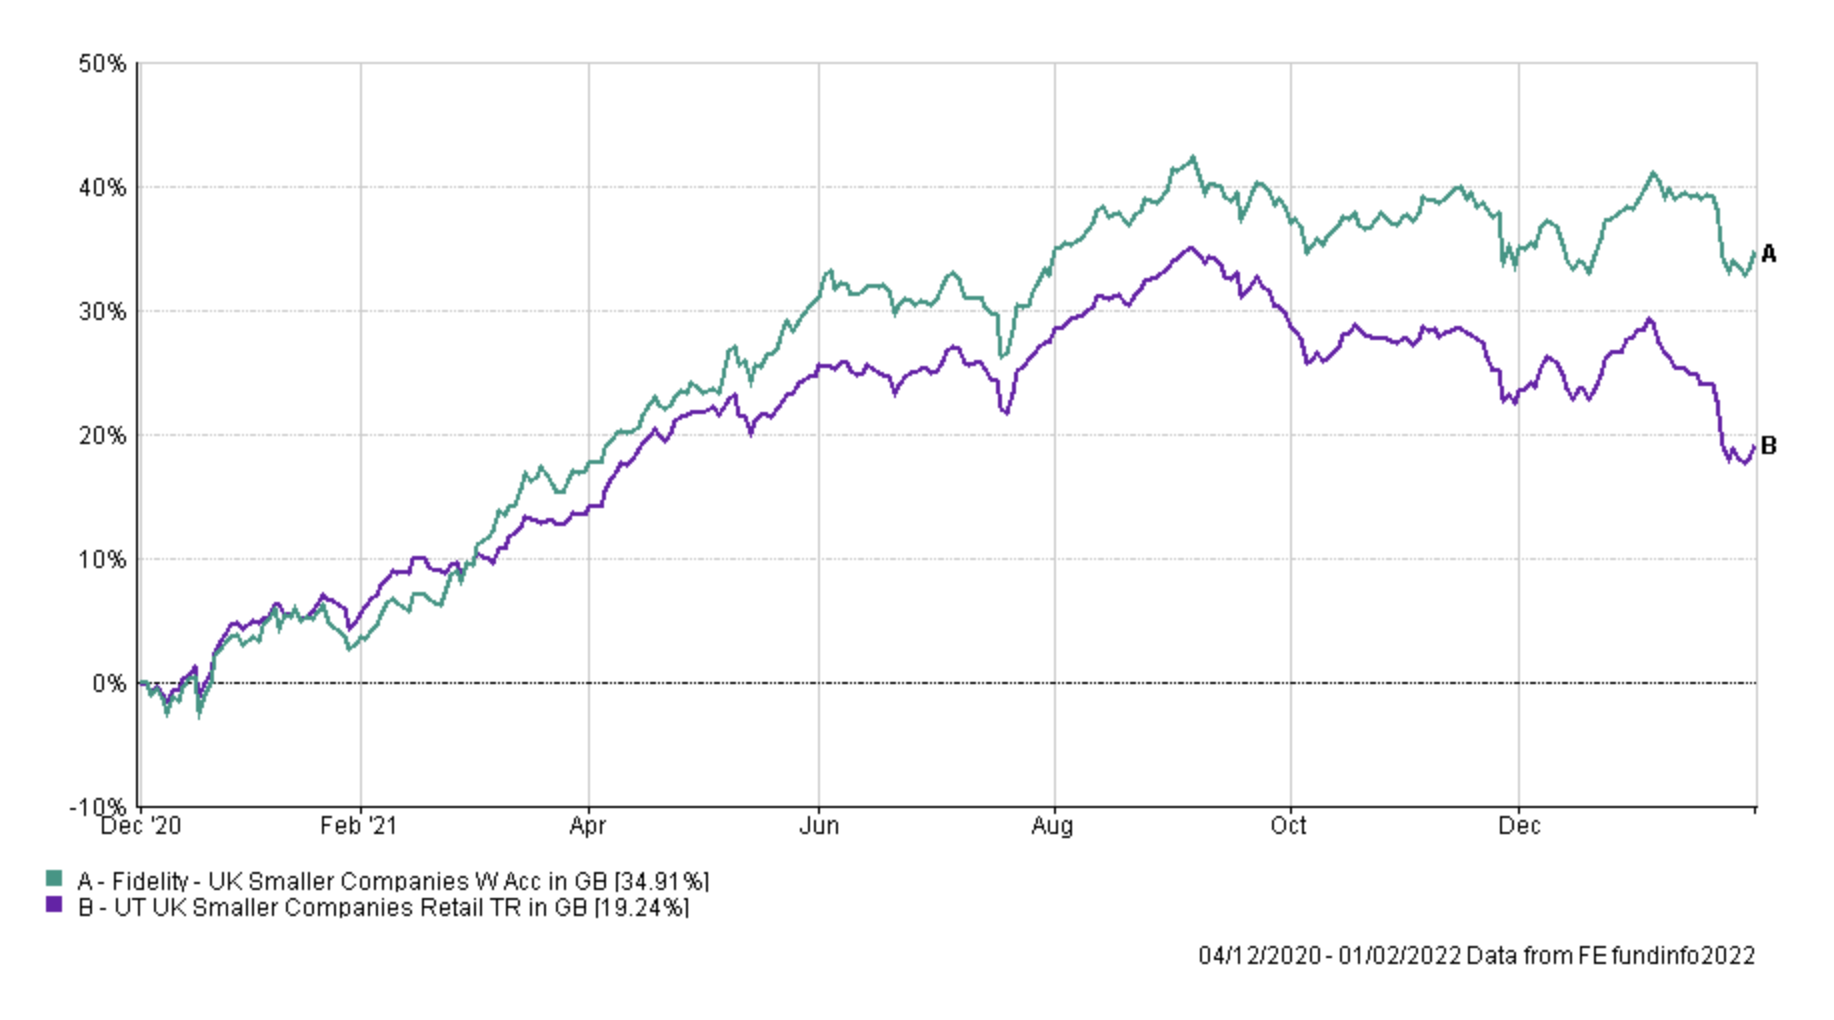
In my last review, I decided to maintain my exposure to Fidelity UK Smaller Companies despite it being on my watchlist as it has proved much more resilient than its peer group. Plus the fund was (and still is) in the BFBS tables, enjoying the historically strong winter period for the sector and the fund itself.
The chart below shows the incredibly strong performance of the fund since I've held it.
The chart below shows the performance of the fund over the last 6 months versus its peer group average.
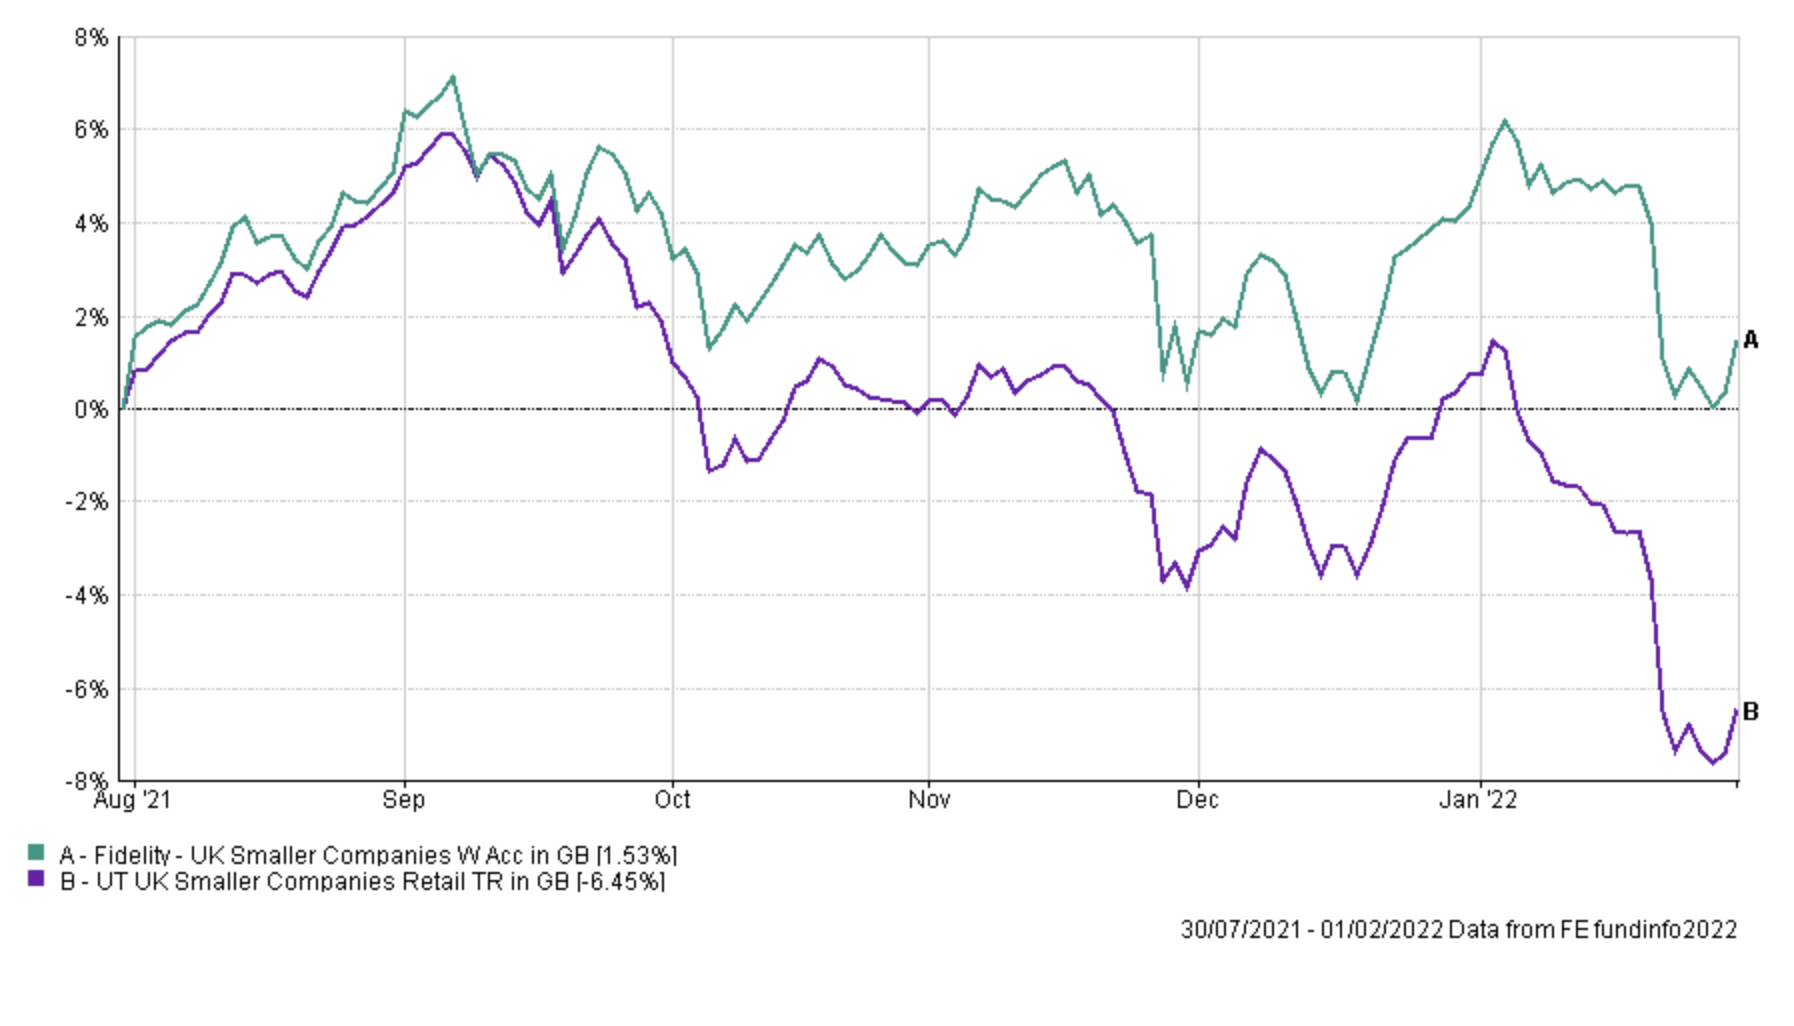
As you can see in the second chart, the sector as a whole has struggled since September and during the recent equity market volatility. In fact at the time of writing the Fidelity fund is now the only UK smaller companies fund that is in the BFBS table. Unless the fortunes improve for the sector as a whole then the Fidelity fund may well go the way of its peers and its momentum slow further. By contrast, the Invesco UK Opportunities fund (within my portfolio) has been a strong performer (as shown in the earlier table) so I plan to diversify my UK equity exposure by reducing my Fidelity UK Smaller Companies holding in favour of the Invesco UK Opportunities (UK).
Last month I said that I would keep the IFSL Marlborough European Special Situations (formerly named Marlborough European Multi-Cap) on my watch list as it had lost momentum and fallen out of the BOTB and BFBS tables. The same continues to be the case with the fund still performing in line with its peer group. Not a disaster but not exciting either.
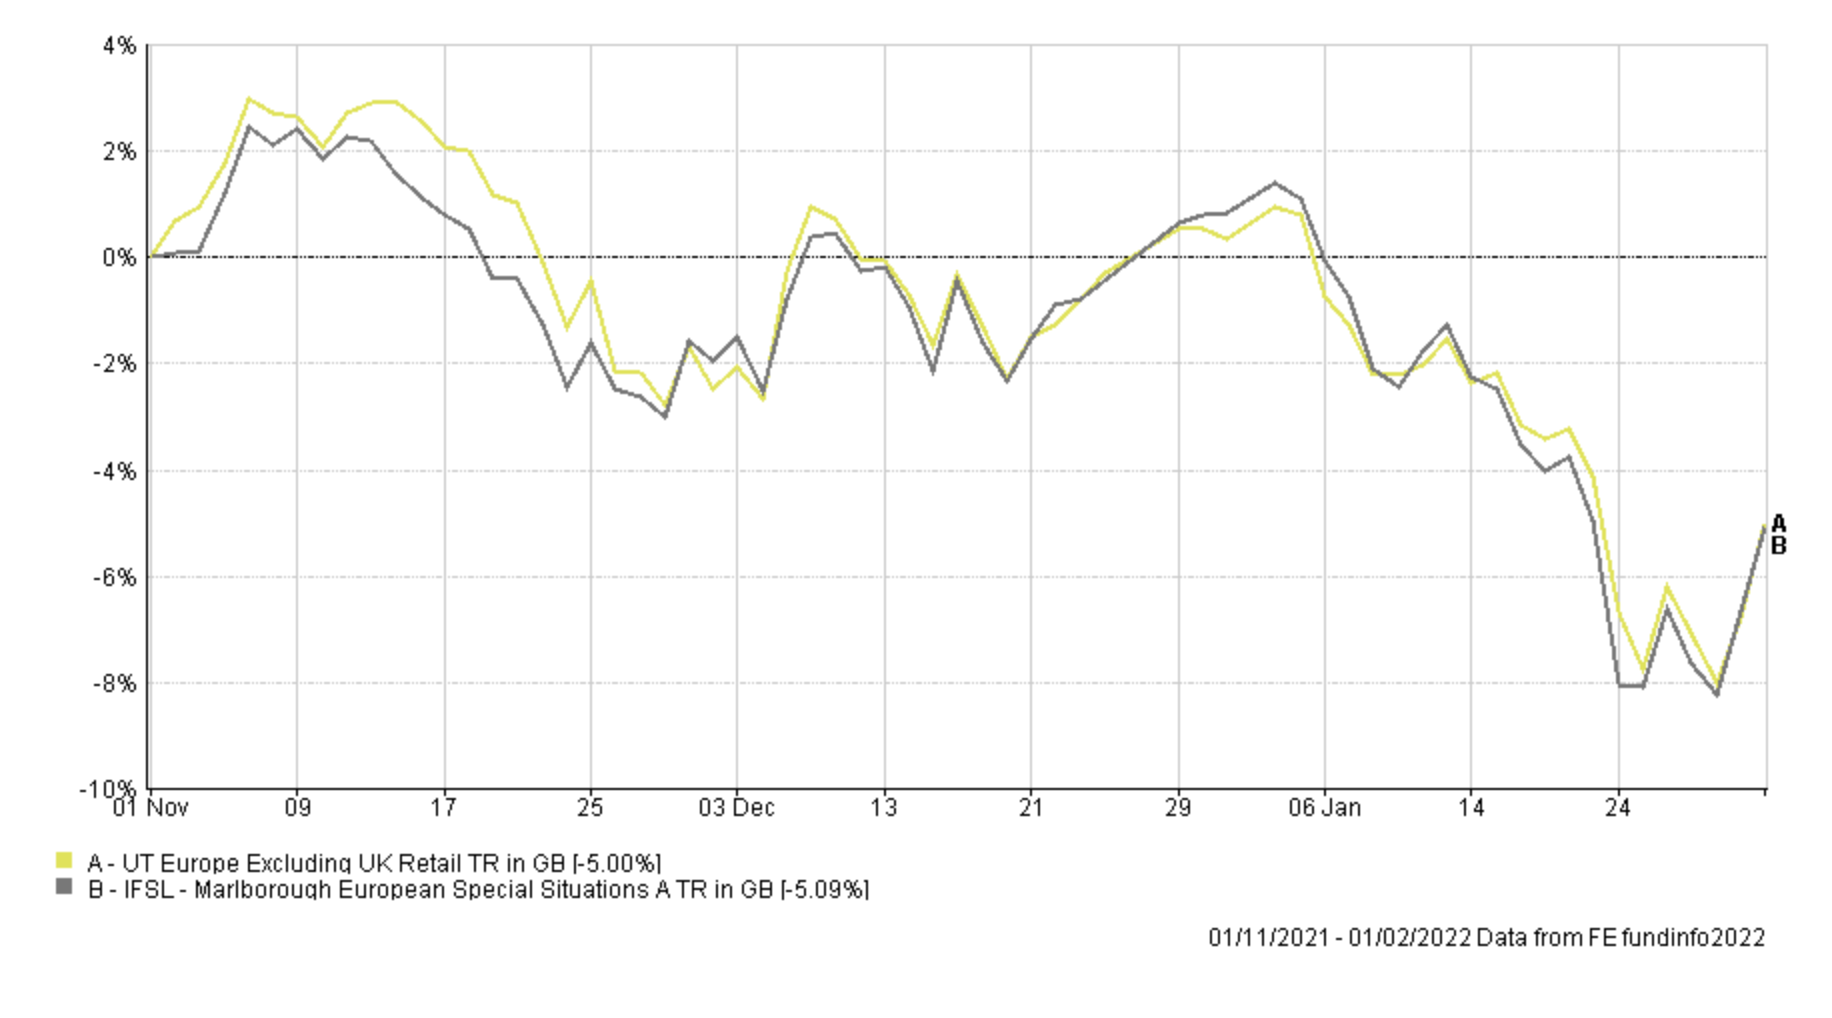
The fund is also still outside of the BFBS and BOTB so I am going to replace it with an alternative European equity fund from this month's BOTB.
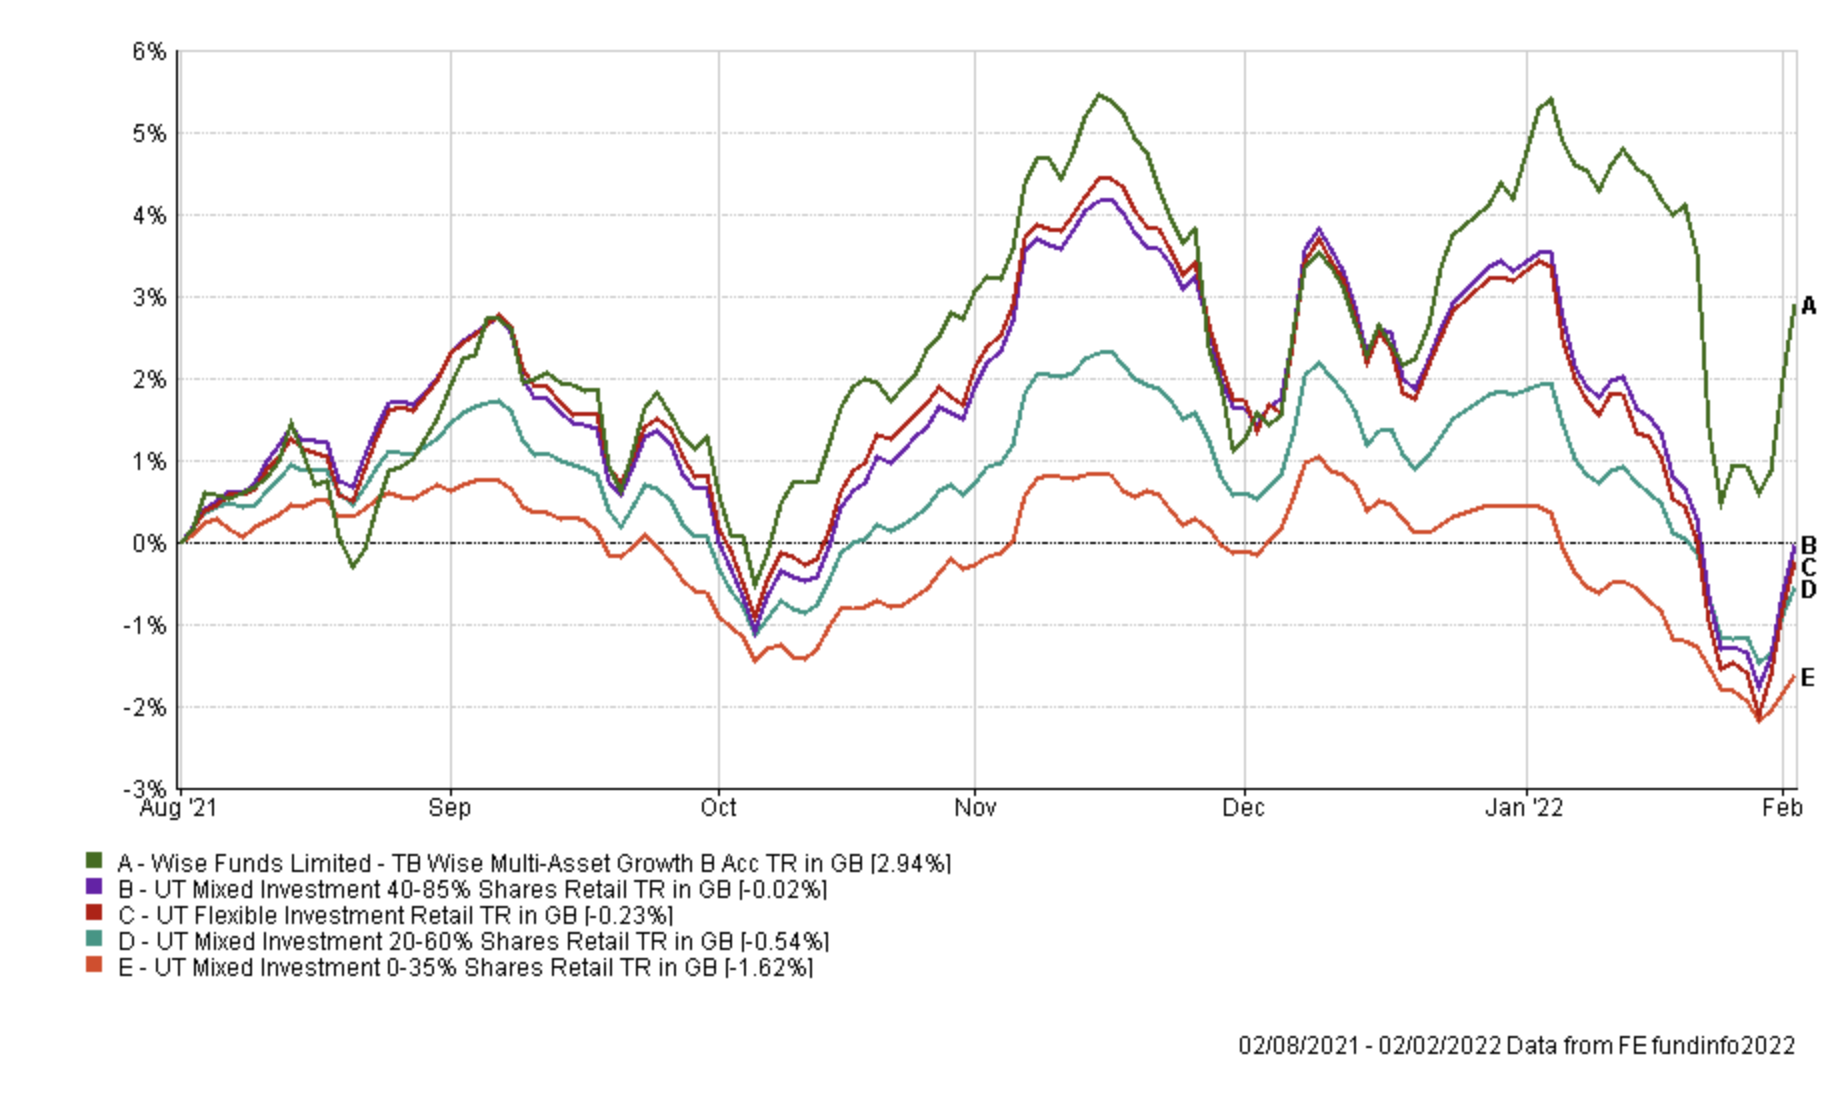
Turning my attention to the other funds that have fallen outside of the BOTB, Wise Multi-Asset Growth continues to outperform as bond yields have risen. The chart shows how it has performed in recent months compared to the typical multi-asset funds with varying equity exposure (this is an updated version of the chart I shared last month).
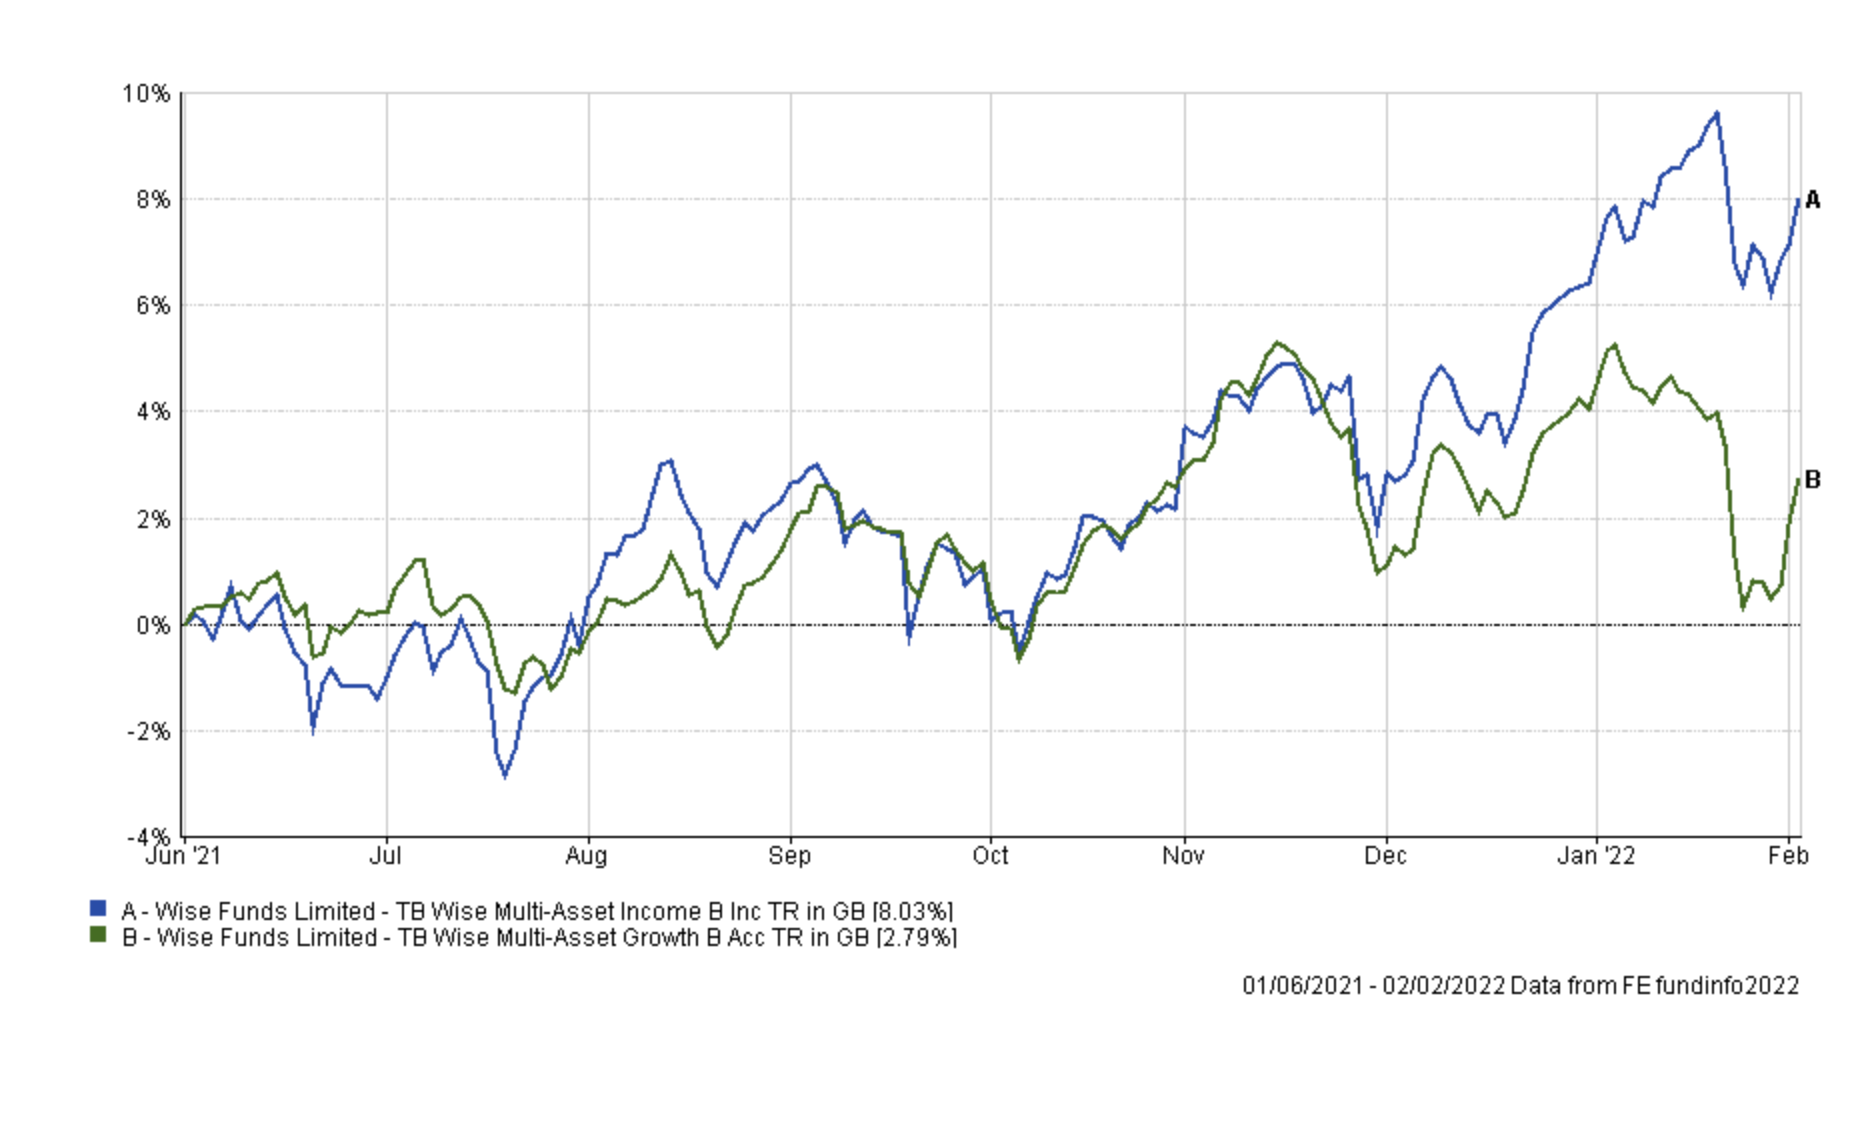
Interestingly the fund reappeared in the BFBS table towards the end of last month but has since slid back out. But its stablemate (TB Wise Multi-Asset Income) has performed very strongly in the last month or so and is now in the BOTB table. Interestingly both TB Wise Multi-Asset Growth and TB Wise Multi-Asset Income had performed in line with each other until December, as shown below.
Ordinarily, I would look to perhaps switch between the two funds, in an almost like-for-like swap but I am conscious that I am making a number of switches this month so instead will review the situation next time with a view to making a change.
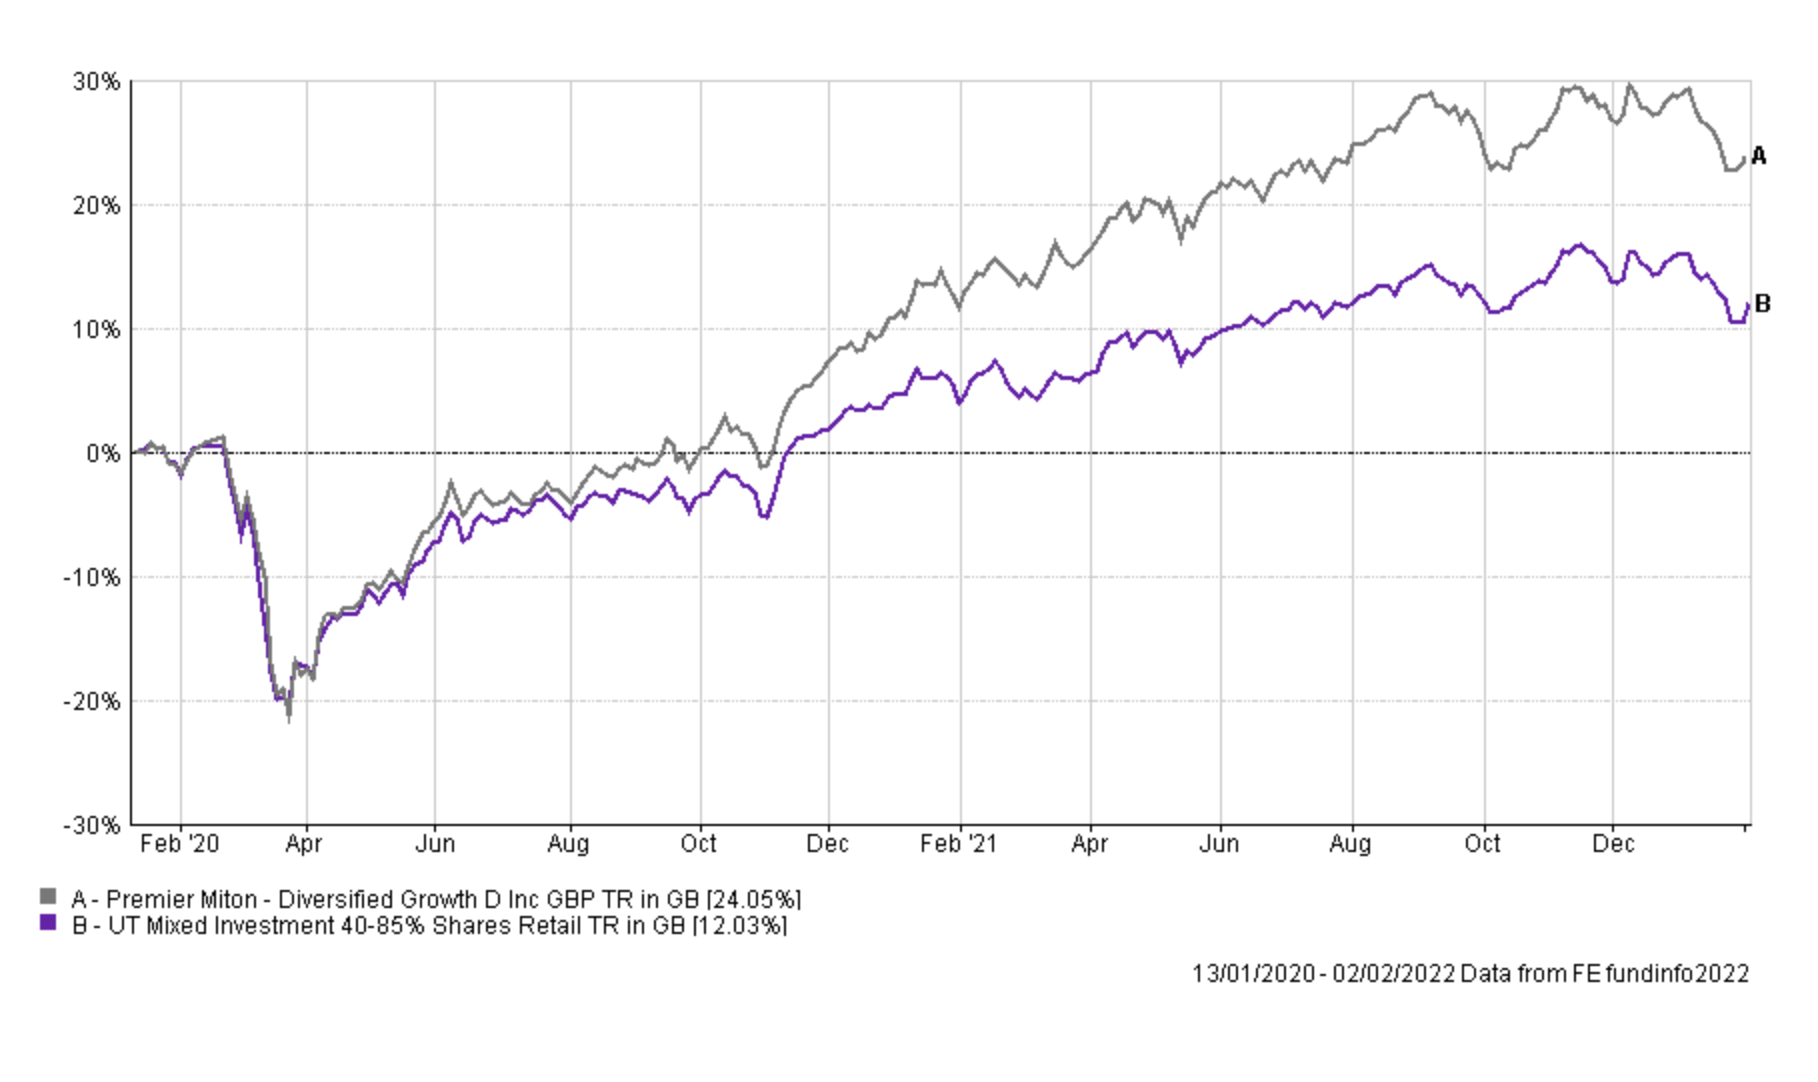
In recent months I have been slowly reducing my exposure to the Premier Diversified Growth fund as it tends to lag in a rising bond yield environment, and I will finally remove it from my portfolio this month as its recent momentum has been a bit lacklustre. Having said that, the performance of the fund since it has been in my portfolio has been outstanding as shown in the chart below, but there are now perhaps better opportunities elsewhere, especially as the threat from Covid seems to be diminishing. Having been in my portfolio for more than two years (and for the entire pandemic) it shows how good a performer it has been.
One fund that has performed well during the recent period of bond market weakness has been SVS BM Brooks Macdonald Defensive Capital. While it continues to perform well and diversify my portfolio it is my largest holding and I will look to reduce its allocation in my portfolio in favour of another targetted absolute return fund that interestingly has the ability to also short the market (to try and make money by betting that certain asset prices will fall) as well as bet that markets will rise.
The other funds within my portfolio are either still in the BOTB or BFBS tables. For now, I don't want to make any more changes as markets are still extremely volatile.
Fund switches
The fund switches below bring my portfolio more in line with the BOTB, certainly in terms of UK equity exposure. The fund switches are mostly like-for-like funds which are in February's BOTB. The fund switches I have made this time are:
- 100% out of IFSL Marlborough European Special Situations and 100% into Schroder European Recovery
- 100% out of Premier Miton Diversified Growth and 100% into Premier Miton Defensive Growth
- 100% out of SVS Sanlam North American Equity and 100% into Premier Miton Defensive Growth
- 33% out of Fidelity UK Smaller Companies and 100% into Invesco UK Opportunities (UK)
- 33% out of SVS BM Brooks Macdonald Defensive Capital and 100% into Thesis TM Tellworth UK Select
Overall it means that the equity exposure within my portfolio has fallen from 68% to around 63%, while the number of holdings has increased by one. The changes affect just under 30% of my portfolio.
My portfolio
My portfolio now looks like this:
| Name | Allocation % (rounded) | Risk | Sector | ISIN Code |
| BlackRock Natural Resources Growth & Income | 5.00 | High | Commodity/Natural Resource | GB00B6865B79 |
| Fidelity American Special Situations | 7.50 | Medium | North America | GB00B89ST706 |
| Fidelity Global Property | 5.00 | Medium | Property Other | GB00B7K2NZ09 |
| Fidelity UK Smaller Companies | 6.50 | High | UK Smaller Companies | GB00B7VNMB18 |
| Fidelity US Index | 11.00 | High | North America | GB00BJS8SH10 |
| Invesco High Yield (UK) | 8.00 | Low | Sterling High Yield | GB00B3RW7649 |
| Invesco UK Opportunities (UK) | 7.50 | Medium | UK All Companies | GB00B1W7HM62 |
| iShares Physical Gold ETC | 4.00 | Medium | Commodity & Energy ETF | IE00B4ND3602 |
| Premier Miton Defensive Growth | 12 | Low | Targeted Absolute Return | GB00B832BD89 |
| Schroder European Recovery | 10 | High | Europe Excluding UK | GB0007221889 |
| SVS BM Brooks Macdonald Defensive Capital | 10.00 | Low | Targeted Absolute Return | GB00B61MR835 |
| Thesis TM Tellworth UK Select | 5 | Low | Targeted Absolute Return | GB00BNY7YM73 |
| TB Wise Multi-Asset Growth | 8.50 | Medium | Flexible Investment | GB0034272533 |
My Portfolio asset mix
My portfolio asset mix is now as shown below which remains around 63% exposure to equities. Last month's figures are shown in brackets
-
- UK Equities 18% (13%)
- North American Equities 18% (27%)
- Asian/Emerging Market Equities 0% (2%)
- Japanese Equities 0% (0%)
- European Equities 9% (9%)
- Chinese equities 0% (0%)
- Other equity 6% (5%)
- Commodities and energy 12% (11%)
- UK Fixed Interest 0% (0%)
- Global Fixed Interest 9% (10%)
- Cash 0% (5%)
- Alternative Investment Strategies 23% (12%)
- Property 5% (6%)
Damien's higher risk and lower risk portfolios
Using the logic described in my post: Update to Damien’s alternative risk portfolios I created hypothetical higher and lower risk versions of my portfolio below:
Lower risk
| Fund | Allocation % |
| Fidelity American Special Situations | 11 |
| Fidelity Global Property | 7 |
| Invesco High Yield (UK) | 12 |
| Invesco UK Opportunities (UK) | 11 |
| iShares Physical Gold ETC | 6 |
| Premier Miton Defensive Growth | 18 |
| SVS BM Brooks Macdonald Defensive Capital | 15 |
| Thesis TM Tellworth UK Select | 7 |
| TB Wise Multi-Asset Growth | 13 |
Higher risk
| Fund | Allocation % |
| BlackRock Natural Resources Growth & Income | 8 |
| Fidelity American Special Situations | 12 |
| Fidelity Global Property | 7 |
| Fidelity UK Smaller Companies | 10 |
| Fidelity US Index | 17 |
| Invesco UK Opportunities (UK) | 12 |
| iShares Physical Gold ETC | 6 |
| Schroder European Recovery | 15 |
| TB Wise Multi-Asset Growth | 13 |

£200 Pension Cashback Offer
Make a qualifying deposit or transfer a pension to our partner Interactive Investor.
- Deposit or transfer a pension of at least £20k and you could earn £200 cashback
- Terms and Fees apply, Capital at risk
- New & Existing customers opening a SIPP
- Offer ends 31st July 2026
Before starting your transfer, check you won't lose any valuable benefits (such as guaranteed annuity rates or a lower protected pension age) and find out what exit fees you might have to pay
