

The background to my portfolio
Back in March 2015 I decided to invest £50,000 of my own money using 80-20 Investor. The purpose was twofold, firstly to show how you can use 80-20 Investor to invest and outperform the market with only a few minutes effort every now and then. Secondly, no other investment commentator, journalist or research provider invests their own money for fear of failing. This is a sorry state of affairs and is precisely why I committed to openly running my own portfolio for 80-20 Investor members to see.
Since then I have periodically changed my portfolio using the fund suggestions provided by the 80-20 Investor algorithm and associated research. I always disclose the changes at the time they are made.
Performance update
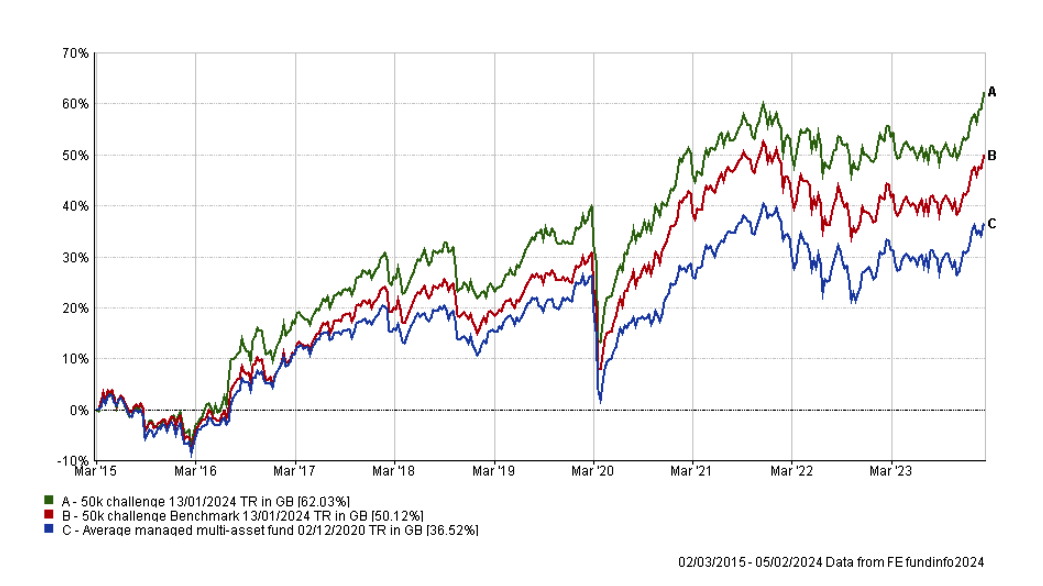
As is usual in my portfolio reviews, the chart below shows how my portfolio has outperformed since I started the challenge in March 2015. The green line is the performance of my portfolio while the red line is the benchmark showing the average return achieved by professional fund managers given the same asset mix. To accurately calculate this I have used the average return for each sector in which my portfolio invested. The blue line shows what the average multi-asset fund with comparable equity content achieved. In other words, the red line would show the extra performance added by just the asset mix of my portfolio (where I was invested i.e European equities etc) over picking a typical multi-asset fund (the blue line). While the green line (which is my actual performance) shows the impact of being in the right funds at the right time, as identified by the 80-20 Investor algorithm.
The chart below shows the performance of my portfolio since my last review just under a month ago and you can see that a combination of being in the right assets (asset allocation) and the right funds powered my portfolio to an incredible return of 2.81% in little over 3 weeks.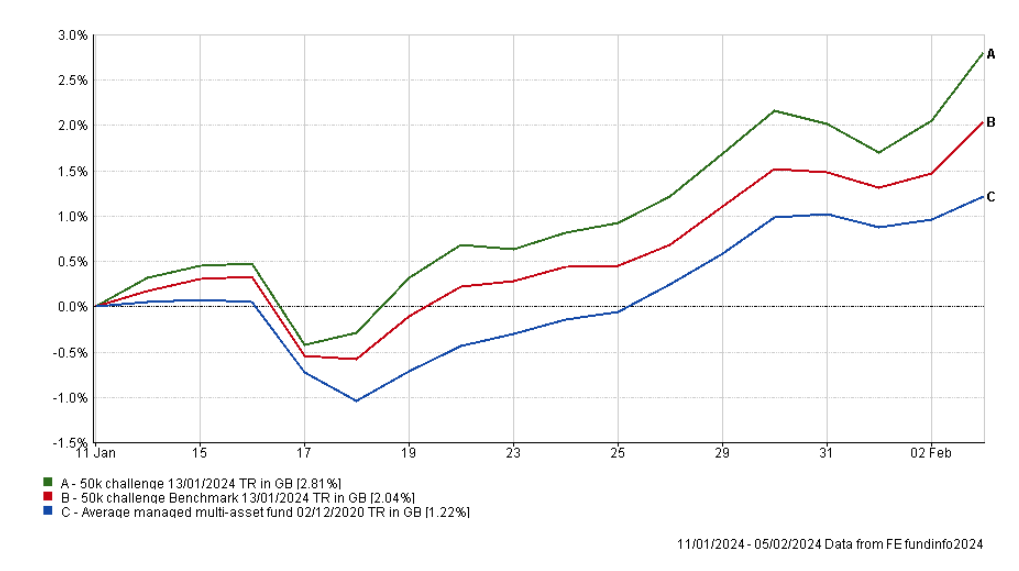
It means that my portfolio now sits at an all-time high, as shown in the first chart. My £50,000 portfolio is now worth over £81,000 which equates to a profit of 62.03% in just under 9 years, which is a great result. But it's not just the profit that is important, so is the management of risk over that time to achieve that profit.
If my portfolio was a fund residing in the Mixed Investment 40-85% Shares sector of 262 funds (of which 135 have been in existence since my portfolio started) it would rank in the top quartile for all of the key investing statistics, namely:
Alpha
Alpha is a figure which measures a manager’s apparent skill at picking winning investments versus their benchmark. Alpha is the excess return versus the return of a fund’s benchmark (i.e the market). So a fund/portfolio with a positive alpha indicates that the fund manager has outperformed through skill. While a negative alpha figure would indicate underperformance. The higher the alpha figure the better.
Maximum Drawdown
This is the biggest fall experienced in a given week. My portfolio is among those funds with the lowest drawdowns. If you recall my portfolio outperformed throughout 2022 by protecting its value when bond and equity markets were tumbling.
Sharpe Ratio
The Sharpe Ratio is a measure of the excess return a manager is achieving for the risk they are taking. The higher the Sharpe Ratio the better. My portfolio has one of the highest Sharpe ratios.
Sortino Ratio
This is very similar to the Sharpe Ratio but places more emphasis on the manager's ability to manage on the downside. Again my portfolio ranks in the top quartile of the sector for this statistic.
Volatility
This is a measure of a fund's dispersion of returns, or in plain English the variability in those returns. Think of it as a measure of how much a building is prone to wobble. The more prone it is (the higher the volatility) the more it will sway in an earthquake. Not only is my portfolio in the top quartile for this statistic but only 18 funds out of 135 in the sector have a lower level of volatility than my portfolio.
The takeaway is that while I am proud of how the portfolio has performed, I have achieved this by managing risk and squeezing more return from the risk that I have taken than most professional fund managers.
Bringing things back to the short term, the table below shows the performance of the individual funds within my portfolio since my last review just under a month ago. As you can see there has been a huge turnaround from the likes of L&G Global 100 Index, Fidelity American and Troy Asset Management Ltd Trojan Global Equity. BNY Mellon Multi-Asset Balanced has also performed strongly.
| Name | % return over the last month (since January's review) |
| T. Rowe Price US Large Cap Growth Equity | 7.74 |
| Fidelity American | 6.2 |
| L&G Global 100 Index Trust | 5.62 |
| Troy Asset Management Ltd Trojan Global Equity | 5.03 |
| Liontrust India | 4.16 |
| Fidelity Index Japan | 2.55 |
| BNY Mellon Multi-Asset Balanced | 2.13 |
| Thesis TM Tellworth UK Select | 1.28 |
| Schroder Strategic Credit | 0.81 |
| iShares Physical Gold ETC | 0.67 |
| abrdn High Yield Bond | 0.59 |
| WS Saracen Global Income and Growth | 0.28 |
| Fidelity UK Smaller Companies | -0.71 |
As usual the table below shows which funds within my portfolio are in the current BOTB or BFBS tables and which are not. Those funds in blue are still in the BOTB while those in orange are not in the BOTB but remain in the BFBS list. Meanwhile, any funds in red have dropped out of both shortlists.
| Fund | Allocation | Risk | Sector | ISIN |
| abrdn High Yield Bond | 14.5 | Lower | Sterling High Yield |
GB00B79RR984
|
| BNY Mellon Multi-Asset Balanced | 8.5 | Medium | Mixed Investment 40-85% Shares | GB00B8K9JZ06 |
| Fidelity American | 5 | Medium | North America |
GB00B8GPC429
|
| Fidelity Index Japan | 5.5 | Medium | Japan |
GB00BHZK8872
|
| Fidelity UK Smaller Companies | 5 | Higher | UK Smaller Companies |
GB00B7VNMB18
|
| iShares Physical Gold ETC | 5 | Medium | Commodity & Energy ETF | IE00B4ND3602 |
| T. Rowe Price US Large Cap Growth Equity | 10.5 | Higher | North America |
GB00BD5FHW12
|
| L&G Global 100 Index Trust | 5 | Medium | Global |
GB00B0CNH056
|
| Liontrust India | 5.5 | Higher | India/Indian Subcontinent |
GB00B1L6DV51
|
| Schroder Strategic Credit | 8.5 | Lower | Sterling Strategic Bond | GB00BJZ2ZC09 |
| Thesis TM Tellworth UK Select | 6 | Lower | Targeted Absolute Return |
GB00BNY7YM73
|
| Troy Asset Management Ltd Trojan Global Equity | 11 | Medium | Global | GB00B0ZJ5S47 |
| WS Saracen Global Income & Growth | 10 | Medium | Global Equity Income | GB00B5B35X02 |
This month five funds have fallen outside out the BOTB and BFBS tables and are coloured in red. These are:
- BNY Mellon Multi-Asset Balanced
- Fidelity American
- L&G Global 100 Index Trust
- WS Saracen Global Income & Growth
- Fidelity UK Smaller Companies
The first thing to point out is that the first three were on the 'red' shortlist last month, having fallen out of the BOTB and the BFBS tables. Last time, I explained that the 80-20 Investor algorithm and process allows for funds to be held for up to six months at a time, and all three funds had been within the BFBS or BOTB as recently as October/November. So there really wasn't any need to panic, especially when they were starting to rally once again.
Perhaps it is no coincidence that both Troy Trojan Global Equity and Schroder Strategic Credit, which were on the 'red' list last month, have both since returned to the BOTB and BFBS tables respectively.
It also proved a prudent decision to maintain exposure to BNY Mellon Multi-Asset Balanced, Fidelity American and L&G Global 100 Index Trust given that they are now among my top performing funds since my last review (as shown in the earlier table), rallying more than 5% in a matter of weeks. Last time, I did reduce my exposure to both Fidelity American and L&G Global 100 Index Trust in favour of T. Rowe Price US Large Cap Growth Equity and Fidelity UK Smaller Companies and while T. Rowe Price US Large Cap Growth Equity has continued to explode higher, the Fidelity fund's performance has been disappointing since it entered my portfolio. However, it is early days and I will review its inclusion next time. My decision last month to phase any changes to my portfolio, rather than making wholesale switches, because of early signs of a shift in market trends, was the correct one in hindsight. It serves as a useful reminder that often pruning is better than ripping things out and starting again.
Given that BNY Mellon Multi-Asset Balanced, Fidelity American and L&G Global 100 Index Trust have all been among the best performers in their respective sectors over the last month, and are very likely to re-enter the BFBS tables if things continue, I will maintain them in my portfolio this month. It is rare that at any given moment almost every fund within my portfolio is among the top performers of their respective sectors' over the short-term, but that is the enviable position they find themselves in now.
The exceptions are Fidelity UK Smaller Companies (which I've discussed already) and WS Saracen Global Income & Growth. The latter had been a decent performer until recently and was still in the BFBS tables last month. So I am going to maintain the fund for now and review the situation next time.
Interestingly, market momentum has been narrowing, with some clear winners and losers as discussed in my recent newsletters, and it has been converging on the assets and funds held within my portfolio. This has resulted in the strong rally in its value since the start of 2024. Even the BOTB's asset mix has moved back towards that of my portfolio, with the only notable difference being my slightly higher exposure to European equities. It also explains why my portfolio has outperformed other professionally run multi-asset funds by such a margin of late.
With big US tech stocks, Indian equities and Japanese equities being the main drivers behind the rally, should this change and the rug be pulled from beneath the market (which is increasingly likely) then my portfolio will likely take a hit too. Momentum investing's rewards come with such associated risks.
That is why it is always good to reflect on times like this and mark your successes, because investment markets always have a habit of humbling you. When they do and your portfolio performance lags for a period of time, it's important to be able to look back to points like now as evidence of the benefits of following and trusting the process, even through the tough periods. Over the almost 9 years of running this portfolio we've seen pretty much everything the market can throw at us and come out the other side.
Fund switches
Unsurprisingly I am not making any changes to my portfolio this month given the portfolio's momentum.
My portfolio
My portfolio remains the same and looks like this:
| Fund | Allocation | Risk | Sector | ISIN |
| abrdn High Yield Bond | 14.5 | Lower | Sterling High Yield |
GB00B79RR984
|
| BNY Mellon Multi-Asset Balanced | 8.5 | Medium | Mixed Investment 40-85% Shares | GB00B8K9JZ06 |
| Fidelity American | 5 | Medium | North America |
GB00B8GPC429
|
| Fidelity Index Japan | 5.5 | Medium | Japan |
GB00BHZK8872
|
| Fidelity UK Smaller Companies | 5 | Higher | UK Smaller Companies |
GB00B7VNMB18
|
| iShares Physical Gold ETC | 5 | Medium | Commodity & Energy ETF | IE00B4ND3602 |
| T. Rowe Price US Large Cap Growth Equity | 10.5 | Higher | North America |
GB00BD5FHW12
|
| L&G Global 100 Index Trust | 5 | Medium | Global |
GB00B0CNH056
|
| Liontrust India | 5.5 | Higher | India/Indian Subcontinent |
GB00B1L6DV51
|
| Schroder Strategic Credit | 8.5 | Lower | Sterling Strategic Bond | GB00BJZ2ZC09 |
| Thesis TM Tellworth UK Select | 6 | Lower | Targeted Absolute Return |
GB00BNY7YM73
|
| Troy Asset Management Ltd Trojan Global Equity | 11 | Medium | Global | GB00B0ZJ5S47 |
| WS Saracen Global Income & Growth* | 10 | Medium | Global Equity Income | GB00B5B35X02 |
My Portfolio asset mix
My portfolio asset mix has approximately 62% exposure to equities. Last month's figures are shown in brackets.
-
- UK Equities 8% (8%)
- North American Equities 25% (25%)
- Asian/Emerging Market Equities 6% (6%)
- Japanese Equities 6% (6%)
- European Equities 7% (7%)
- Chinese equities 0% (0%)
- Other equity 10% (10%)
- Commodities and energy 5% (5%)
- UK Fixed Interest 4% (4%)
- Global Fixed Interest 20% (20%)
- Cash 0% (0%)
- Alternative Investment Strategies 9% (9%)
- Property 0% (0%)
Damien's higher risk and lower risk portfolios
Using the logic described in my post: Update to Damien’s alternative risk portfolios I created hypothetical higher and lower risk versions of my portfolio below:
Lower risk
| Fund | Allocation % |
| abrdn High Yield Bond | 18 |
| BNY Mellon Multi-Asset Balanced | 11 |
| Fidelity American | 6 |
| Fidelity Index Japan | 7 |
| iShares Physical Gold ETC | 6 |
| L&G Global 100 Index Trust | 6 |
| Schroder Strategic Credit | 11 |
| Thesis TM Tellworth UK Select | 8 |
| Troy Asset Management Ltd Trojan Global Equity | 14 |
| WS Saracen Global Income & Growth | 13 |
Higher risk
| Fund | Allocation % |
| BNY Mellon Multi-Asset Balanced | 12 |
| Fidelity American | 7 |
| Fidelity Index Japan | 8 |
| Fidelity UK Smaller Companies | 7 |
| iShares Physical Gold ETC | 7 |
| T. Rowe Price US Large Cap Growth Equity | 15 |
| L&G Global 100 Index Trust | 7 |
| Liontrust India | 8 |
| Troy Asset Management Ltd Trojan Global Equity | 15 |
| WS Saracen Global Income & Growth | 14 |

£200 Pension Cashback Offer
Make a qualifying deposit or transfer a pension to our partner Interactive Investor.
- Deposit or transfer a pension of at least £20k and you could earn £200 cashback
- Terms and Fees apply, Capital at risk
- New & Existing customers opening a SIPP
- Offer ends 31st July 2026
Before starting your transfer, check you won't lose any valuable benefits (such as guaranteed annuity rates or a lower protected pension age) and find out what exit fees you might have to pay
