

The background to my portfolio
Back in March 2015 I decided to invest £50,000 of my own money using 80-20 Investor. The purpose was twofold, firstly to show how you can use 80-20 Investor to invest and outperform the market with only a few minutes effort every now and then. Secondly, no other investment commentator, journalist or research provider invests their own money for fear of failing. This is a sorry state of affairs and is precisely why I committed to openly running my own portfolio for 80-20 Investor members to see.
Since then I have periodically changed my portfolio using the fund suggestions provided by the 80-20 Investor algorithm and associated research. I always disclose the changes at the time they are made.
Performance update
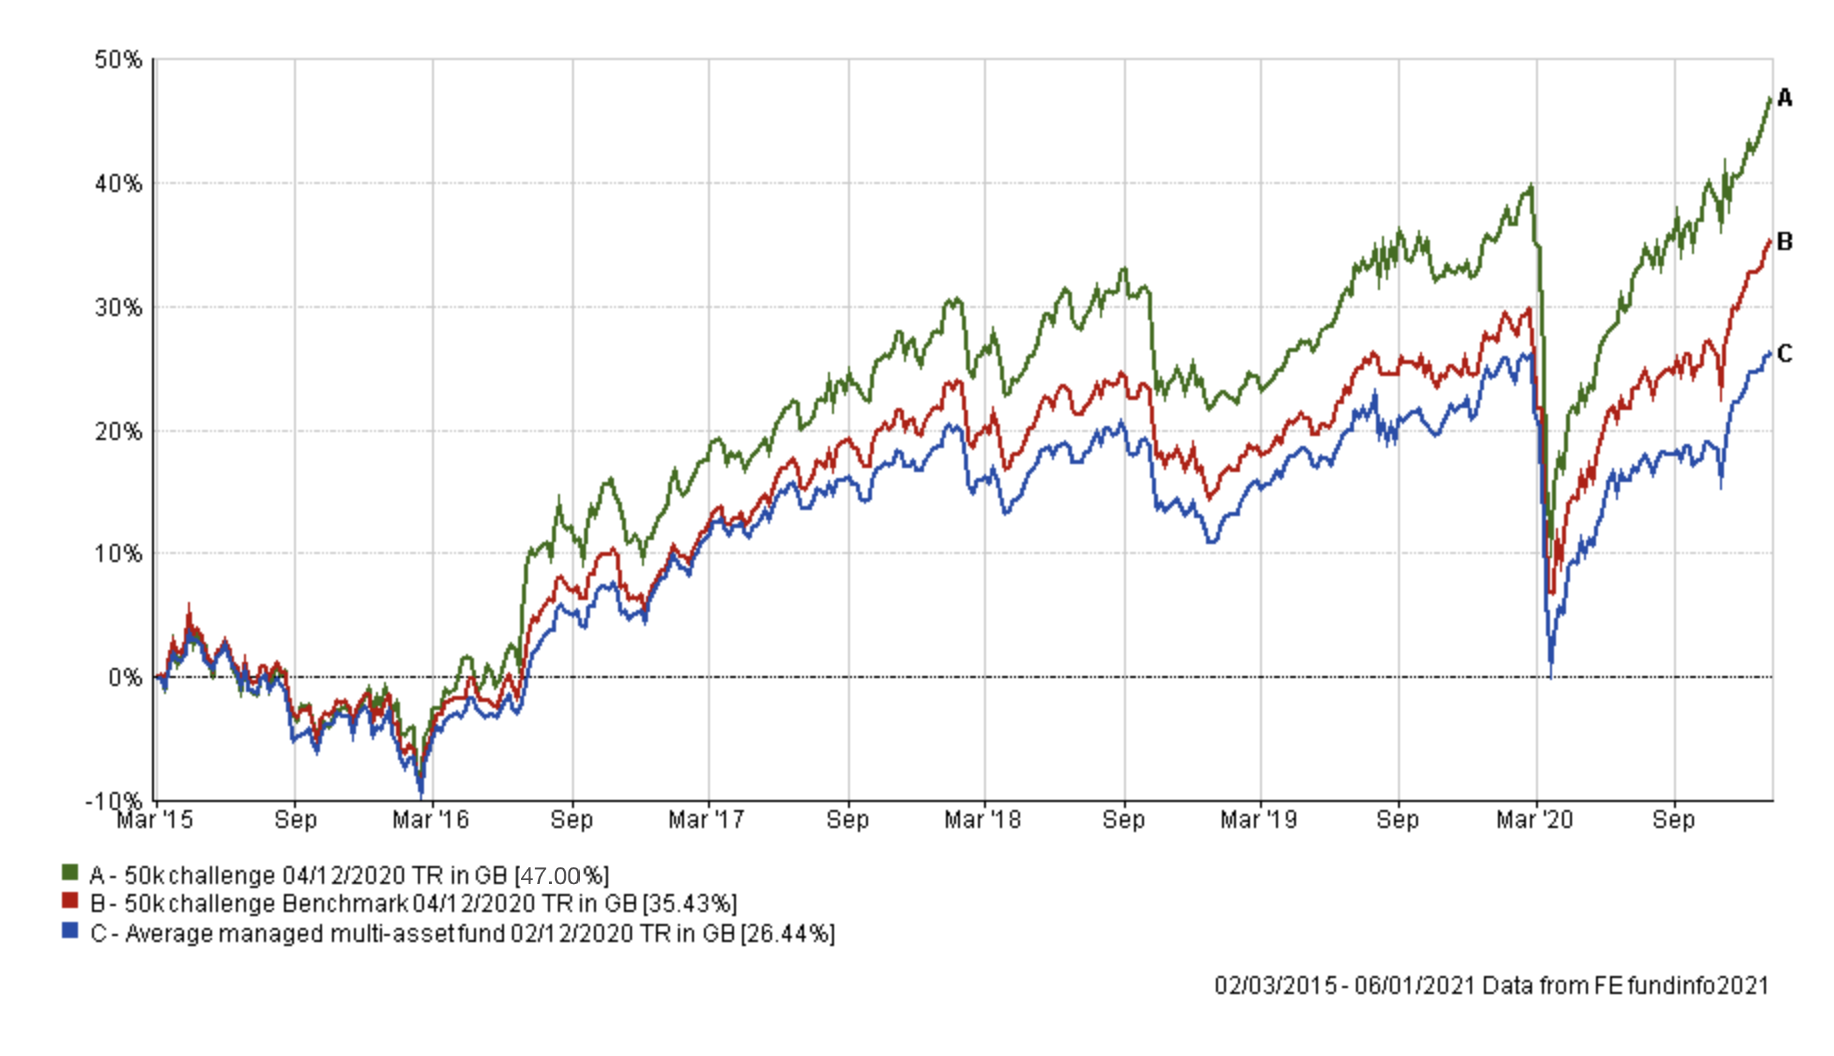
As is usual in my portfolio reviews, the chart below shows how my portfolio has outperformed since I started the challenge in March 2015, which is nearly six years ago. The green line is the performance of my portfolio while the red line is the benchmark showing the average return achieved by professional fund managers given the same asset mix. To accurately calculate this I have used the average return for each sector in which my portfolio invested. The blue line shows what the average multi-asset fund with comparable equity content achieved. In other words, the red line would show the extra performance added by just the asset mix of my portfolio (where I was invested i.e European equities etc) over picking a typical multi-asset fund (the blue line). While the green line (which is my actual performance) shows the impact of being in the right funds at the right time, as identified by the 80-20 Investor algorithm.
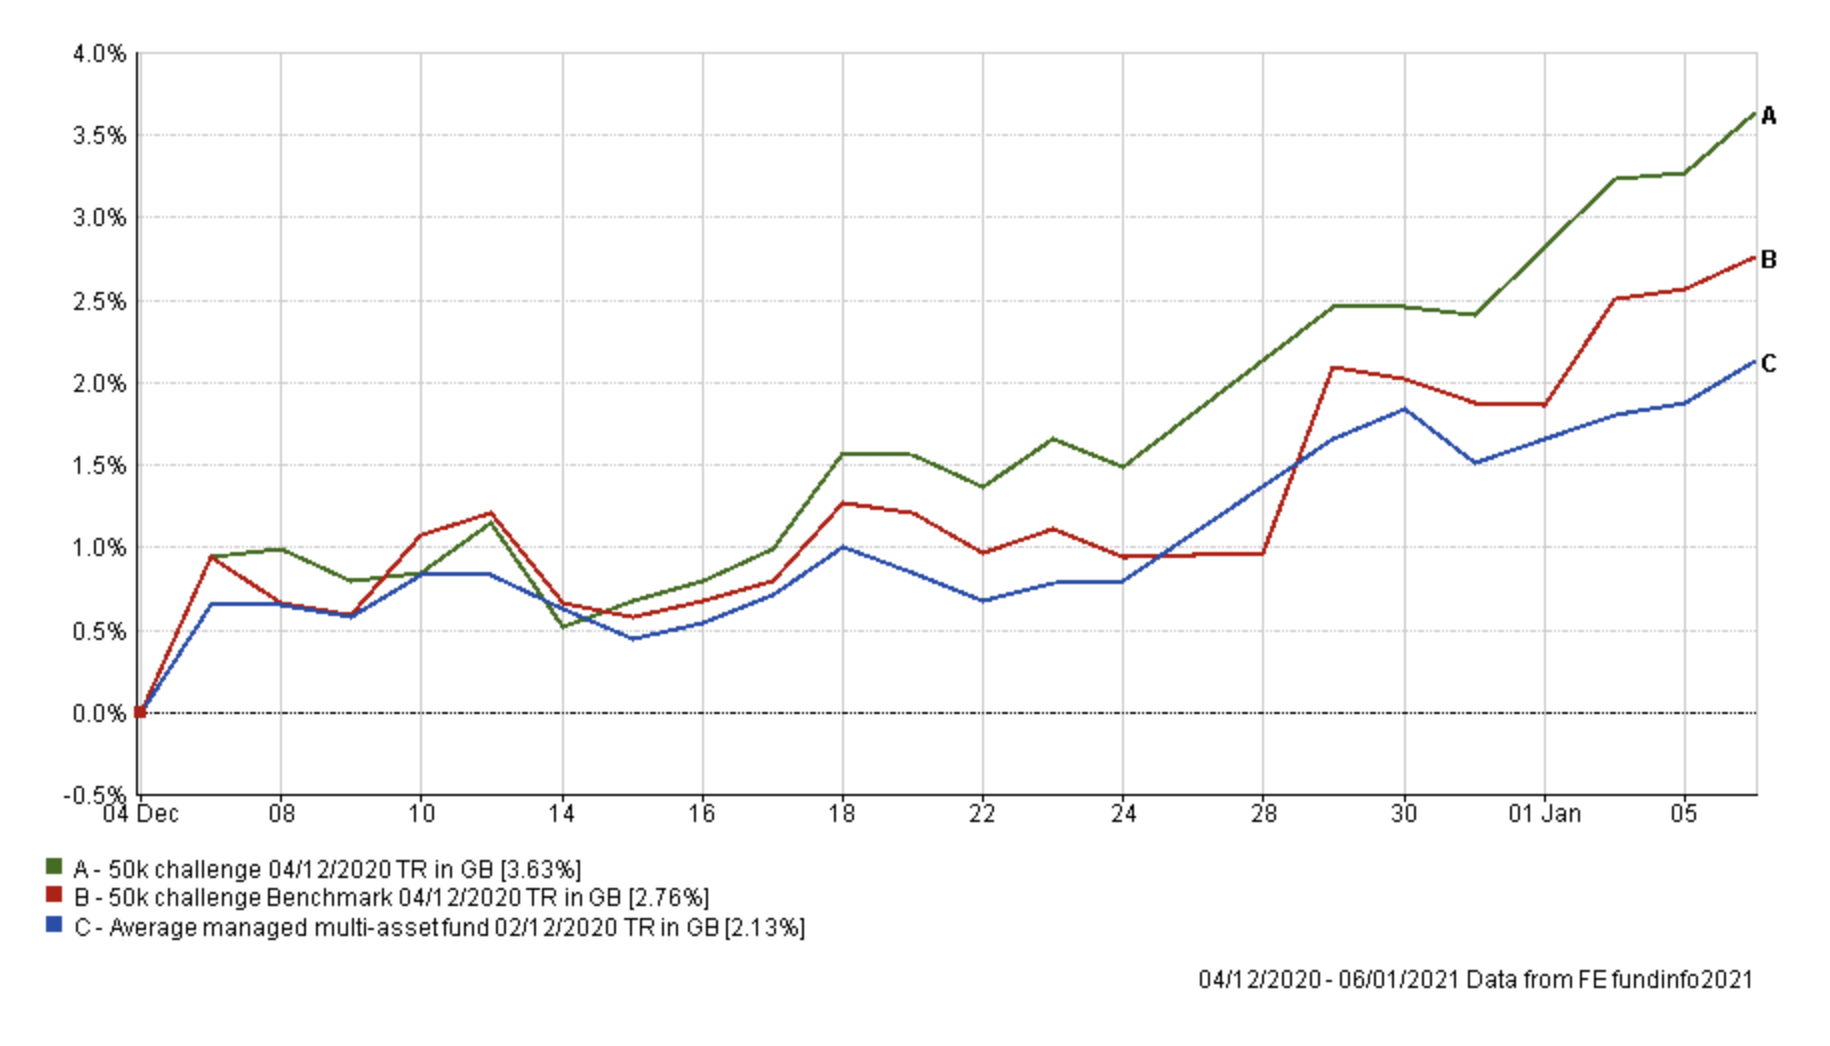
The chart below shows how my portfolio has outperformed its benchmarks since my last portfolio review, at the start of December.
The table below shows the performance of the individual funds within my portfolio over the same time period.
| Fund | % return since 4th Dec |
| VT Gravis Clean Energy Income | 7.67 |
| Invesco Global Emerging Markets (UK) | 6.35 |
| Baillie Gifford European | 5.36 |
| Baillie Gifford Long Term Global Growth Investment | 5.28 |
| Fidelity UK Smaller Companies | 4.60 |
| Allianz Total Return Asian Equity | 4.25 |
| iShares Physical Gold ETC | 4.21 |
| Baillie Gifford Positive Change | 4.18 |
| Premier Miton Diversified Growth | 2.62 |
| Sarasin Global Dividend | 2.50 |
| JPM Japan | 1.77 |
| T. Rowe Price Global Focused Growth Equity | 1.57 |
| ASI Strategic Bond | 1.14 |
| Fidelity Global High Yield | 1.03 |
It is good to see that two of the new funds which I invested in last month, namely Invesco Global Emerging Markets (UK) and Fidelity UK Smaller Companies, performed so well especially as they now make up around 18% of my portfolio.
Last time I lamented the fact that the historic market rotation in November, a result of the announcement of a number of COVID vaccines, meant that my portfolio lagged its benchmarks during that month as 2020's investment winners and laggards had a reversal in fortunes. Nonetheless, at the time I wrote that my portfolio was still sitting at an all-time profit high despite the impact of the market rotation. In addition, I explained that I would stick with the 80-20 Investor investment process that has fared so well over the longer term. As the charts above show, that faith was once again rewarded and the value of my portfolio continues to push to new all-time highs. Let's hope that the trend continues.
As is the routine in my portfolio reviews, the table below shows which funds within my portfolio are in the current BOTB or BFBS tables and which are not. Those funds in green are still in the BOTB while those in orange are not in the BOTB but remain in the BFBS list. Meanwhile, any funds in red have dropped out of both shortlists.
| Name | Allocation % (rounded) | Risk | Sector | ISIN Code |
| Allianz Total Return Asian Equity | 3 | Medium | Asia Pacific Excluding Japan |
GB00B1FRQV53
|
| ASI Strategic Bond | 16 | Low | Sterling Strategic Bond |
GB00BWK27X12
|
| Baillie Gifford European | 3.5 | Medium | Europe Excluding UK | GB0006058258 |
| Baillie Gifford Long Term Global Growth Investment | 5 | High | Global |
GB00BD5Z0Z54
|
| Baillie Gifford Positive Change | 3 | High | Global |
GB00BYVGKV59
|
| Fidelity Global High Yield | 8 | Medium | Sterling High Yield |
GB00B7K7SQ18
|
| Fidelity UK Smaller Companies | 7.5 | High | UK Smaller Companies |
GB00B7VNMB18
|
| Invesco Global Emerging Markets (UK) | 10 | High | Global Emerging Markets |
GB00B3RW7S64
|
| iShares Physical Gold ETC | 5 | Medium | Commodity & Energy ETF | IE00B4ND3602 |
| JPM Japan | 2.5 | Medium | Japan |
GB00B1XMTP77
|
| Premier Diversified Growth | 9.5 | Medium | Mixed Investment 40-85% Shares | GB00B8BJV423 |
| Sarasin Global Dividend | 8.5 | Medium | Global Equity Income |
GB00BGDF8F44
|
| T. Rowe Price Global Focused Growth Equity | 7.5 | Medium | Global | GB00BD446774 |
| VT Gravis Clean Energy Income | 11 | Medium | Global |
GB00BFN4H792
|
As you can see, every fund within my portfolio now resides in the BOTB and/or BFBS tables. I can't recall the last time that happened. As such, there is no pressing need to change anything within the portfolio. Last time I held faith with Premier Diversified Growth, due to its strong performance during a volatile period for markets. It is perhaps unsurprising that the fund has since reentered the BOTB after a long absence. The same can be said for VT Gravis Clean Energy Income which is enjoying a boost from the surge in green investment policies by governments around the world as well as benefiting from its currency hedging, the latter mitigates any negative impact a stronger pound might have on its overseas holdings. These old acquaintances within my portfolio have enjoyed a resurgence in performance which has cemented their place in this month's BOTB and BFBS tables and therefore my own portfolio.
I had pondered switching out of the JPM Japan fund in favour of the Baring Korea Trust, to take advantage of the strong momentum in South Korean equities right now, but it felt like an unnecessary tweak given the small exposure. As long term 80-20 Investor members know, I try and keep changes to a minimum where possible. If I compare my asset mix with that of the BOTB the most notable differences are that the BOTB has 20% exposure to UK equities, while my portfolio now has around 11% exposure after the strong rally in UK equities over the last month. In addition, my portfolio has a small Japanese equity exposure as already mentioned, while the BOTB does not. I am also slightly underweight in Chinese and Asian equities at present versus the BOTB. Having said that I do not strictly follow the BOTB asset mix each month, instead trying to mirror it as best I can with minimal fund switches to avoid unnecessary time out of the market.
So given the rally in equity markets, shifting macro risks (rising COVID cases, new national lockdowns, upheaval in US politics to name a few) I am happy to leave my portfolio alone for now and let the dust settle on the new year, especially given its strong performance over the last month.
It is worth pointing out that two funds in my portfolio have dropped from high risk to medium risk over the last month, due to a re-categorisation by the 80-20 Investor algorithm. These are Baillie Gifford European and Allianz Total Return Asian Equity.
My portfolio
As I have made no fund changes this month my portfolio remains:
| Name | Allocation % (rounded) | Risk | Sector | ISIN Code |
| Allianz Total Return Asian Equity | 3 | Medium | Asia Pacific Excluding Japan |
GB00B1FRQV53
|
| ASI Strategic Bond | 16 | Low | Sterling Strategic Bond |
GB00BWK27X12
|
| Baillie Gifford European | 3.5 | Medium | Europe Excluding UK | GB0006058258 |
| Baillie Gifford Long Term Global Growth Investment | 5 | High | Global |
GB00BD5Z0Z54
|
| Baillie Gifford Positive Change | 3 | High | Global |
GB00BYVGKV59
|
| Fidelity Global High Yield | 8 | Medium | Sterling High Yield |
GB00B7K7SQ18
|
| Fidelity UK Smaller Companies | 7.5 | High | UK Smaller Companies |
GB00B7VNMB18
|
| Invesco Global Emerging Markets (UK) | 10 | High | Global Emerging Markets |
GB00B3RW7S64
|
| iShares Physical Gold ETC | 5 | Medium | Commodity & Energy ETF | IE00B4ND3602 |
| JPM Japan | 2.5 | Medium | Japan |
GB00B1XMTP77
|
| Premier Diversified Growth | 9.5 | Medium | Mixed Investment 40-85% Shares | GB00B8BJV423 |
| Sarasin Global Dividend | 8.5 | Medium | Global Equity Income |
GB00BGDF8F44
|
| T. Rowe Price Global Focused Growth Equity | 7.5 | Medium | Global | GB00BD446774 |
| VT Gravis Clean Energy Income | 11 | Medium | Global |
GB00BFN4H792
|
My Portfolio asset mix
My portfolio asset mix is as shown below which is around 61% equities.
-
- UK Equities 11%
- North American Equities 13%
- Asian Equities 4%
- Emerging Market Equities 6%
- Japanese Equities 3%
- European Equities 8%
- Chinese equities 3%
- Other equity 7%
- Commodities and energy 9%
- UK Fixed Interest 7%
- Global Fixed Interest 16%
- Cash 0%
- Alternative Investment Strategies 13%
Damien's higher risk and lower risk portfolios
Using the logic described in my post: Update to Damien’s alternative risk portfolios I created hypothetical higher and lower risk versions of my portfolio below:
Higher risk
| Fund | Allocation % |
| Allianz Total Return Asian Equity | 4 |
| Baillie Gifford European | 4 |
| Baillie Gifford Long Term Global Growth Investment | 6 |
| Baillie Gifford Positive Change | 4 |
| Fidelity Global High Yield | 10 |
| Fidelity UK Smaller Companies | 9 |
| Invesco Global Emerging Markets (UK) | 12 |
| iShares Physical Gold ETC | 6 |
| JPM Japan | 3 |
| Premier Miton Diversified Growth | 10 |
| Sarasin Global Dividend | 10 |
| T. Rowe Price Global Focused Growth Equity | 9 |
| VT Gravis Clean Energy Income | 13 |
Lower risk
| Fund | Allocation % |
| Allianz Total Return Asian Equity | 4 |
| ASI Strategic Bond | 21 |
| Baillie Gifford European | 5 |
| Fidelity Global High Yield | 11 |
| iShares Physical Gold ETC | 7 |
| JPM Japan | 3 |
| Premier Miton Diversified Growth | 13 |
| Sarasin Global Dividend | 11 |
| T. Rowe Price Global Focused Growth Equity | 10 |
| VT Gravis Clean Energy Income | 15 |

£200 Pension Cashback Offer
Make a qualifying deposit or transfer a pension to our partner Interactive Investor.
- Deposit or transfer a pension of at least £20k and you could earn £200 cashback
- Terms and Fees apply, Capital at risk
- New & Existing customers opening a SIPP
- Offer ends 31st July 2026
Before starting your transfer, check you won't lose any valuable benefits (such as guaranteed annuity rates or a lower protected pension age) and find out what exit fees you might have to pay
