

The background to my portfolio
Back in March 2015 I decided to invest £50,000 of my own money using 80-20 Investor. The purpose was twofold, firstly to show how you can use 80-20 Investor to invest and outperform the market with only a few minutes effort every now and then. Secondly, no other investment commentator, journalist or research provider invests their own money for fear of failing. This is a sorry state of affairs and is precisely why I committed to openly running my own portfolio for 80-20 Investor members to see.
Since then I have periodically changed my portfolio using the fund suggestions provided by the 80-20 Investor algorithm and associated research. I always disclose the changes at the time they are made.
Performance update
As is usual in my portfolio reviews, the chart below shows how my portfolio has outperformed since I started the challenge in March 2015, which is over seven years ago. The green line is the performance of my portfolio while the red line is the benchmark showing the average return achieved by professional fund managers given the same asset mix. To accurately calculate this I have used the average return for each sector in which my portfolio invested. The blue line shows what the average multi-asset fund with comparable equity content achieved. In other words, the red line would show the extra performance added by just the asset mix of my portfolio (where I was invested i.e European equities etc) over picking a typical multi-asset fund (the blue line). While the green line (which is my actual performance) shows the impact of being in the right funds at the right time, as identified by the 80-20 Investor algorithm.
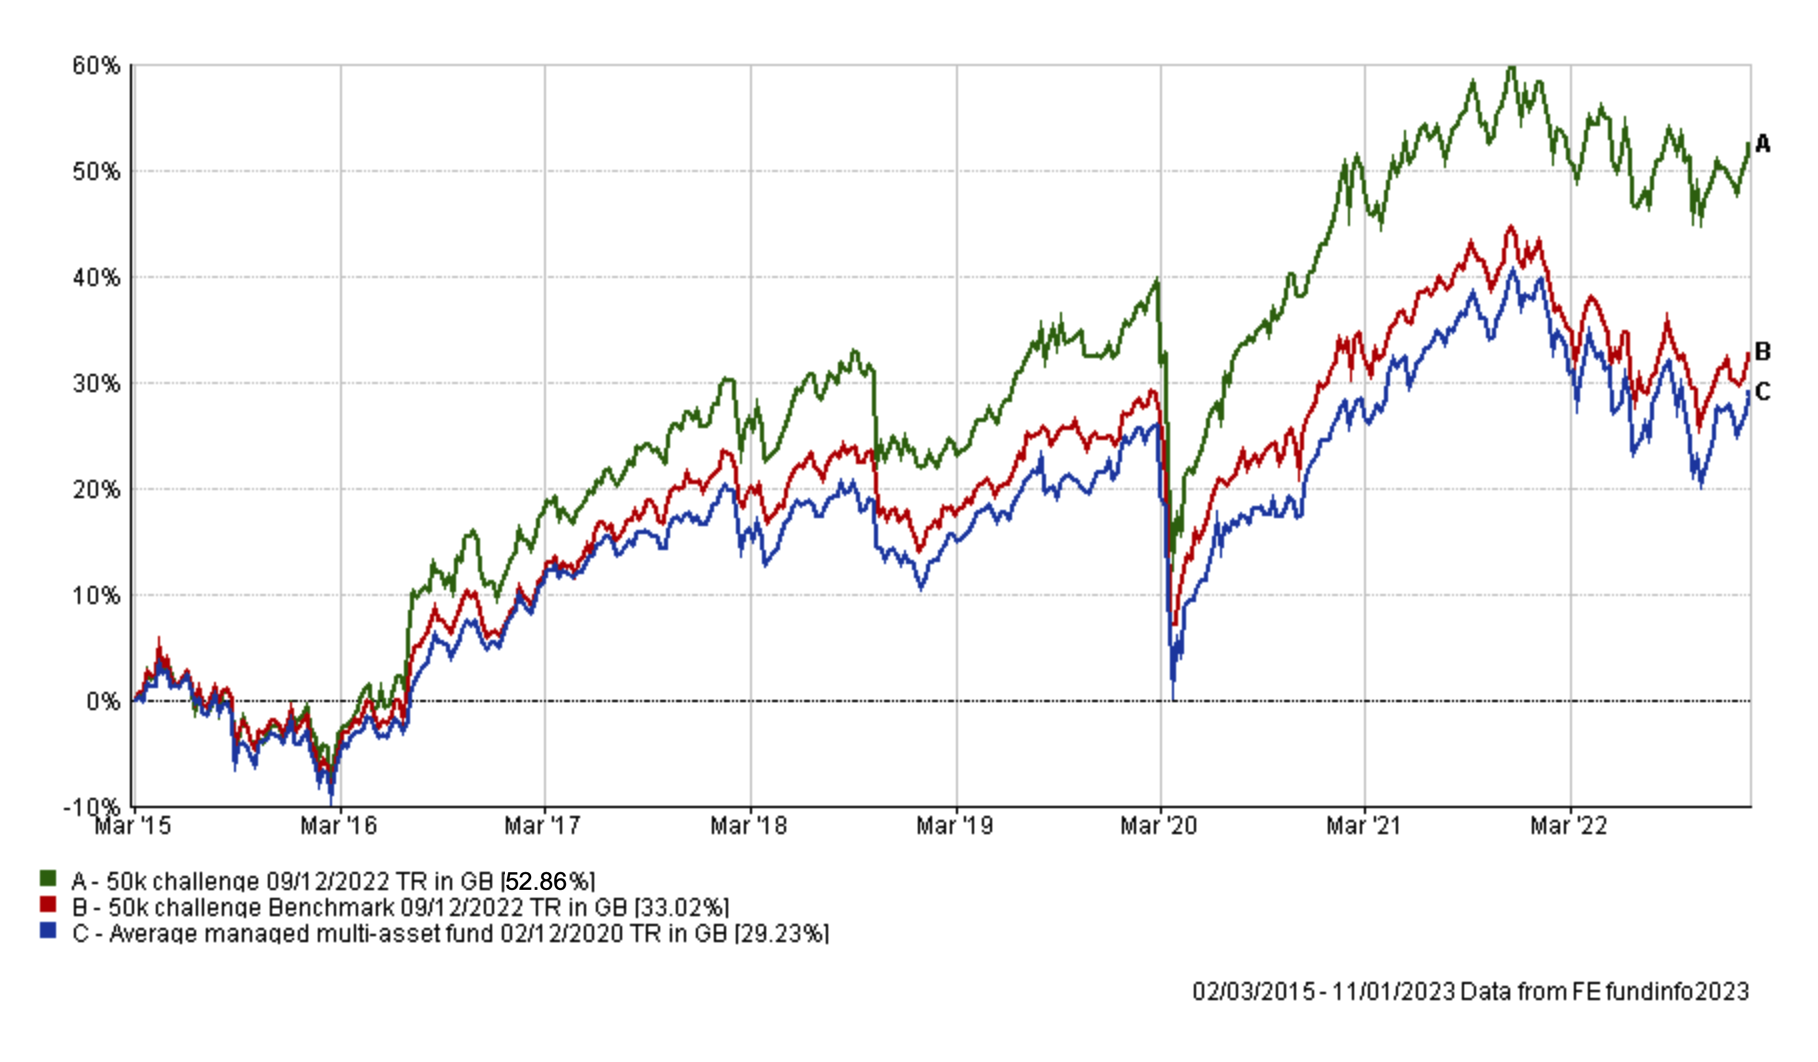
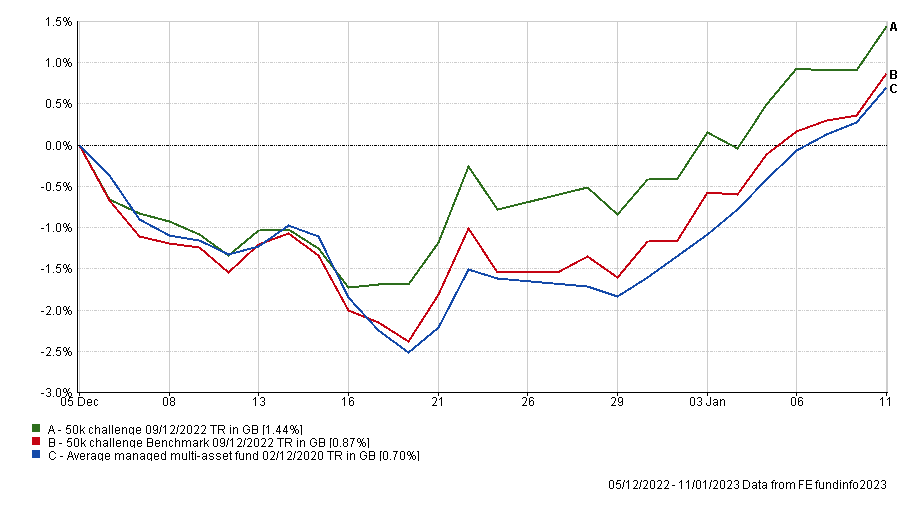
My portfolio continues to outperform its benchmarks over the long term and since my last update in December my £50k portfolio has extended that lead over its benchmarks as shown below.
Taking a closer look at the funds within my portfolio, the table below shows the individual performance of each holding in my portfolio since my last review on 5th December, with gold performing very strongly as did funds with significant European equity exposure (Jupiter Global Value Equity). It is also good to see new additions BNY Mellon Global Income and FSSA Asia Focus performing well.
|
Fund |
Performance since last review on 5th December |
| iShares Physical Gold ETC | 6.18 |
| Jupiter Global Value Equity | 4.75 |
| FSSA Asia Focus | 3.73 |
| BNY Mellon Global Income | 2.53 |
| M&G Global Dividend | 2.53 |
| McInroy & Wood Balanced | 1.63 |
| JOHCM Global Opportunities | 1.53 |
| Janus Henderson Inst Overseas Bond | 0.7 |
| Thesis TM Tellworth UK Select | 0.58 |
| BlackRock Natural Resources Growth & Income | 0.38 |
| Cash | 0.19 |
| TB Evenlode Income | -0.02 |
| Premier Miton Defensive Growth | -0.24 |
| Fidelity American Special Situations | -0.43 |
It is slightly unusual that I have waited almost until mid-month to make changes to my portfolio, but that is partly a function of the time of year. A combination of fewer trading days since my last review, due to the festive season, plus a number of potentially market moving events this week meant that now was really the earliest point at which I was comfortable tweaking my portfolio. The potentially market moving events this week were the speech from US Federal Reserve Chair, Jerome Powell, and the release of the latest inflation data in the US. In the end both passed without causing significant volatility, which was somewhat surprising given that the release of US inflation data has been the biggest driver of market volatility in recent months, as explained in my past newsletter titled "a pivotal week?"
While volatility in itself is part of investing, if you are in and out of the market while making portfolio changes it can hurt you. Now I am more comfortable making fund switches. Of course it does mean that there is little over two weeks until the new BOTB is published so I have kept that in mind when reviewing my portfolio at this time.
As usual, the table below shows which funds within my portfolio are in the current BOTB or BFBS tables and which are not. Those funds in blue are still in the BOTB while those in orange are not in the BOTB but remain in the BFBS list. Meanwhile, any funds in red have dropped out of both shortlists.
| Fund | Allocation | Risk | Sector | ISIN |
| BlackRock Natural Resources Growth & Income | 4.5 | High | Commodity/Natural Resource | GB00B6865B79 |
| BNY Mellon Global Income | 6.5 | Medium | Global Equity Income |
GB00B7XK5M25
|
| Cash | 7 | Low | ||
| Fidelity American Special Situations | 8.5 | Medium | North America | GB00B89ST706 |
| FSSA Asia Focus | 5.5 | High | Asia Pacific Excluding Japan |
GB00BWNGXJ86
|
| iShares Physical Gold ETC | 5 | Medium | Commodity & Energy ETF | IE00B4ND3602 |
| Janus Henderson Inst Overseas Bond | 9 | Low | Global Bonds | GB0007673055 |
| JOHCM Global Opportunities | 5.5 | Medium | Global | GB00BJ5JMC04 |
| Jupiter Global Value Equity | 10 | Medium | Global | GB00BF5DRF26 |
| M&G Global Dividend | 7 | Medium | Global Equity Income | GB00B46J9127 |
| McInroy & Wood Balanced | 12 | Medium | Mixed Investment 40-85% Shares | GB00B7RRJ163 |
| Premier Miton Defensive Growth | 9 | Low | Targeted Absolute Return | GB00B832BD89 |
| TB Evenlode Income | 5 | Medium | UK All Companies | GB00BD0B7D55 |
| Thesis TM Tellworth UK Select | 5.5 | Low | Targeted Absolute Return | GB00BNY7YM73 |
You can see that only three funds (highlighted in red) are not in either the BOTB or the BFBS tables. Those three funds are:
- Premier Miton Defensive Growth
- McInroy & Wood Balanced
- JOHCM Global Opportunities
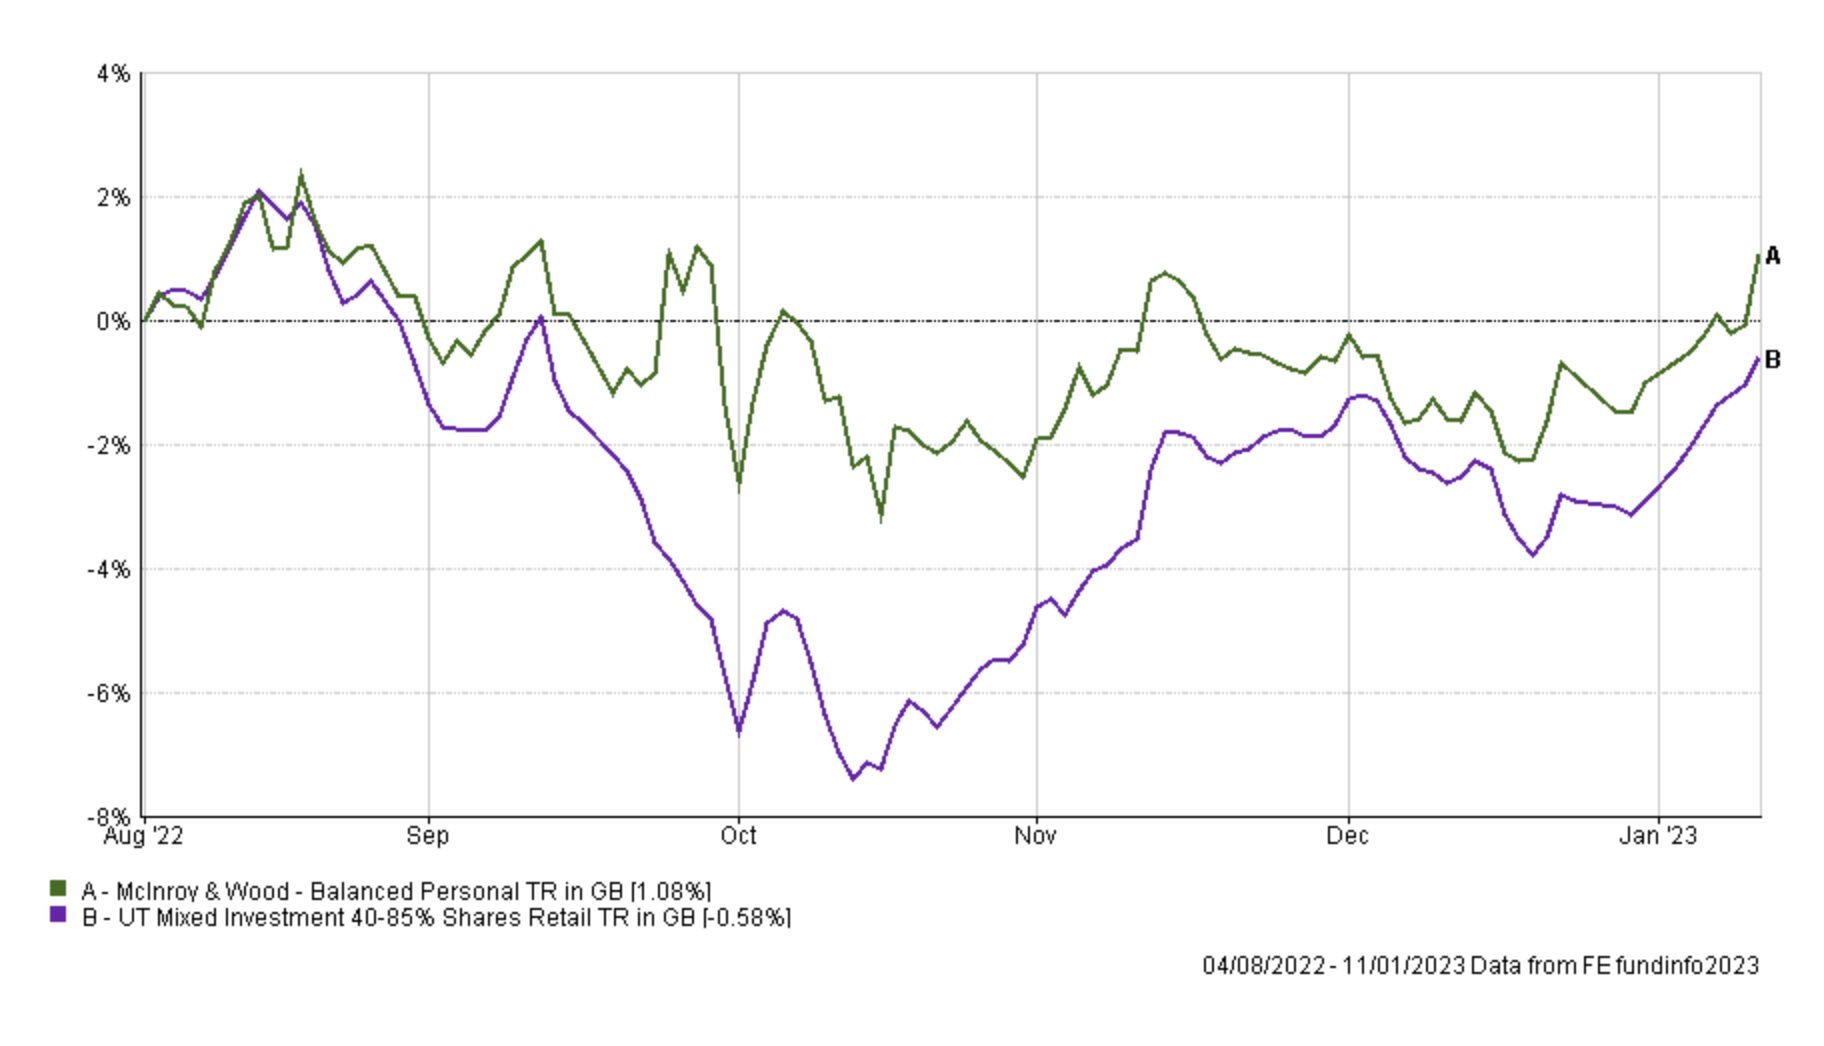
If you recall, last month I reduced my exposure to the JOHCM Global Opportunities fund. Interestingly it's since had a new lease of life as shown below
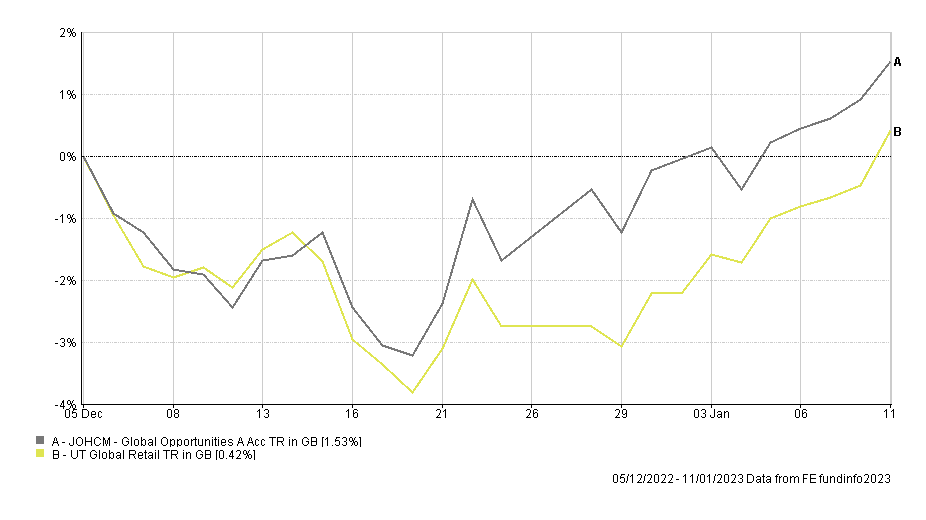
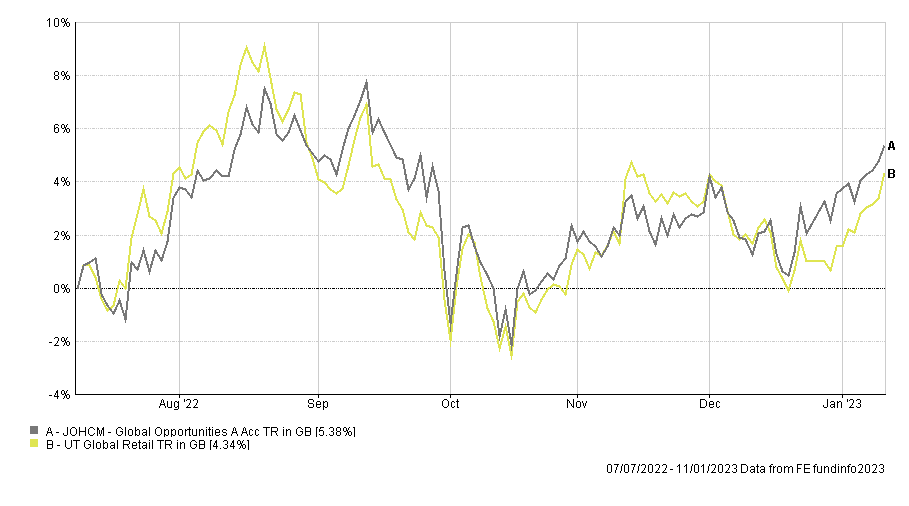
But if you look at the performance of the fund since I first held it back in July 2023, its performance has mostly tracked that of its peers, ignoring its performance over the festive period.
So I will continue with the plan to remove my exposure to the JOHCM fund, while looking to slightly increase my European equity exposure in a similar vein to the latest BOTB. European equities have had a strong wave of positive momentum since October, but of course only time will tell if this continues. To increase my European equity exposure I will switch into TB Saracen Global Income & Growth, which is a Global Equity Income fund in the current BOTB. The fund's biggest geographical allocation is in European equities (accounting for 44% of the fund's assets) as opposed to US equities (32%) which normally makes up the lion's share of assets in most global funds.
The McInroy & Wood Balanced fund is an interesting one. On the one hand it was in the BFBS tables as recently as last month but as shown in the chart below it has significantly lagged its peer group over the last few months which is why it has dropped out of the 80-20 Investor tables.
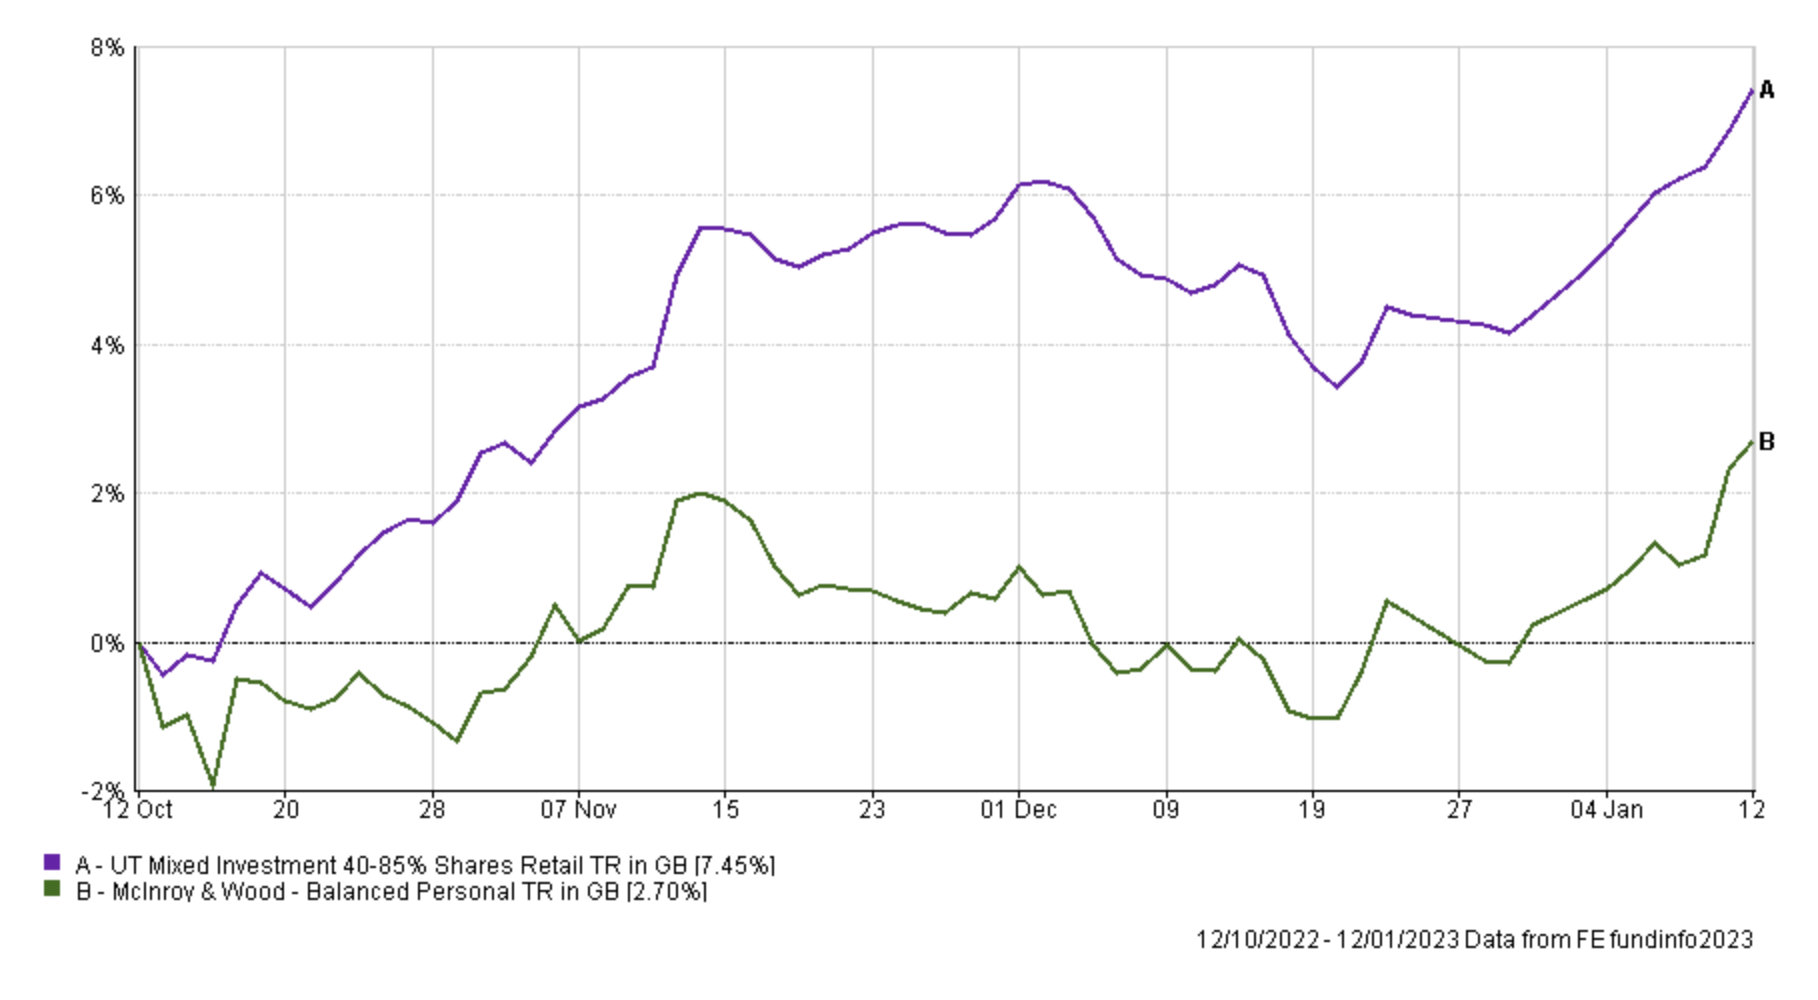
However, I've decided to make a like for like swap for a fund from the same sector that is in the current BOTB. The fund I've chosen is the Jupiter Merlin Balanced Portfolio, which is a fund of funds and interestingly has some exposure to three of the funds I already hold that have performed well. They are Jupiter Global Value Equity, M&G Global Dividend and TB Evenlode Income. This isn't a problem when they are outperforming but if they start to underperform it will obviously impact the returns of the Jupiter fund. That being said, if you look at the asset mix of the Jupiter fund the exposure to those three funds would be the equivalent of me increasing the allocation percentage to those three funds by just over 2% in total. So not very significant. I rarely invest in a fund of funds (which is a fund that simply invests in other funds) although not through deliberate choice but because they have not outperformed their peers and therefore have not appeared in the 80-20 Investor tables. But I am willing to include the Jupiter fund within my portfolio at this time. It's a good demonstration of how I look at a fund's factsheet to see how it is invested, with the aim of not picking funds which are essentially replicas of each other and therefore highly correlated.
Turning my attention to Premier Miton Defensive Growth, the chart below shows the performance of the fund over the last 3 months versus its peers.
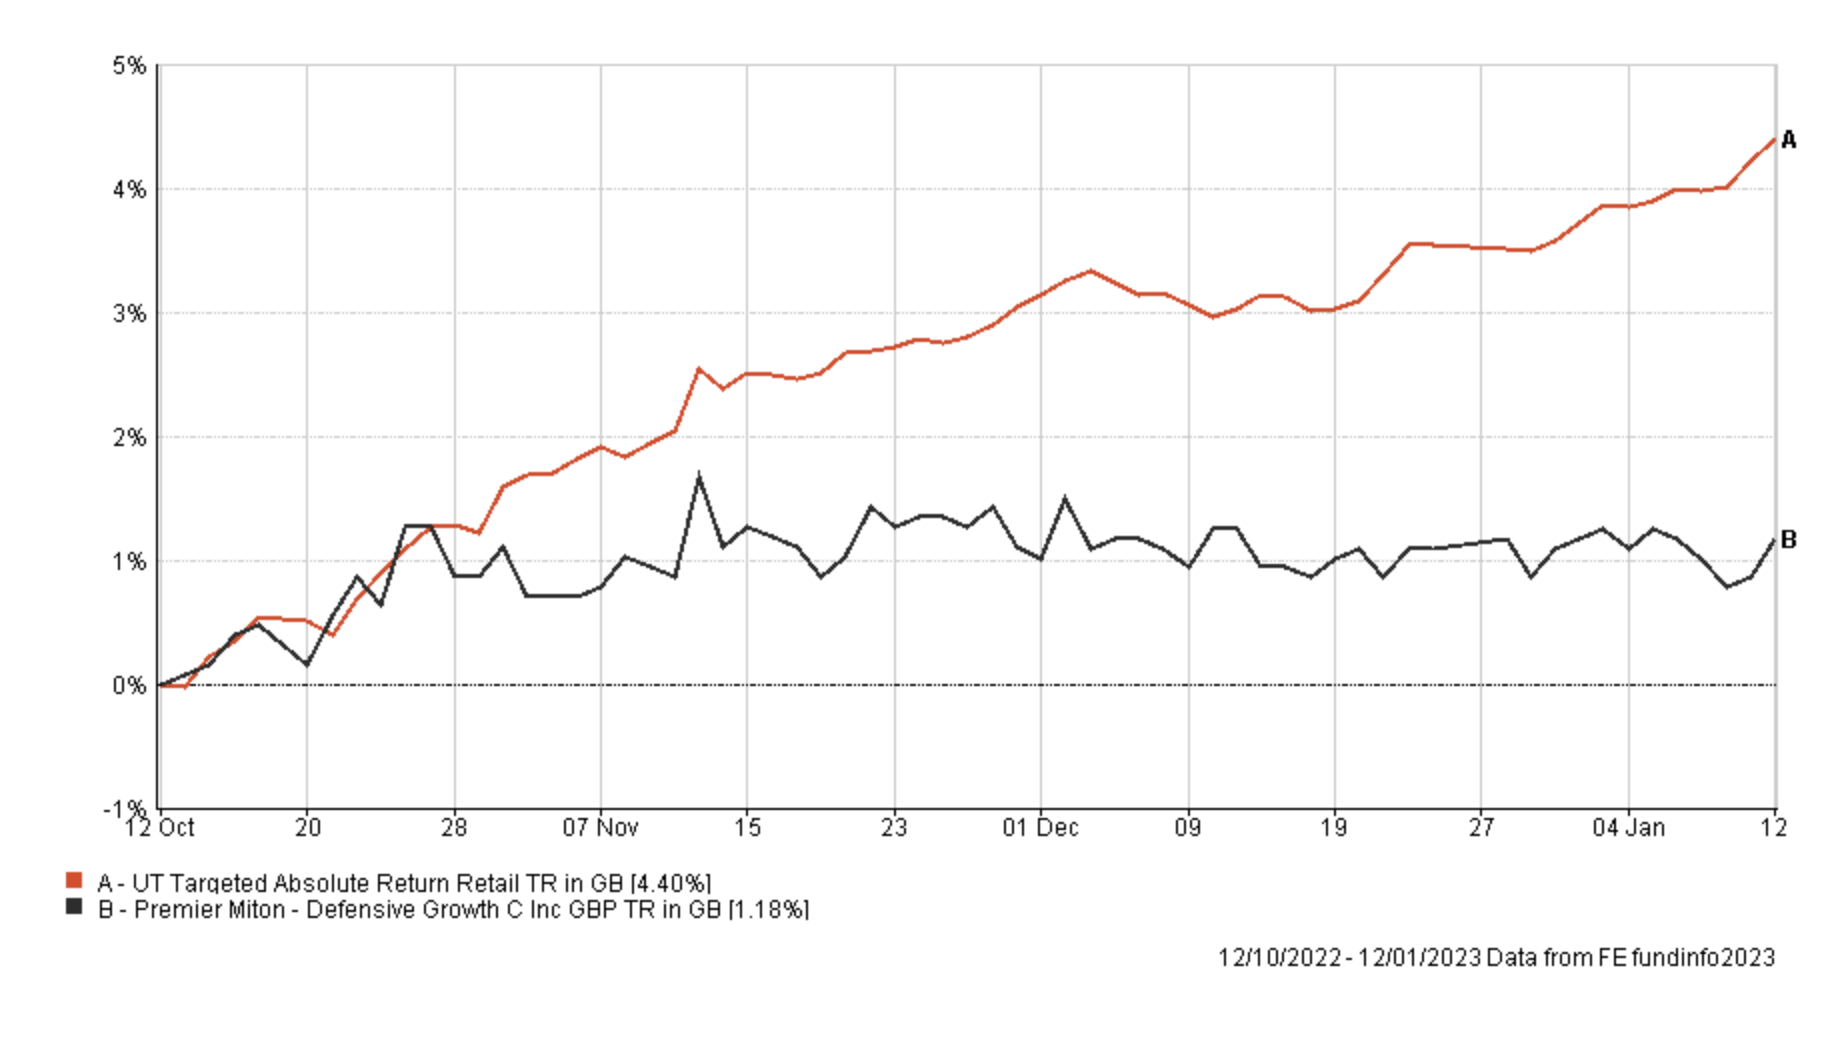
The planned transactions will impact almost 17.5% of my portfolio, which I feel is sufficient in the current circumstances.
Fund switch
- 100% out of McInroy & Wood Balanced and 100% into Jupiter Merlin Balanced Portfolio
- 100% out of JOHCM Global Opportunities and 100% in TB Saracen Global Income & Growth
The changes mean that my UK and European equity exposure has increased slightly, the latter more in line with the BOTB asset mix.
My portfolio
My portfolio now looks like this:
| Fund | Allocation | Risk | Sector | ISIN |
| BlackRock Natural Resources Growth & Income | 4.5 | High | Commodity/Natural Resource | GB00B6865B79 |
| BNY Mellon Global Income | 6.5 | Medium | Global Equity Income |
GB00B7XK5M25
|
| Cash | 7 | Low | ||
| Fidelity American Special Situations | 8.5 | Medium | North America | GB00B89ST706 |
| FSSA Asia Focus | 5.5 | High | Asia Pacific Excluding Japan |
GB00BWNGXJ86
|
| iShares Physical Gold ETC | 5 | Medium | Commodity & Energy ETF | IE00B4ND3602 |
| Janus Henderson Inst Overseas Bond | 9 | Low | Global Bonds | GB0007673055 |
| TB Saracen Global Income & Growth | 5.5 | Medium | Global Equity Income | GB00B5B35X02 |
| Jupiter Global Value Equity | 10 | Medium | Global | GB00BF5DRF26 |
| M&G Global Dividend | 7 | Medium | Global Equity Income | GB00B46J9127 |
| Jupiter Merlin Balanced Portfolio | 12 | Medium | Mixed Investment 40-85% Shares | GB0031845141 |
| Premier Miton Defensive Growth | 9 | Low | Targeted Absolute Return | GB00B832BD89 |
| TB Evenlode Income | 5 | Medium | UK All Companies | GB00BD0B7D55 |
| Thesis TM Tellworth UK Select | 5.5 | Low | Targeted Absolute Return | GB00BNY7YM73 |
My Portfolio asset mix
My portfolio asset mix has around 61% exposure to equities. Last month's figures are shown in brackets.
-
- UK Equities 17% (14%)
- North American Equities 14% (15%)
- Asian/Emerging Market Equities 7% (6%)
- Japanese Equities 0% (0%)
- European Equities 9% (7%)
- Chinese equities 0% (0%)
- Other equity 11% (12%)
- Commodities and energy 8% (9%)
- UK Fixed Interest 0% (0%)
- Global Fixed Interest 11% (10%)
- Cash 7% (7%)
- Alternative Investment Strategies 16% (20%)
- Property 0% (0%)
Damien's higher risk and lower risk portfolios
Using the logic described in my post: Update to Damien’s alternative risk portfolios I created hypothetical higher and lower risk versions of my portfolio below:
Lower risk
| Fund | Allocation % |
| BNY Mellon Global Income | 7 |
| Cash | 8 |
| Fidelity American Special Situations | 9 |
| iShares Physical Gold ETC | 6 |
| Janus Henderson Inst Overseas Bond | 10 |
| TB Saracen Global Income & Growth | 6 |
| Jupiter Global Value Equity | 11 |
| M&G Global Dividend | 8 |
| Jupiter Merlin Balanced Portfolio | 13 |
| Premier Miton Defensive Growth | 10 |
| TB Evenlode Income | 6 |
| Thesis TM Tellworth UK Select | 6 |
Higher risk
| Fund | Allocation % |
| BlackRock Natural Resources Growth & Income | 7 |
| BNY Mellon Global Income | 10 |
| Fidelity American Special Situations | 12 |
| FSSA Asia Focus | 8 |
| iShares Physical Gold ETC | 7 |
| TB Saracen Global Income & Growth | 8 |
| Jupiter Global Value Equity | 14 |
| M&G Global Dividend | 10 |
| Jupiter Merlin Balanced Portfolio | 17 |
| TB Evenlode Income | 7 |

£200 Pension Cashback Offer
Make a qualifying deposit or transfer a pension to our partner Interactive Investor.
- Deposit or transfer a pension of at least £20k and you could earn £200 cashback
- Terms and Fees apply, Capital at risk
- New & Existing customers opening a SIPP
- Offer ends 31st July 2026
Before starting your transfer, check you won't lose any valuable benefits (such as guaranteed annuity rates or a lower protected pension age) and find out what exit fees you might have to pay
