

The background to my portfolio
Back in March 2015 I decided to invest £50,000 of my own money using 80-20 Investor. The purpose was twofold, firstly to show how you can use 80-20 Investor to invest and outperform the market with only a few minutes effort every now and then. Secondly, no other investment commentator, journalist or research provider invests their own money for fear of failing. This is a sorry state of affairs and is precisely why I committed to openly running my own portfolio for 80-20 Investor members to see.
Since then I have periodically changed my portfolio using the fund suggestions provided by the 80-20 Investor algorithm and associated research. I always disclose the changes at the time they are made.
Performance update
As is usual in my portfolio reviews, the chart below shows how my portfolio has outperformed since I started the challenge in March 2015, three years ago. The green line is the performance of my portfolio while the red line is the benchmark showing the average return achieved by professional fund managers given the same asset mix. To accurately calculate this I have used the average return for each sector in which my portfolio invested. The blue line shows what the average multi-asset fund with comparable equity content achieved. In other words, the red line would show the extra performance added by just the asset mix of my portfolio (where I was invested i.e European equities etc) over picking a typical multi-asset fund (the blue line). While the green line (which is my actual performance) shows the impact of being in the right funds at the right time, as identified by the 80-20 Investor algorithm.
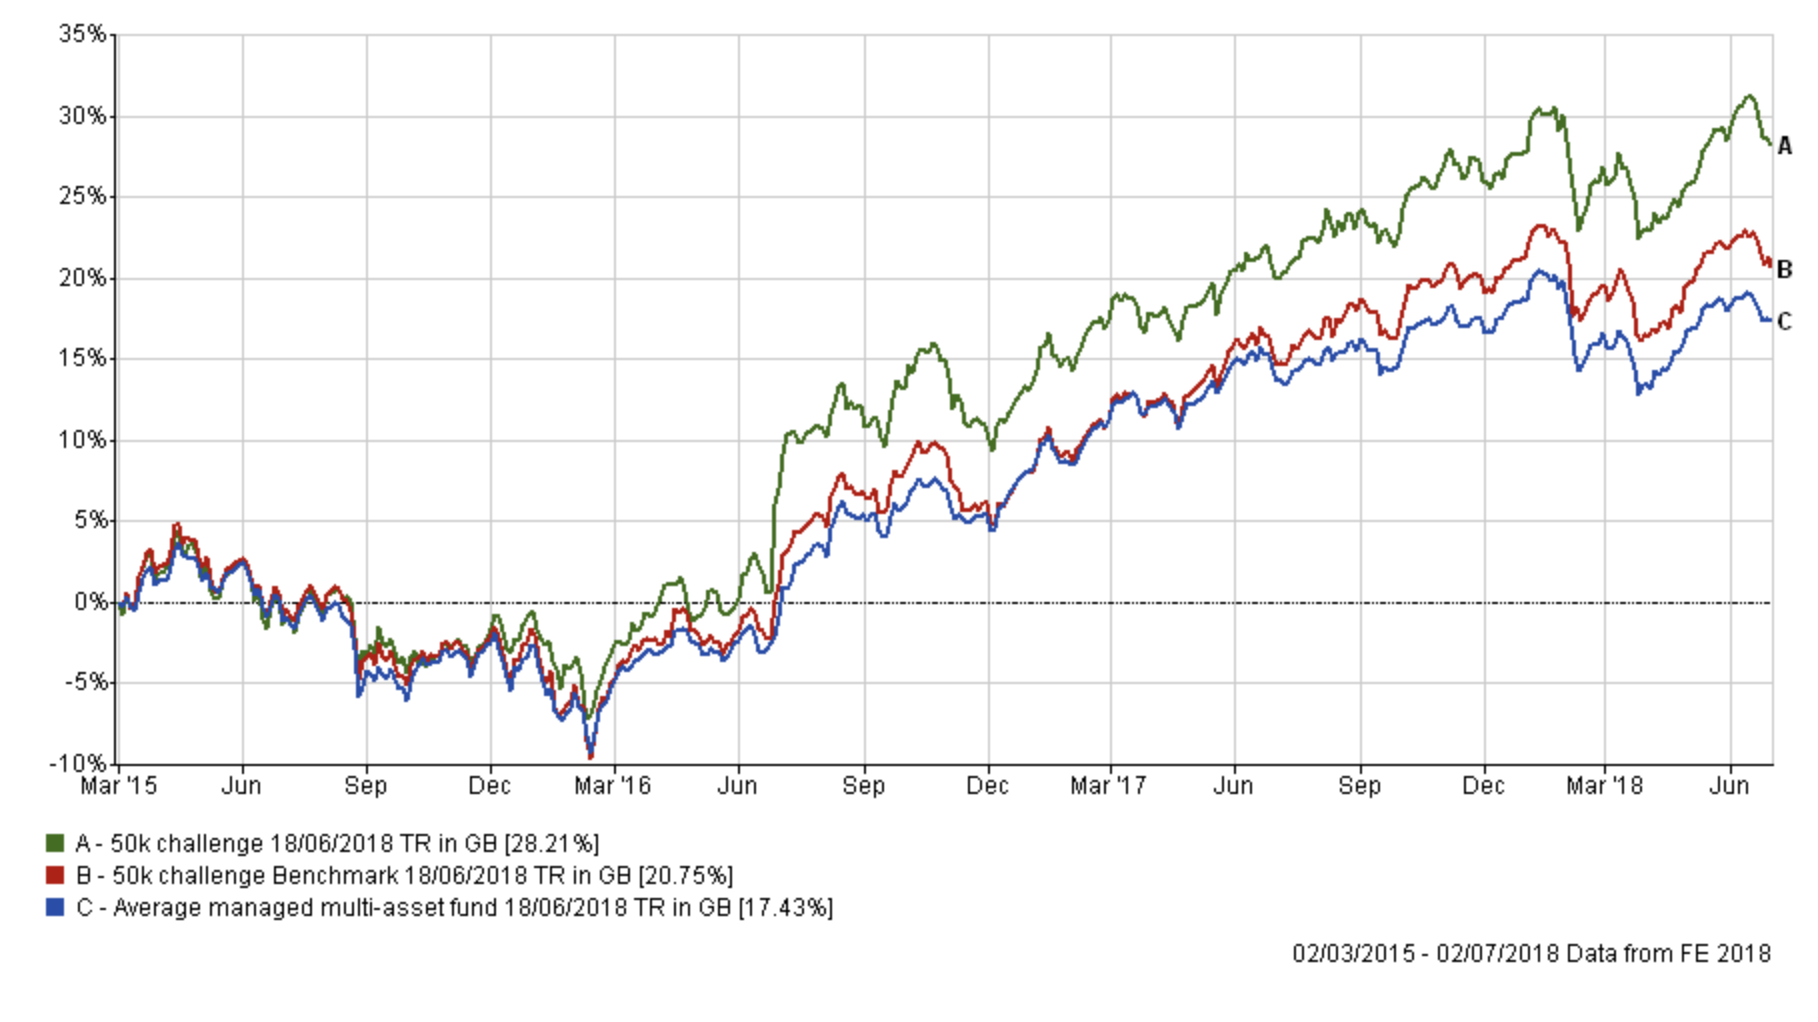
It has only been around two weeks since I tweaked my portfolio and in that time markets have wobbled and my portfolio has given up 0.52% of its outperformance versus its benchmarks. Not much admittedly. Given the recency of my last review, I have no intention of making wholesale changes. The reason why I am reviewing my portfolio now is in response to the July's BOTB which has just been released. Over the last two months the BOTB's Asian equity exposure (including China) has fallen. When I made the changes to my portfolio two weeks ago I pondered reducing my China exposure but chose instead to maintain it with a view to seeing how the rest of the month played out. Hindsight is a wonderful thing and that point marked the recent peak for Chinese equities before the sell-off took hold. Much has been made of the impact of the rising tensions surrounding the US-China trade war but as mentioned in my latest weekly newsletter (where I looked at Chinese equities in particular) there are signs that some of the nervousness can be attributed to data showing weaker Chinese economic growth. Chinese equities have now entered bear market territory and Asian equities have also struggled.
In July's BOTB all exposure to Chinese equities and Asian equities has been removed in favour of other high-risk opportunities, most notably in US equities and especially in tech stocks. We've also seen a stop loss alert triggered for the sole China funds in June's BOTB and the situation has not improved for Chinese equities yet. The big question is whether we've seen the bottom of the Chinese equity sell-off or whether there is much further to fall? Much depends on the People's Bank of China (PBoC) and whether they step in to prop up their currency, and there have been signs that they are prepared to do so. The reality is that I don't have a crystal ball and while some Asia and Chinese equity funds remain in the BFBS the fall in momentum means that there are possibly better high-risk opportunities elsewhere. For that reason, I have taken the decision to remove any Chinese or Asian exposure from my portfolio until their momentum improves.
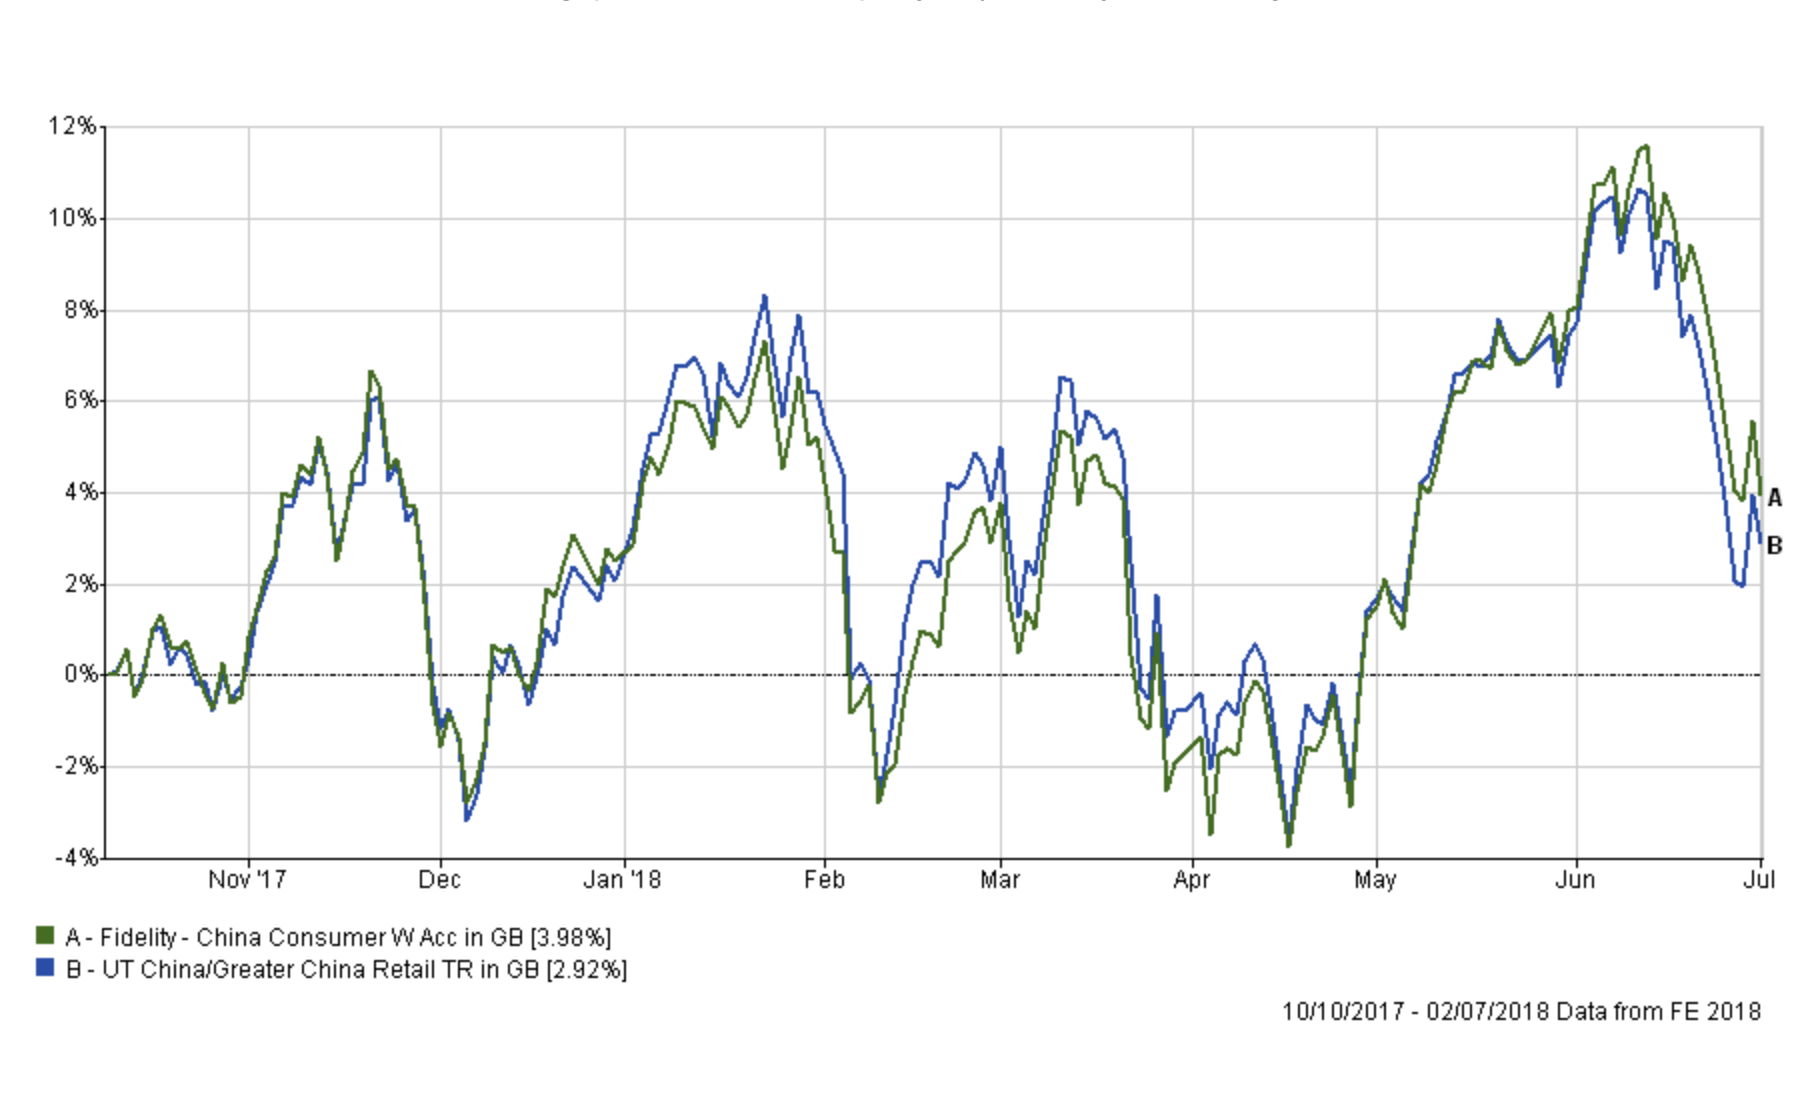
The chart below shows the performance of the Fidelity China Consumer fund since I've held it and you can see that it's done well despite the recent sell-off and sits in profit and has outperformed the average China fund. Taking the profit now, despite the recent sell-off seems sensible.
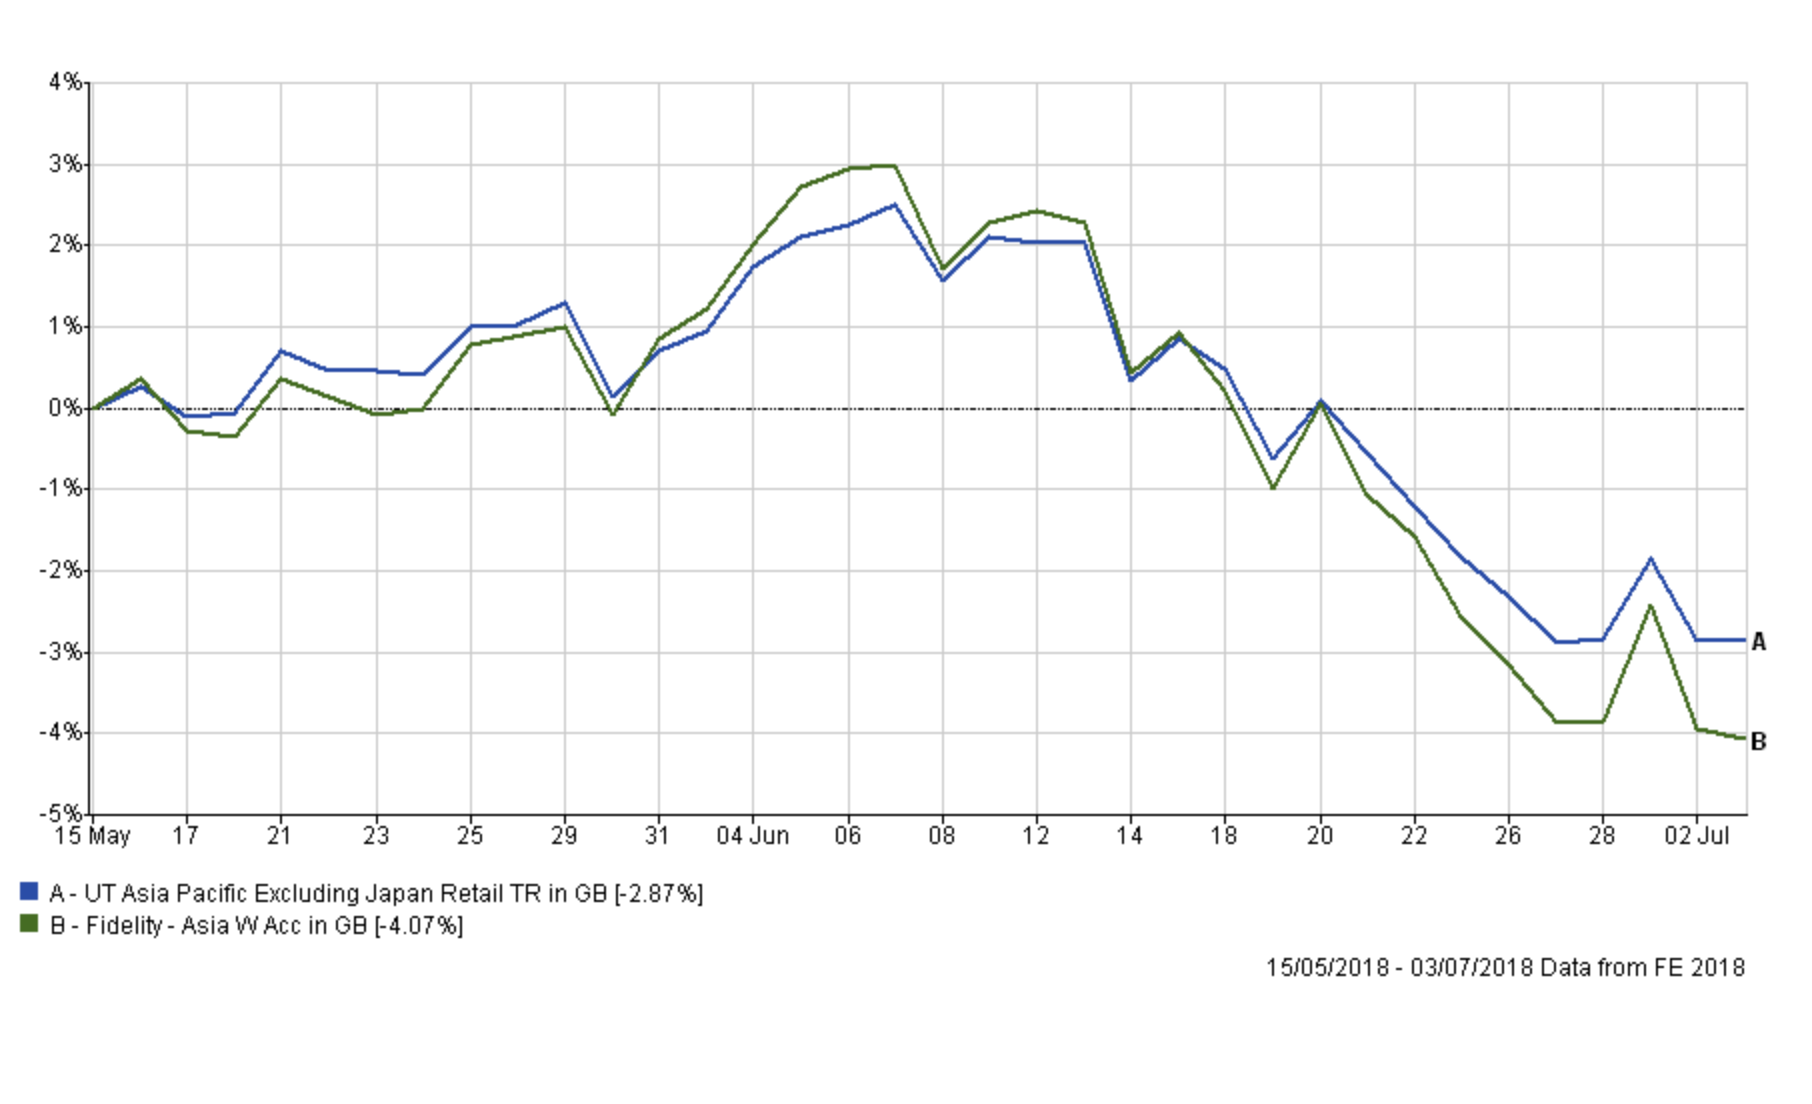
Similarly, the chart below shows the performance of Fidelity Asia since it's entered my portfolio. I'll be closing out a loss but the fund has marginally underperformed its peer group of late and it does have a significant exposure to Chinese equities. The 'good news' is that the fund has only accounted for 4% of my portfolio so the marginal underperformance versus its peers only represents a 0.04% hit to my portfolio's overall performance. Like the China Consumer fund it remains in the BFBS tables but as a high-risk asset class, the risk/reward trade-off is not as attractive as others.
Looking at the rest of my portfolio, the table below shows my current allocation, with those funds in green still in the BOTB while those in yellow are not in the BOTB but remain in the BFBS list. Meanwhile, any funds in red have dropped out of both shortlists.
| Name | Allocation % (rounded) | Risk | Sector | ISIN Code | SEDOL Code |
| Baillie Gifford Global Discovery | 5.5 | Medium | Global | GB0006059330 | 605933 |
| AXA Framlington American Growth | 12 | High | North America | GB00B5LXGG05 | B5LXGG0 |
| Fidelity Asia | 4.6 | High | Asia Pacific Excluding Japan Ret | GB00B6Y7NF43 | B6Y7NF4 |
| Fidelity China Consumer | 7 | High | China/Greater China | GB00B82ZSC67 | B82ZSC6 |
| FP Pictet Multi Asset Portfolio | 6.6 | Low | Targeted Absolute Return | GB00BVYTTC41 | BVYTTC4 |
| Jupiter Japan Income | 6.7 | Medium | Japan | GB00B0HZTZ55 | B0HZTZ5 |
| Jupiter UK Smaller Companies | 7.9 | Medium | UK Smaller Companies | GB0004911870 | 491187 |
| Premier Diversified | 19 | Medium | Mixed Investment 40-85% Shares | GB00B8BJV423 | B8BJV42 |
| Standard Life Investments UK Real Estate | 5.7 | Low | Property | GB00BYPHP536 | BYPHP53 |
| TwentyFour Dynamic Bond | 10.7 | Low | Sterling Strategic Bond | GB00B5KPRZ34 | B5KPRZ3 |
| Allianz UK Equity Income | 7.2 | Medium | UK Equity Income | GB00B82ZGC20 | B82ZGC2 |
| LF Miton European Opportunities | 7.1 | Medium | Europe Excluding UK | GB00BZ2K2M84 | BZ2K2M8 |
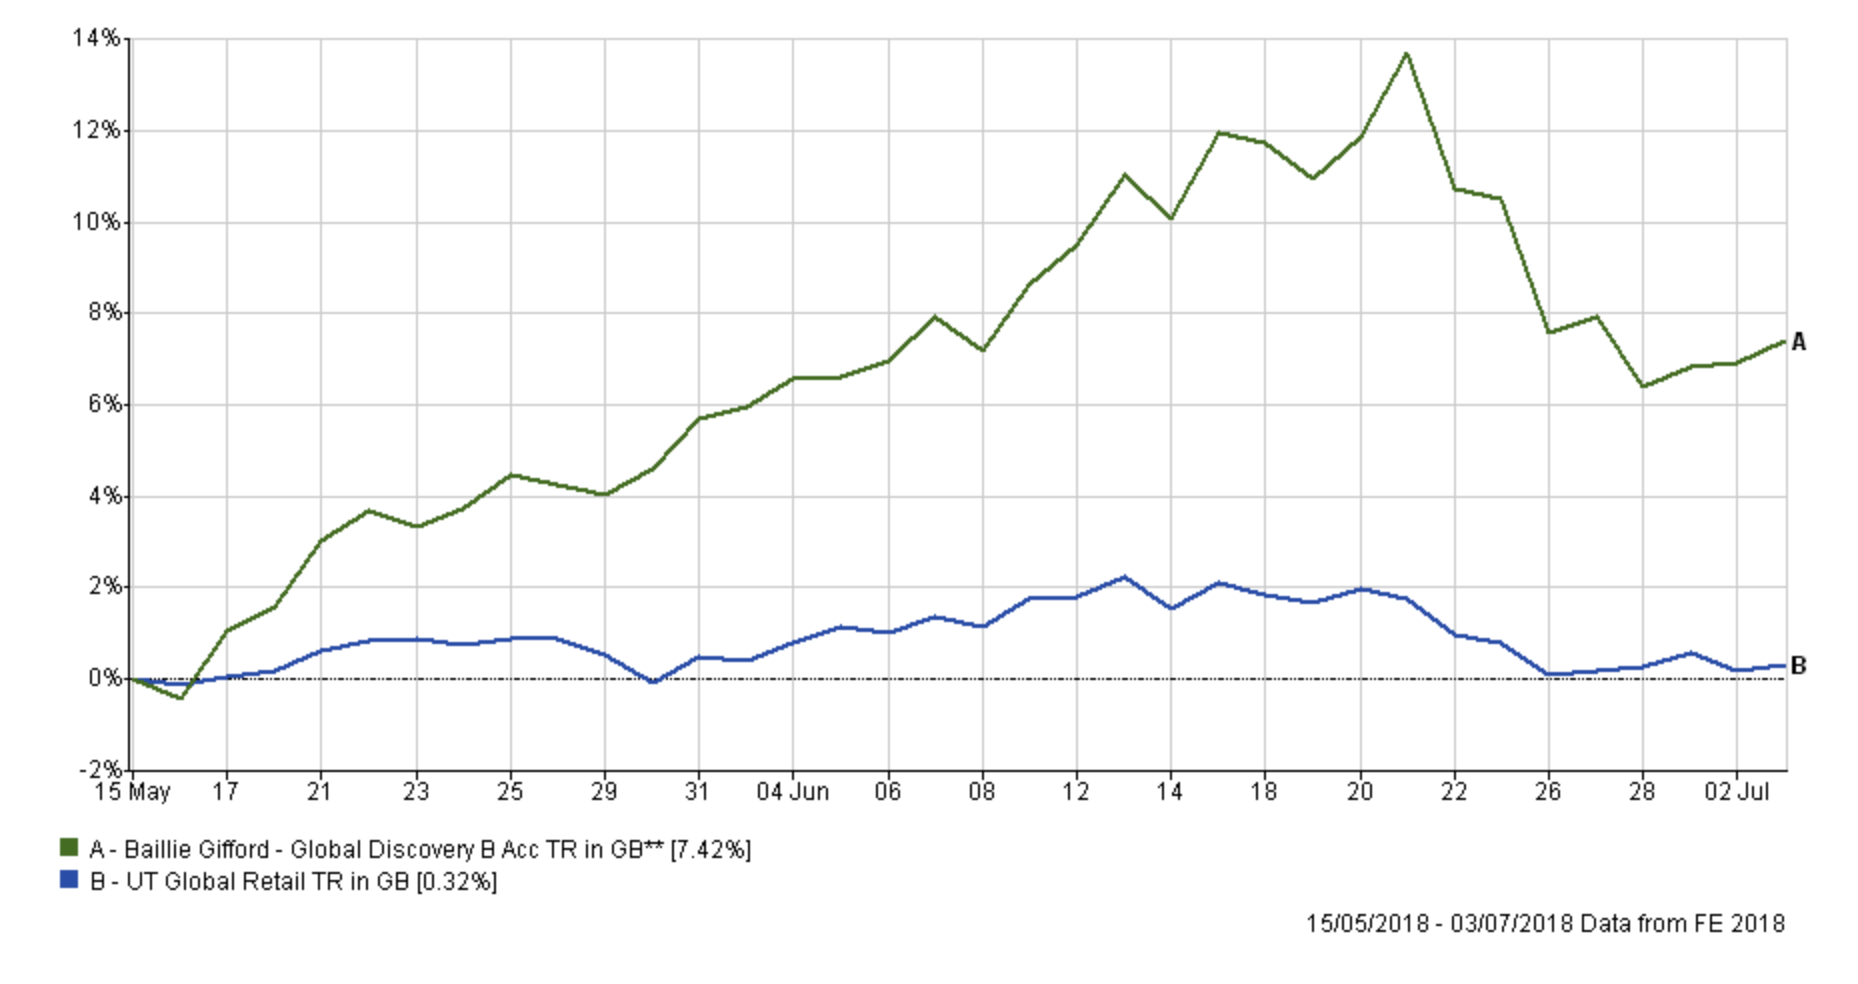
Aside from switching out of Fidelity Asia and Fidelity China Consumer I will leave the remainder of the portfolio alone. My view on Twentyfour Dynamic Bond hasn't changed since my update in June two weeks ago, but with bond funds still struggling there are limited options that have markedly outperformed the fund in question. FP Pictet Multi Asset Portfolio has only just dropped out of the BFBS table so I will keep this fund under review in the coming weeks. However, I will not look to add to it further. Furthermore, the Baillie Gifford Discovery fund is colour-coded red but I am maintaining it for now for the reason given last time. Again, the fund is on my watchlist as it has experienced a dip in performance. However, the chart below shows the performance of the fund versus its peers since I've held it and for now, at least, the fund is performing well overall.
It is interesting to see that the 'boring' Standard Life UK Real Estate fund has continued to outperform most bond funds and even other property funds. The fund has even re-entered both the BOTB and BFBS tables.
Below I list the switches I am making this time and the reasons:
Fund switches
- 100% out of Fidelity China Consumer and 70% into Standard Life Investments Global Smaller Companies and 30% into Standard Life Investments UK Real Estate
- 100% out of Fidelity Asia and 100% into BlackRock European Absolute Alpha
In carrying out the above switches I:
- bring my portfolio's property position in line with that of the BOTB and further diversify my portfolio. I was reticent about doing so for reasons I mentioned last month. These centred around the uncertainties over Brexit and the danger of a repeat of the panic that trapped investors in property funds back in 2016. However, I've only added marginally to my property exposure, in the absence of better alternatives, but will likely look to reduce it in the coming months in favour of other low-risk assets or even cash.
- reduced my overall equity exposure, in the same vein as this month's BOTB, down towards 60%. Developed market equities generally remain in an uptrend for now but there remain a lot of uncertainties.
I chose the Standard Life Investments Global Smaller Companies fund as it is another high-risk fund but is more geographically diversified and has been a regular in the BOTB. With its focus on smaller companies, it has managed to fare better than many of its large-cap focused peers that have been battered by trade war fears. My choice for a low-risk alternative to my Fidelity Asia fund proceeds was tricky. I didn't want to increase my FP Pictet Multi Asset Portfolio so opted for an alternative in BlackRock European Absolute Alpha. The fund is in this month's BOTB and is the one Targeted Absolute Return fund from this month's BOTB which is available on my platform. It coincidentally also happens to be the cheapest targeted absolute return funds listed and the one with the lowest max weekly fall figure. Hopefully the latter is a sign of resilience if the market stutters. Interestingly the fund does have a small bid/offer spread and generally I look to avoid such funds. However, the spread is 0.07%, so almost negligible and not enough to worry about.
Overall I am switching about 11% of my portfolio, which is a small amount. My new portfolio will look as follows with an equity exposure of around 60% (down from 66%).
| Name | Allocation % (rounded) | Risk | Sector | ISIN Code | SEDOL Code |
| Baillie Gifford Global Discovery | 5.5 | Medium | Global | GB0006059330 | 605933 |
| AXA Framlington American Growth | 12 | High | North America | GB00B5LXGG05 | B5LXGG0 |
| BlackRock European Absolute Alpha |
4.5 | Low | Targeted Absolute Return | GB00B4Y62W78 | B4Y62W7 |
| Standard Life Investments Global Smaller Companies |
4.8 | High | Global | GB00B7KVX245 | B7KVX24 |
| FP Pictet Multi Asset Portfolio | 6.6 | Low | Targeted Absolute Return | GB00BVYTTC41 | BVYTTC4 |
| Jupiter Japan Income | 6.6 | Medium | Japan | GB00B0HZTZ55 | B0HZTZ5 |
| Jupiter UK Smaller Companies | 7.9 | Medium | UK Smaller Companies | GB0004911870 | 491187 |
| Premier Diversified | 19.2 | Medium | Mixed Investment 40-85% Shares | GB00B8BJV423 | B8BJV42 |
| Standard Life Investments UK Real Estate | 7.8 | Low | Property | GB00BYPHP536 | BYPHP53 |
| TwentyFour Dynamic Bond | 10.8 | Low | Sterling Strategic Bond | GB00B5KPRZ34 | B5KPRZ3 |
| Allianz UK Equity Income | 7.2 | Medium | UK Equity Income | GB00B82ZGC20 | B82ZGC2 |
| LF Miton European Opportunities | 7.1 | Medium | Europe Excluding UK | GB00BZ2K2M84 | BZ2K2M8 |
My new asset mix
This means my new asset mix is (previous asset mix is in brackets):
-
- UK Equities 19% (19%)
- North American Equities 21% (19%)
- Global Fixed Interest 8% (8%)
- Japanese Equities 9% (8%)
- Other International Equities 0% (0%)
- Asian equities 0% (4%)
- European Equities 11% (10%)
- UK Fixed Interest 0% (0%)
- Cash 4% (4%)
- Alternative Investment Strategies 19% (15%)
- Emerging Asia equities 0% (6%)
- Emerging Market Fixed Interest 0% (0%)
- Property 9% (7%)
Damien's high risk and low risk portfolios
Using the logic described in my post New: Damien’s Higher Risk Portfolio the higher and lower risk versions of my portfolio would like as follows:
Higher risk
| Name | Allocation % (rounded) |
| Baillie Gifford Global Discovery | 7.8 |
| AXA Framlington American Growth | 17.1 |
| Standard Life Global Smaller Companies | 6.8 |
| Jupiter Japan Income | 9.4 |
| Allianz UK Equity Income | 10.2 |
| Jupiter UK Smaller Companies | 11.2 |
| Premier Diversified | 27.3 |
| LF Miton European Opportunities | 10.2 |
Lower risk
| Name | Allocation % (rounded) |
| Baillie Gifford Global Discovery | 6.6 |
| FP Pictet Multi Asset Portfolio | 7.9 |
| Jupiter Japan Income | 7.9 |
| Jupiter UK Smaller Companies | 9.5 |
| Premier Diversified | 23.1 |
| Standard Life Investments UK Real Estate | 9.4 |
| TwentyFour Dynamic Bond | 13 |
| Allianz UK Equity Income | 8.7 |
| LF Miton European Opportunities | 8.5 |
| Blackrock European Absolute Alpha | 5.4 |

£200 Pension Cashback Offer
Make a qualifying deposit or transfer a pension to our partner Interactive Investor.
- Deposit or transfer a pension of at least £20k and you could earn £200 cashback
- Terms and Fees apply, Capital at risk
- New & Existing customers opening a SIPP
- Offer ends 31st July 2026
Before starting your transfer, check you won't lose any valuable benefits (such as guaranteed annuity rates or a lower protected pension age) and find out what exit fees you might have to pay
